Locating devices
Cumulocity provides the option to view all devices in your account on a map.
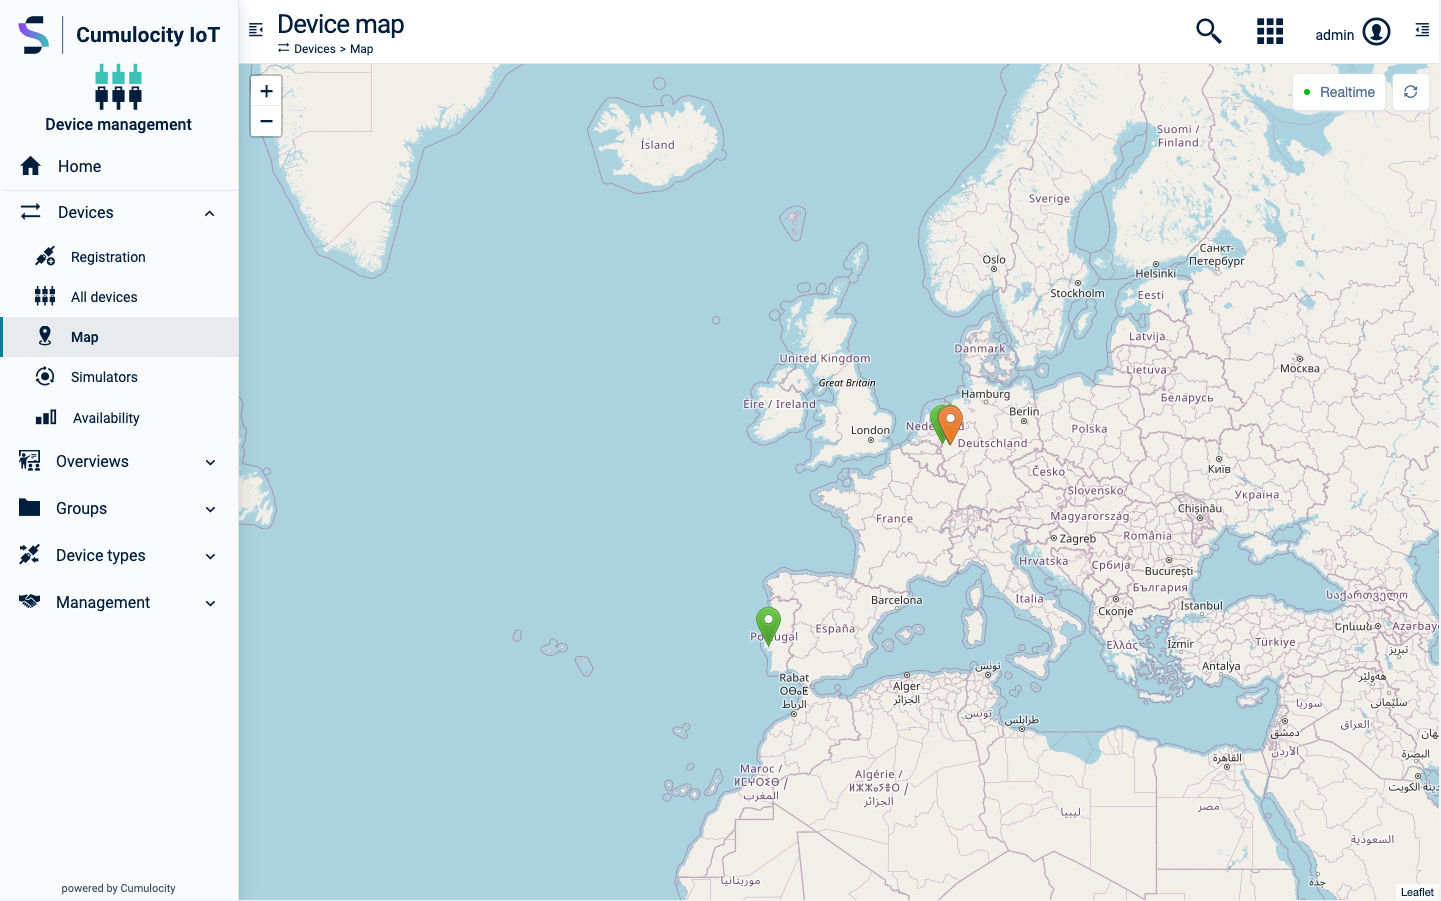
Click Map in the Devices menu in the navigator to display a map showing all devices in real time.
Devices are represented as “pins”. Click a pin to see the name of the respective device. Click the device name to switch to its device details.
Connection monitoring
In the Device Management application you can monitor the connections to your devices.
This can be done at the level of individual devices (see below) or across multiple devices in a list.
To monitor the connection for multiple devices
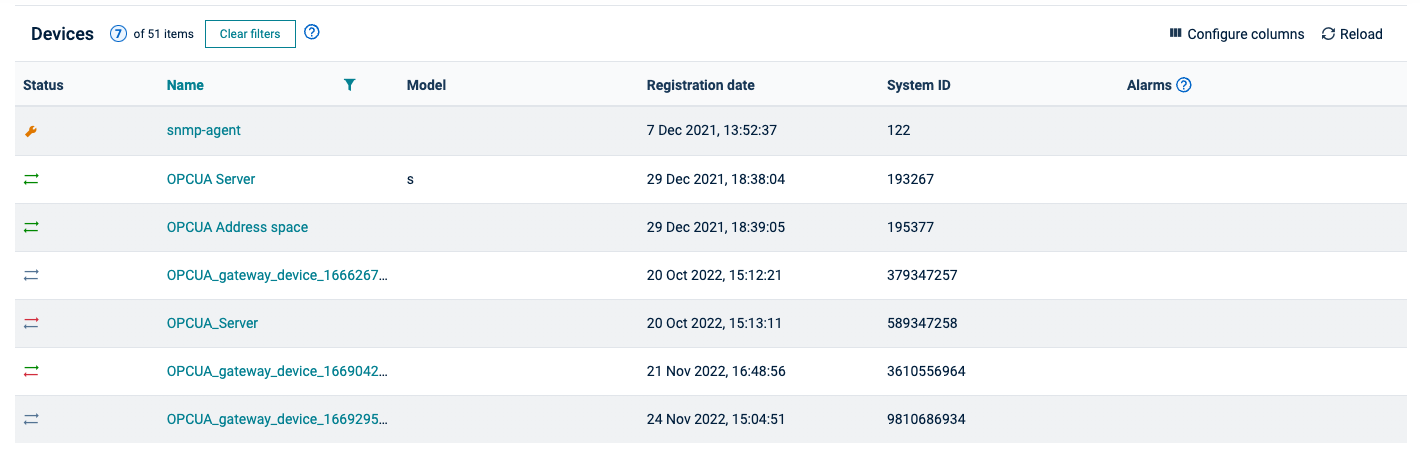
Open a device list to monitor the connections for multiple devices.
The connection status is represented by arrows in the Status column in the device list.
Send connections
The top arrow represents the send connection (traffic from the device to Cumulocity). The status for the send connections may be one of:
- Online (data was sent within the required interval)- indicated by a green arrow .
- Offline (data was not sent within the required interval) - indicated by a red arrow .
- Unknown or not monitored (no interval configured) - indicated by a grey arrow .
Hovering over the arrow displays the timestamp of the last request from the device to the server.
When a device is detected to be offline (stops sending data within required interval and top arrow changes to red color), an unavailability alarm is created for the device: “No data received from device within required interval”.
Send connections are updated when something is sent from the device, such as alarms, events, measurements or if a blank update is sent to the device itself. For details see Device availability.
Info
Empty PUT requests to the managed object of the device will also update a send connection. Such requests are the recommended way of implementing a heartbeat service that monitors the server status.
Push connections
The bottom arrow represents the push connection (from Cumulocity to the device). The status for the push connections may be one of:
- Online (connection established)- indicated by a green arrow .
- Offline (connection not established) - indicated by a red arrow .
- Not monitored - indicated by a grey arrow .
A push connection is an active HTTPS long poll connection to the /notification/operations API endpoint or an active MQTT connection to the MQTT endpoint of Cumulocity. It is always green if the device is connected, even without data.
Info
Connection monitoring is not real time. This means that the displayed connection status will not change immediately after switching off a device. Depending on the used protocol for push connection monitoring this can take a couple of minutes.
Maintenance mode
Moreover, the device may be in “Maintenance” mode, indicated by the tool icon in the Status column. This is a special connection status indicating that the device is currently being maintained and cannot be monitored. While a device is being maintained, no alarms for that device are raised.
You can turn the maintenance mode on or off for a device through a toggle in the Connection monitoring card in its Info tab, see below.
To monitor the connection of a particular device
Navigate to the Info tab of a particular device to monitor the connections of this device. Under Device status, the connection status for the device is displayed.
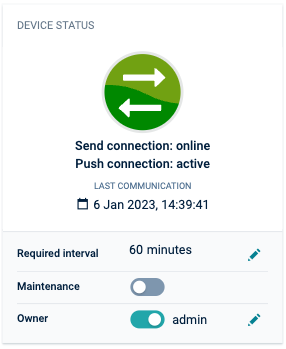
Below the send connection and push connection status, the time of the last communication is displayed.
Info
“Last communication” and “Last updated” are two entirely different time stamps. “Last communication” indicates when a device has last sent data. “Last updated” indicates when the inventory entry of the device was last updated. This update may have originated from the device, from the web user interface or from another application.
In the Required interval field you can specify an interval. This parameter defines how often you expect to hear from the device. If, for example, you set the required interval to 60, you expect the device at least to communicate once in an hour with Cumulocity. The interval is either set by the device itself, based on the device’s knowledge how often it will try to send data, or it is set manually by you.
If an interval is set, you will find the Maintenance toggle below it.
With the Maintenance toggle you can turn the maintenance mode for the device on or off which is immediately reflected in the connection status.
Availability
Cumulocity distinguishes between connection monitoring and availability. Connection monitoring, as described in the previous section, only indicates if the device is communicating with Cumulocity, it does not automatically indicate if it is functional or not.
Availability indicates if a device is in service. For example, a vending machine is in service if it is ready to sell goods. A vending machine can sell goods using cash money without a connection to Cumulocity. From the perspective of a merchant, it is in service. Similar, if you switch off the power on a gateway, the devices behind the gateway can still continue to work.
Cumulocity considers a device to be in service while there is no critical, unresolved alarm present for the machine. This is displayed as a share of time such an alarm was present. If a machine didn’t have any critical alarms whatsoever during a time period, it was 100% in service. If half of the time there was some critical, unresolved alarm, the machine was 50% in service.
While a machine is offline, Cumulocity assumes by default
- that the machine continues to stay in service during the connection outage, if this was the status before it lost connection.
- that the machine continues to stay out of service, if this was the status before it lost connection.
There may be exceptions from this rule. If your vending machines rely exclusively on cashless payment, losing the connection to the network means that your machine is out of service and stops selling. In this case, unavailability alarms must be set in the Administration application which have CRITICAL severity instead of MAJOR severity.
Cumulocity displays service availability at the level of individual devices and across all devices.
To view the availability of a particular device
Click the Availability tab in the details of a particular device to check the availability of this device.
To view the availability across all devices
Click Availability in the Device menu in the navigator to display the overall service across all devices.
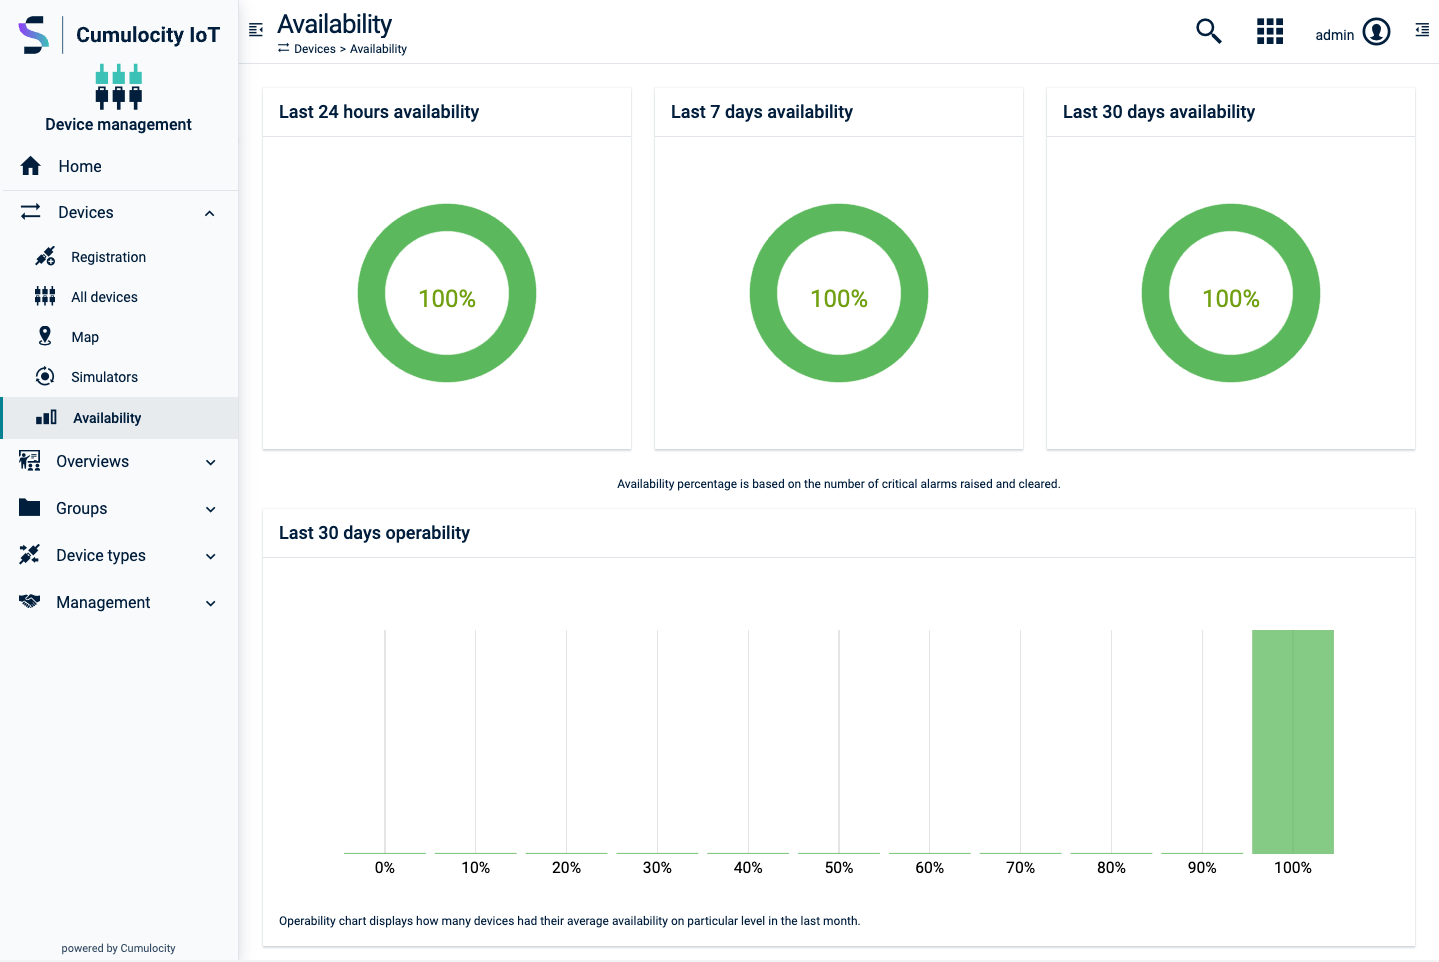
The Availability page shows the availability of devices for the last 24 hours, last 7 days and last 30 days in percentage.
Working with alarms
Devices can raise alarms to indicate that there is a problem requiring an intervention.
To view alarms
Cumulocity displays alarms at the level of individual devices and across all devices:
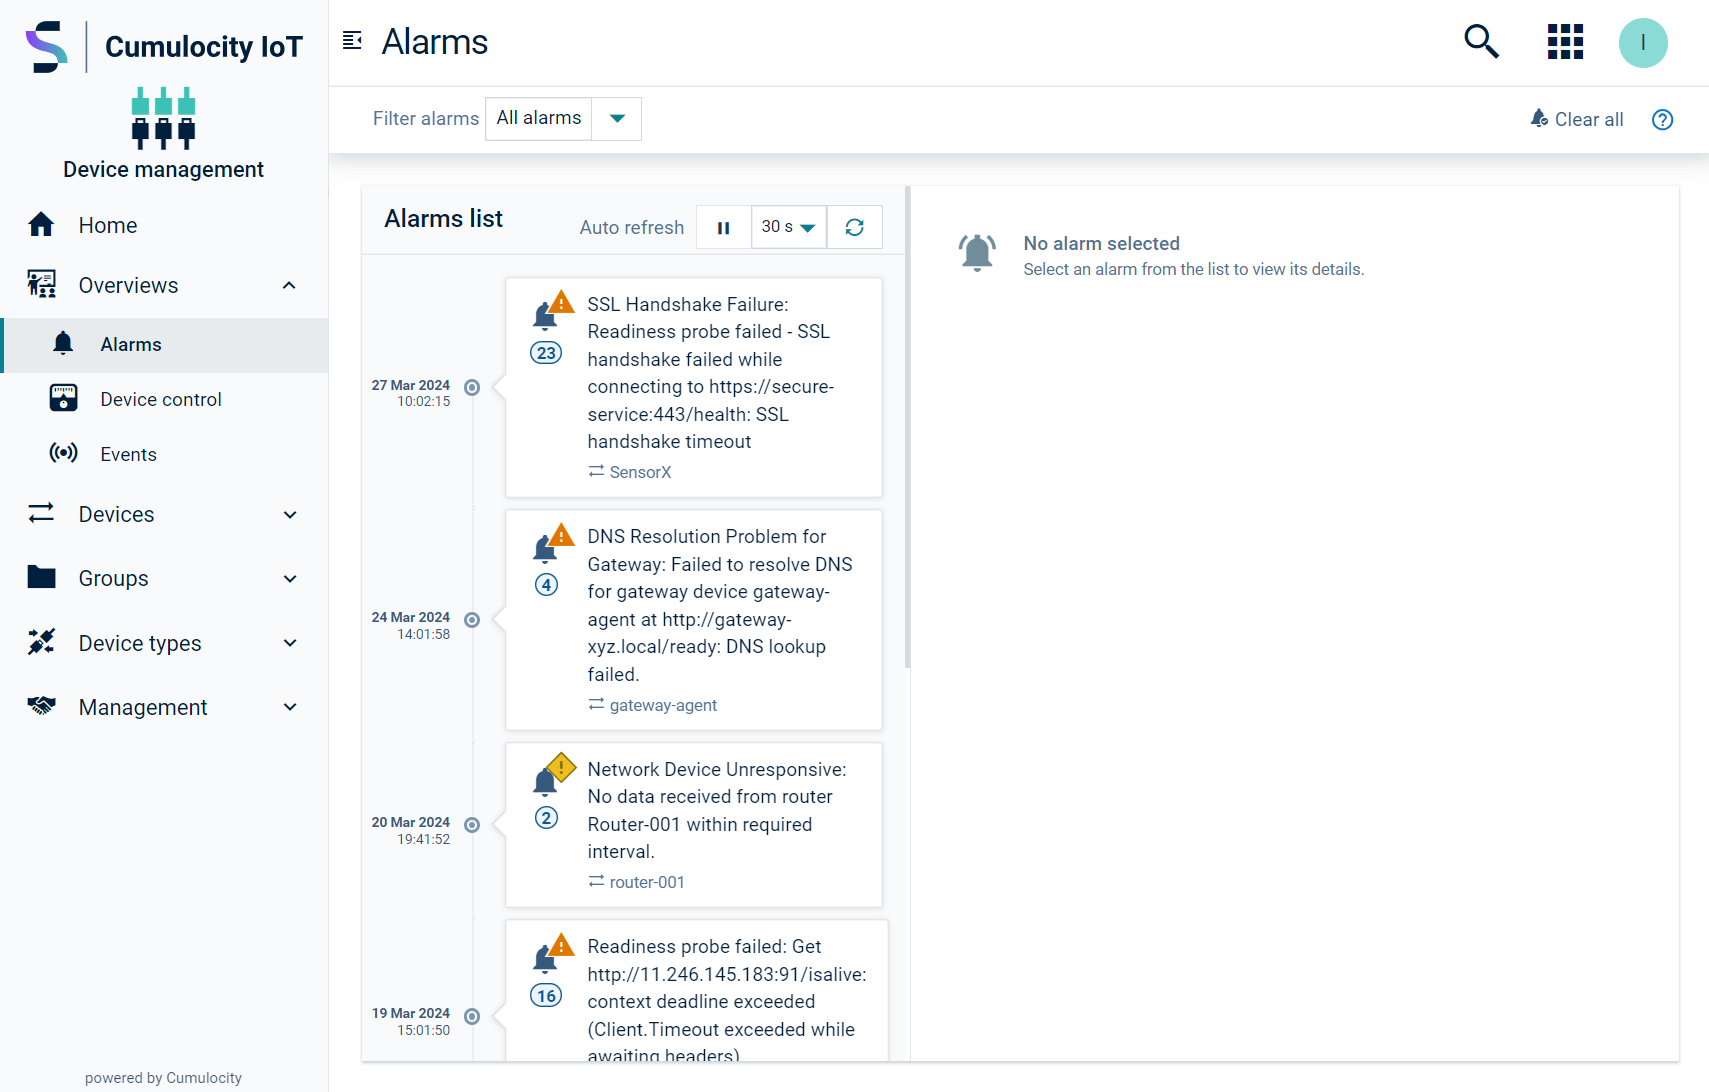
- To check the alarms for all devices, click Alarms in the Overview menu in the navigator.
- To check the alarms of a particular device, switch to the Alarms tab in the details of this device.
By default,
- only unresolved alarms are shown. If you turn on Show cleared alarms in the Filter alarms dropdown menu at the top, you will see the entire alarm history.
- The alarms list is automatically refreshed every 30 seconds. Click Disable auto-refresh to stop the alarms list from refreshing automatically.
Alarms are classified according to their severity. Cumulocity includes four different alarm types:
| Severity | Description |
|---|---|
| CRITICAL | The device is out of service and should be fixed immediately. |
| MAJOR | The device has a problem that should be fixed. |
| MINOR | The device has a problem that may be fixed. |
| WARNING | There is a warning. |
In the top menu bar, a Filter alarms dropdown list is provided. Select the severities to be shown and then click Apply.
Info
The number provided in the filter dropdown refers to the number of active alarms for the given severity, as opposed to the counter provided as blue circle next to an active alarm, which shows the number of times this same alarm has occurred (see also the table below).
Within the Alarms list, the alarms are sorted by their occurrence, displaying the most recent alarm first.
In the Alarms list, the following information for an alarm is provided:
| Info | Description |
|---|---|
| Severity | One of CRITICAL, MAJOR, MINOR, WARNING (see above). |
| Count (provided as number in a blue circle) | The number of times this alarm was sent by the device. Only one alarm of a particular type can be active for a certain device. If another alarm of the same type is sent by the device, the number is increased by 1. |
| Description | An arbitrary text describing the alarm. |
| Status | The status of the alarm. An alarm can be: Active: When it was raised and nobody is so far working on the alarm. Acknowledged: When someone changed the status to "Acknowledged" to indicate that someone is working on the alarm. Cleared: When either someone manually set the status to "clear" or when the device detected by itself that the problem has gone. |
| Last occurrence | Timestamp of the last occurrence of the alarm (device time). |
| Device | The name of the device. |
To display further details about an alarm, click on the respective alarm in the Alarms list.
- Status: Provides further information on the alarm status and shows the type of the alarm. The type info is used for duplicating alarms and for configuring the priority of alarms in Alarm mapping.
- Audit Logs: Provides the server time when the alarm was created, which may differ from the device time.
- First Occurrence: Provides information about when the alarm first occurred.
To change the status of an alarm
To change the status of an alarm, select the alarm and choose the desired status.
 It is also possible to change the status of all alarms to “clear” at once. Click Clear all in the top menu bar, to clear all alarms of the selected severities.
Alarm permissions and inventory roles
When assigning permissions to inventory roles with a non-asterisk value, keep the following in mind:
- These roles apply only to custom fragments of alarms (that is, user-defined fields).
- It is not possible to specify or control access to standard alarm schema fields, such as
statusorseverity.
Because of this limitation, users with such roles can only update the specified custom fragments. Any attempt to modify standard fields will result in a “Security/Forbidden” error.
Acknowledging alarms
Acknowledging or clearing an alarm updates the status field, which is part of the standard schema. Therefore, the only way to allow users to perform these actions is to assign an inventory role with an asterisk (*) type, which grants access to all fields, including those in the standard schema.
Working with operations
Operations are used to remotely control devices.
You can view operations at the level of individual devices and across all devices:
- To view the operations for all devices, click Device control in the Overview menu in the navigator.
- To view the operations of a particular device, switch to the Control tab in the details of this device.
There are two types of operations in Device control, each represented by a tab:
- Single operations execute on a single device, see To view single operations.
- Bulk operations comprise of the same single operation executed on a set of devices, see To view bulk operations.
To view single operations
See the list of single operations in the Single operations tab.
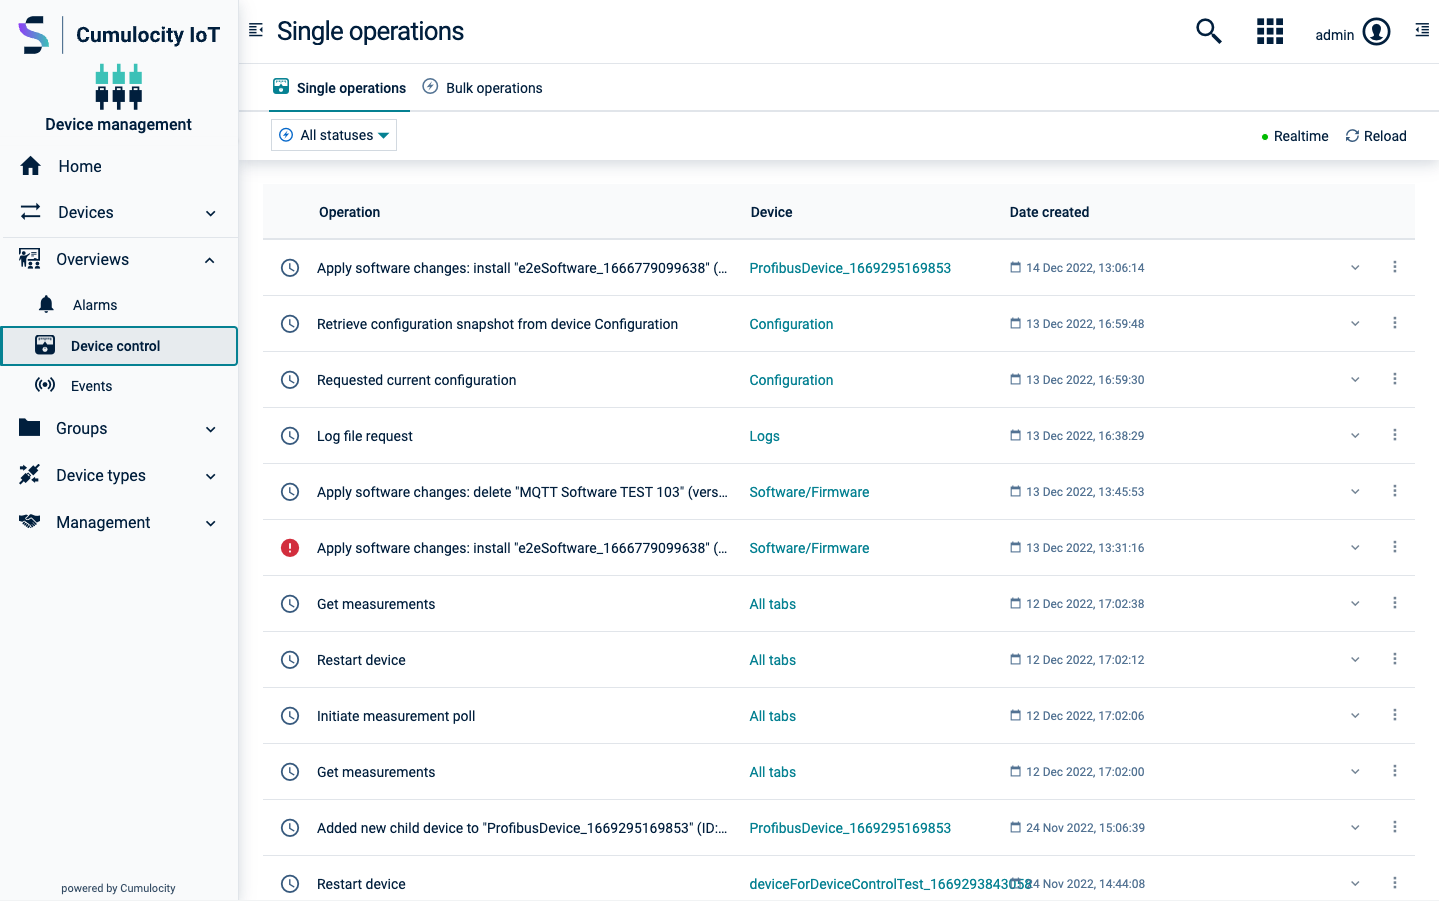
Single operations can have one of the following four statuses:
| Status | Description |
|---|---|
| PENDING | The operation has just been created and is waiting for the device to pick it up. |
| EXECUTING | The operation has been picked up by the device and is being executed. |
| SUCCESSFUL | The operation has been successfully executed by the device. |
| FAILED | The operation could not be executed by the device. |
In each row, the following information for an operation is provided:
| Info | Description |
|---|---|
| Status | One of PENDING, EXECUTING, SUCCESSFUL, FAILED (see above). |
| Name | Name of the operation. |
| Device | The name of the device. Clicking the name leads you to the detailed view of the device. |
Clicking a row expands it and displays further details on the operation.
- Details: Providing information on the operation name and status. In case of status = FAILED the reason for the failure is provided. In case the single operation is part of a bulk operation, you can see the bulk operation details.
- History of Changes: Providing information on the past changes of the operation.
To filter the list of single operations by status, click one of the status buttons in the top menu bar. Click All to clear the filter.
Click Realtime at the right of the top menu bar to see operations coming in from the devices in realtime. Click Reload to update the list once manually.
Info
Single operations are listed in descending time order. Operations are executed strictly according to this order.
To add and execute a single operation
Single operations can be created either from bulk operations or via the different types of operations that the device supports: managing firmware, software, configurations and more.
When you create a bulk operation, the single operations entailed in the bulk operation are also added to the list of single operations.
Operations for a specific device can also be created and executed in the Shell tab of the device, see Shell.
Important
When using Cumulocity to remotely operate machinery, make sure that all remote operations follow the safety standards and do not cause any harm.
To cancel pending single operations
To cancel a particular pending single operation, click the menu icon at the right of the respective single operation entry and select Cancel operation.
To create a smart rule from a single operation
Click the menu icon at the right of the single operation that you want to create a smart rule for, and select Create smart rule.
See To create a smart rule for further steps.
To view bulk operations
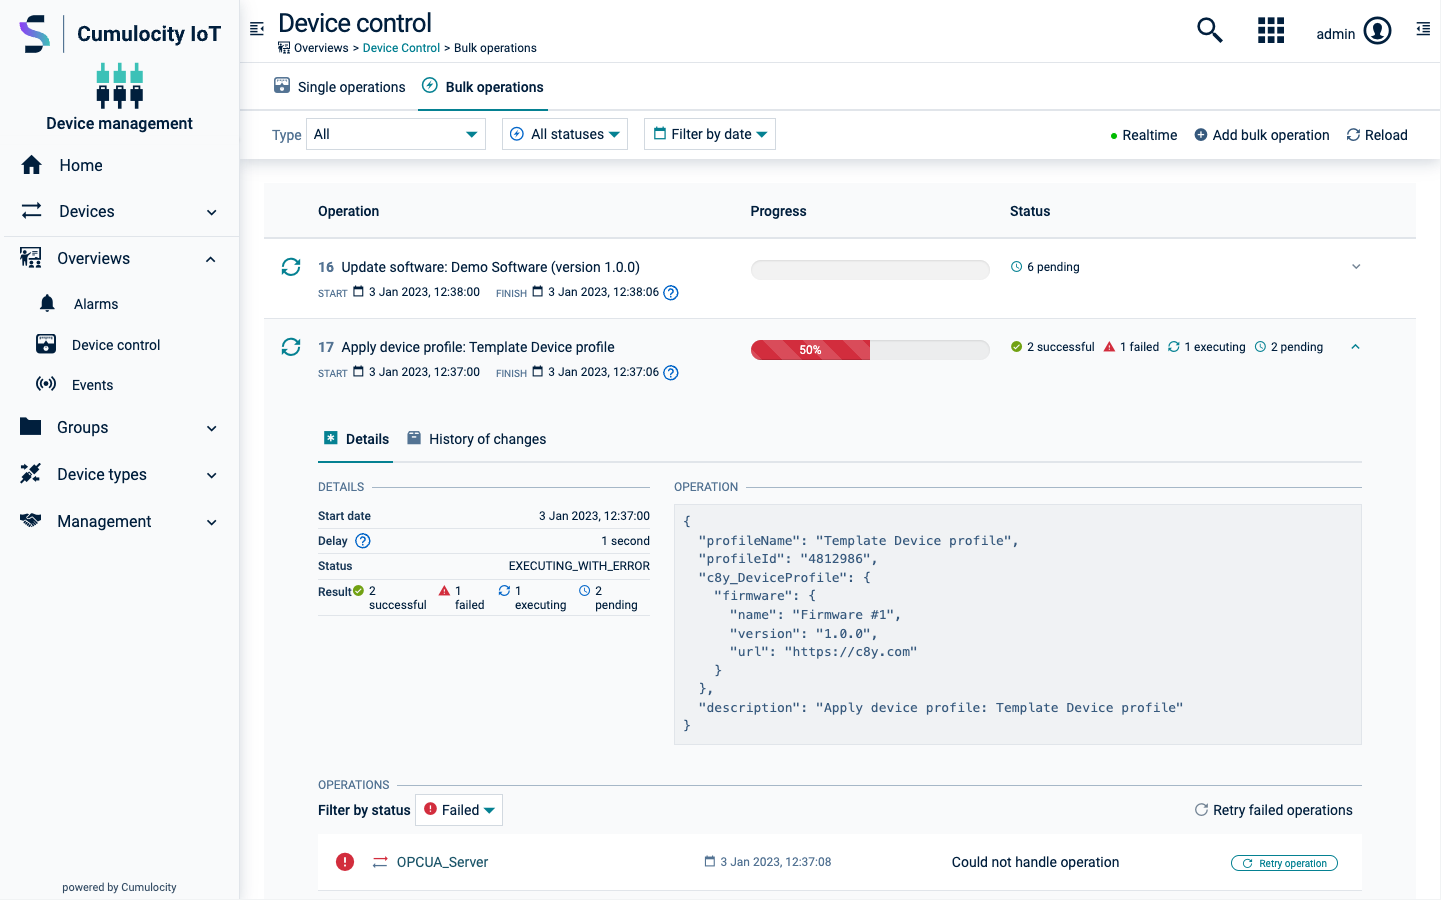
See the list of bulk operations in the Bulk operations tab.
Bulk operations have an operation type and status.
You can add bulk operations of the following operation types with the bulk operation wizard:
| Operation type | Description |
|---|---|
| Configuration update | The bulk operation updates the configuration of the selected devices. |
| Firmware update | The bulk operation updates the firmware on the selected devices. |
| Software update | The bulk operation updates the software on the selected devices. |
| Apply device profile | The bulk operation applies a device profile on the selected devices. |
Bulk operations can have other operation types as well, for example when you schedule a single operation as bulk operation and the single operation has a different operation type.
Bulk operations can have one of the following statuses:
| Status | Description |
|---|---|
| SCHEDULED | The bulk operation has been created and is on hold until the scheduled time. |
| EXECUTING | The bulk operation is being executed. |
| CANCELED | The bulk operation was created but canceled before the scheduled time. |
| COMPLETED WITH FAILURES | The bulk operation completed with failures for some devices. |
| COMPLETED SUCCESSFULLY | The bulk operation has been successfully executed on all devices. |
In each row, the following information for a bulk operation is provided:
| Info | Description |
|---|---|
| Status | One of SCHEDULED, EXECUTING, CANCELED, COMPLETED WITH FAILURES, COMPLETED SUCCESSFULLY (see above). |
| Name | Name of the operation. |
| Progress bar | Only for executing and completed bulk operations. Shows the operation’s progress in percent. |
| Start and finish dates | Only for executing and completed bulk operations. For executing bulk operations, the finish date is an approximation based on the bulk operation settings. |
| Refresh button | Only for executing bulk operations. Updates the progress bar. |
Clicking the arrow button at the right in a row expands the row and displays further details on the bulk operation.
- Details: Providing information on the start date, delay, status and result of the bulk operation. The result lists the number of successful, failed and pending operations. If the bulk operation is a retry attempt for failed operations, there will be an additional row that shows the index of the bulk operation it was retried from. Click the index to scroll to that bulk operation. If a description was added when the bulk operation has been created, there will be an additional row that shows this description.
- Operation: Providing information on the operation in the form of a JSON object.
- Operations: Only present for executing or completed bulk operations. Providing information on the status and the device of single operations entailed in the bulk operation. Can be filtered by status. You may also either retry all failed operations by clicking Retry failed operations at the top right of the Operations section or retry single operations by hovering over them and then clicking the Retry operation button that appears right next to it. Also see To retry failed operations.
- History of Changes: In a second tab, providing information on the past changes of the bulk operation.
To filter the list of bulk operations by operation type, click the dropdown list in the top menu bar and select a set of operation types, then click Apply. To clear the filter, select All in the dropdown list and click Apply once more.
To filter the list of bulk operations by status, click one of the status buttons in the top menu bar. Click All to clear the filter.
To filter the list of bulk operations by date, select a date in both the Date from and Date to datepickers, then click Apply right next to it. To clear the filter, click Clear right next to it.
To clear both filters, click Reset filters at the bottom of the list (only visible if filters are applied).
To add a bulk operation
There are two ways of creating a bulk operation:
To add a bulk operation using the wizard
Follow these steps:
- In the Bulk operations tab, click New bulk operation at the right of the top menu bar.
- In the resulting dialog, select an operation type.
- The resulting wizard has four steps. The first two steps differ depending on the operation type:
- Configuration update
- Select a configuration from the list. The list can be filtered by configuration type or by configuration name. Click Next.
- Check the preview of the selected configuration. Click Next.
- Firmware update
- Select a firmware from the list. The list can be filtered by firmware name. Click Next.
- Expand a version and select a patch. Click Next.
- Software update
- Expand a software from the list and select a version, then also choose to install/update or remove the software from the dropdown list. The list of available software can be filtered by device type, by software type or by software name. Click Next. If you selected software for multiple device types, a warning dialogue appears and informs you that some operations may fail due to unsupported software, and ask for confirmation.
- Confirm the selection and click Next.
- Apply device profile
- Select a device profile from the list. The list can be filtered by device type or by profile name. Click Next.
- Confirm the selection and click Next.
- Select target devices by applying filters to the paginated list of all devices. You can filter by status, name, type, model, group, registration date and alarms. You may apply multiple filters. To apply a filter, click the column header, make your filter option choices in the context menu and click Apply. The group filter also allows filtering by subgroups. To select a subgroup, if there are any, click the arrow button at the right of a group and select the desired subgroups from the dropdown. You can clear all filters by clicking Clear filters above the list. For the operation types “configuration update”, “software update” and “apply device profile”, the list is already filtered by the according device type. Click Next.
- Enter a new title or use the preset title. Optionally enter a description. Select a start date and a delay. The delay may either be in seconds or milliseconds and is the time spent between each single operation of the bulk operation. Click Schedule bulk operation to create the bulk operation.
To schedule a single operation as bulk operation
You can schedule a single operation as a bulk operation either from the Single operations tab or from a Control tab of a particular device. Follow these steps:
- Click the menu icon at the right of the single operation that you want to schedule as a bulk operation and then click Schedule as bulk operation.
- The resulting wizard is similar to the new bulk operation wizard described in To add a bulk operation using the wizard. However, there are just two steps because the operation type is inferred from the operation that is scheduled as a bulk operation. See the description of the full wizard and follow it.
To edit the schedule of bulk operations
You may only edit the schedule of bulk operations with status = SCHEDULED.
- Click the menu icon to the right of the bulk operation that you want to edit, and then click Edit schedule.
- In the resulting dialog box you may change the Start date and Delay values.
- Click Reschedule to apply your changes.
The changes are applied to the bulk operation accordingly.
To cancel bulk operations
You may only cancel bulk operations with status = SCHEDULED or EXECUTING. If it is executing, you may only cancel the operation until all of its single operations are created. This way, you can cancel the creation of the remaining single operations.
Click the menu icon to the right of the bulk operation that you want to cancel, then click Cancel bulk operation.
To retry failed operations
You may retry the failed operations of a bulk operation that is either executing or completed with failures.
To do so, expand the desired bulk operation, then click Retry failed operations under Operations to create a new bulk operation with all failed operations. To retry a single operation, hover over the operation and click Retry operation. This will create a new single operation.
For a bulk operation that completed with failures, you may also click the menu icon to the right of the operation, then click Retry failed operations.
To manually set failed bulk operations to successful
You may manually set a failed bulk operation to the status SUCCESSFUL.
To do so, click the menu icon to the right of the bulk operation, then click Set operation to successful.
This may be useful if the operation is generally a success, but contains operation failures on devices that are not too important. These failures would otherwise still leave the bulk operation in status FAILED.
Info
Calculation of completion percentage
The completion percentage is determined by comparing the total number of initiated operations to the number of operations that have reached a final state (success or failure). The total count is established at operation creation and remains static thereafter. This static value may lead to inaccuracies in the completion percentage if the overall number of operations subsequently changes.
- Operation removal: Operations can be implicitly removed when their associated devices are deleted. This deletion goes unaccounted for in the completion percentage calculation.
- Operation addition: Retrying failed operations can introduce new entries without modifying the original total count. This again results in a misrepresentation of the completion percentage.
The completion percentage is calculated based on the information available at the time an operation is created and further changes are not applied.
Troubleshooting devices
Troubleshooting devices at a more detailed level can be done with the help of events. Events are low-level messages sent by devices that are usually used for application-specific processing. For example, a vending device sends its real-time sales in the form of events.
To view events
Cumulocity displays events at the level of individual devices and across all devices:
- To view the events for all devices, click Events in the Overview menu in the navigator.
- To view the events of a particular device, switch to the Events tab in the details of this device.
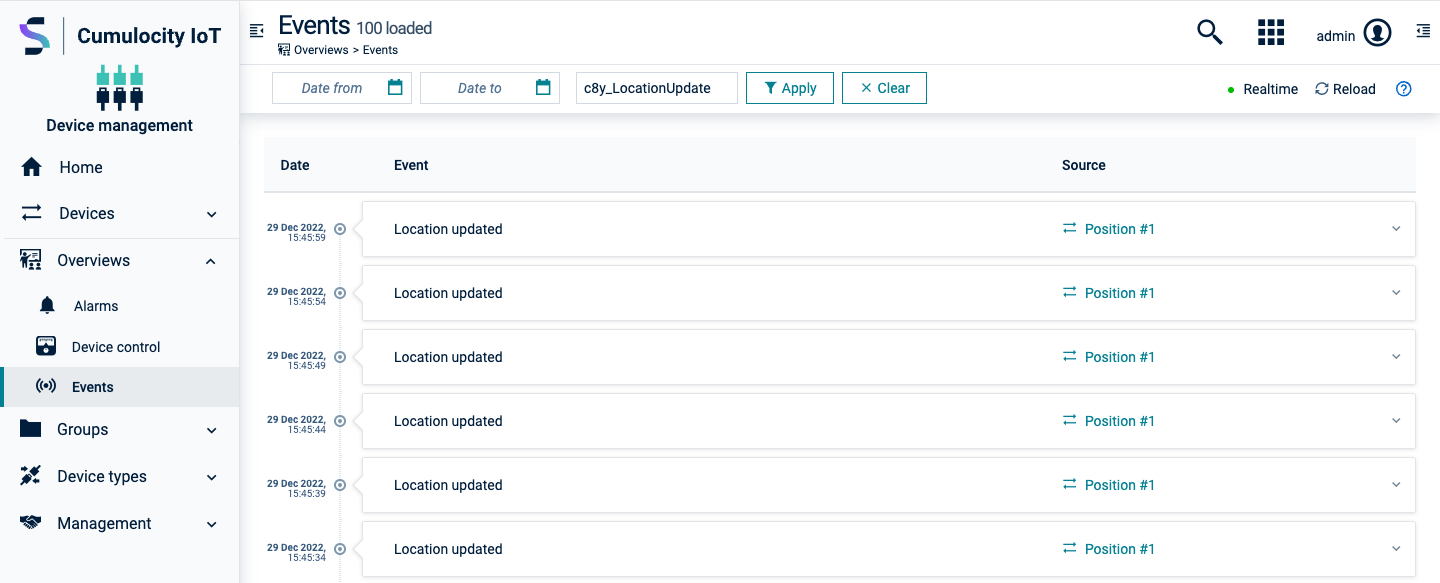
By default, events are displayed as they come in from the devices at selected intervals (30 seconds by default). To pause pooling updates, click the button with the countdown timer next to the Auto refresh label.
For each event, the following information is provided:
| Info | Description |
|---|---|
| Timestamp | Timestamp when the event has been executed. |
| Name | Name of the event. |
| Device | The name of the device sending the event. Clicking the name leads you to the detailed view of the device. |
In the event list, the latest entry is displayed on top.
Clicking a row opens the details of the selected event and displays further details on the event (such as the type and position of the device).
Since devices may send large amounts of event data, you can filter the data to be displayed by date.
To do this, select the date filter in the top menu bar and choose one of the predefined date ranges or create a custom one. After selecting and filling in a custom date range, click Apply*.