Getting started with Analytics Builder
What is Analytics Builder
Analytics Builder allows you to build analytic models that transform or analyze streaming data in order to generate new data or output events. The models are capable of processing data in real time.
You build the models in a graphical environment by combining pre-built blocks into models. The blocks in a model package up small bits of logic, and have a number of inputs, outputs and parameters. Each block implements a specific piece of functionality, such as receiving data from a sensor, performing a calculation, detecting a condition, or generating an output signal. You define the configuration of the blocks and connect the blocks using wires. You can edit the models, simulate deployment with historic data, or run them against live systems. See Understanding models for more detailed information.
Analytics Builder consists of the following tools:
- Model manager. When you invoke Analytics Builder, the model manager is shown first. It lists all available models and lets you manage them. For example, you can test and deploy the models from the model manager, or you can duplicate or delete them. You can create new models or edit existing models; in this case, the model editor is invoked. Samples are also available which help you get started with creating your own models. See Using the model manager for detailed information.
- Model editor. The model editor lets you define the blocks that are used within a model and how they are wired together. User-visible documentation (the so-called block reference) is available in the model editor, describing the functionality of each block. See Using the model editor for detailed information.
- Instance editor. If template parameters have been defined in a model, the instance editor lets you set up different instances of the same model which can then be activated and managed separately. The instance editor uses the template parameters that have been defined in the model editor. See Using the instance editor for detailed information.
The blocks are implemented in the Event Processing Language (EPL) of Apama. At runtime, the EPL code runs in an Apama correlator to execute the models. Some runtime behavior and restrictions are important to understand. These are documented in later topics.
First Steps: Creating your first model
This topic gives a brief overview of how to add and design a new model, and how to view its output. It is not intended to be a comprehensive description of the full range of possibilities provided by Analytics Builder. Therefore, explanations are kept to a minimum. For more detailed information, see the remainder of this documentation.
The steps below require that at least one device has already been registered in Cumulocity. Preferably, this is a device which is already sending measurement values to Cumulocity. These first steps assume that you are using a smartphone on which the Cumulocity Sensor App has been installed, see Cumulocity Sensor App for details.
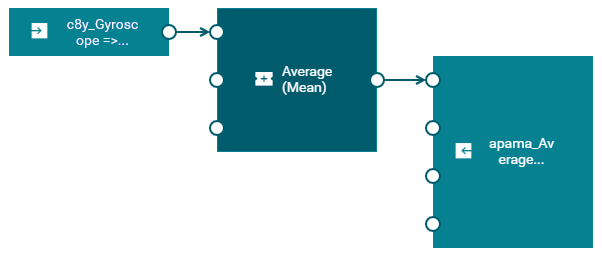
The model that you add will contain three blocks:
- An input block which receives measurement values from a device.
- A block that calculates the mean of the measurement values over time.
- An output block that sends the calculated mean values to Cumulocity’s Device Management application so that they can be viewed there.
When you have completed all steps below, your model will look similar to the following:
Step 1: Switch to Analytics Builder
On the home screen of the Streaming Analytics application, click the Open button that is shown below the Analytics Builder heading.
Alternatively, click Analytics Builder in the navigator on the left.
Info
If the navigator is currently hidden, click the small arrow at the very left of the top bar to toggle the display of the navigator.
Step 2: Add a new model
The first page that is shown when you invoke Analytics Builder is the model manager.
- On the Models tab, click New model in the toolbar.
- In the resulting dialog box, enter a model name and click OK.
Step 3: Add the input block
You design your model in the model editor. The model editor is shown after you have entered the model name. The palette which is shown on the left contains all blocks that can be added to a model. You add a block by dragging it from the palette onto the canvas.
- In the palette, expand Input.
- Drag the Measurement Input block onto the canvas.
The block parameter editor is automatically shown.
InfoIf the block parameter editor is not shown (for example, because you clicked an empty space on the canvas after dragging the input block onto the canvas), click the block using the left mouse button to show the block parameter editor.
- Click the menu that is shown for Input Source. In the resulting dialog box, click the Select device button for the device that you want to use. This button is shown when you hover over a device.
InfoBy default, an input block is listening to all input sources, that is, the All Inputs option is set. However, these first steps assume that you are using your smartphone. Therefore, you must select a single device as described above.
- From the Fragment and Series drop-down list box, select the fragment and series for which the input block is to listen. If the device has previously sent data, the drop-down list box offers one or more values for selection. An example for the Cumulocity Sensor App would be c8y_Gyroscope => gyroscopeY.
- Select the Ignore Timestamp checkbox. This makes sure that the measurements are processed in the same order as they are received.
If you need detailed information on the currently selected block, view the block reference in the documentation pane on the right. If the documentation pane is currently not shown, click the document icon .
Step 4: Add the block that calculates the mean of the measurement values
- In the palette, expand Aggregate.
- Drag the Average (Mean) block onto the canvas.
- In the block parameter editor, specify a value for Window Duration (secs), for example “10”. The specified number of seconds will be used to control what duration the measurement is averaged over. Smaller values will react quicker to changes in values, larger values will give more smoothing of the value.
Step 5: Add the output block
- In the palette, expand Output.
- Drag the Measurement Output block onto the canvas.
- As the output destination, select the same device as for your input block.
InfoIf you have kept the default option of All Inputs for the input block, you must set the output destination to Trigger Device. However, these first steps assume that you are using a single device, so you must select the same device as for your input block.
- Specify “apama_Average” as the fragment name.
- Specify “value” as the series name.
Step 6: Connect the blocks
To pass the values from one block to another, you must connect the blocks with wires. You attach the wires to the ports, that is, to the small circles that are shown to the left and/or right of a block.
- Click the Value output port of the input block and drag the mouse to the Value input port of the Average (Mean) block.
- Click the Average output port of the Average (Mean) block and drag the mouse to the Value input port of the output block.
Step 7: Save the model and go back to the model manager
- In the toolbar of the model editor, click the save icon to save your newly created model.
- In the toolbar of the model editor, click the close icon to leave the model editor and thus to return to the model manager.
Info
Only saved models are listed on the Models tab of the model manager. When you add a new model and then leave the model editor without saving the model, it will not be listed in the model manager, and all the edits you made will be lost.
Step 8: Activate the model in production mode
A card for the newly added model is shown on the Models tab of the model manager. A new model is automatically set to draft mode and inactive state. You will now activate your new model in production mode. This deploys the model so that the measurements from your device are processed.
- Click the drop-down menu on the card which currently shows Draft and select Production.
- Click the toggle button on the card which currently shows Inactive. This changes the state to Active.
Step 9: Go to the Device Management application and view the measurements
To view the measurements that are sent from your active model, you must switch to the Device Management application. See Device Management application for detailed information.
- Go to the Device Management application.
- In the navigator on the left, click Devices and then All devices.
- Locate your device and click its name to display the device details.
- Click Measurements on the left. This is a dynamic tab which is only shown when measurements are available for the device. The resulting page shows several charts, visualizing the data sent from your device. It should now also show a chart titled “Apama_average” in which you can view the values that are sent from your newly created model. You may have to reload the page to see this new chart. See Measurements for more information on the Measurements tab.
First Steps: Creating a model from a sample
This topic gives a brief overview of how to create a model from a sample. It is based on the On missing measurements create alarm sample. Your new model will create an alarm if no new measurement data has been received for a specified time period.
This topic is not intended to be a comprehensive description of the full range of possibilities provided by Analytics Builder. Therefore, explanations are kept to a minimum. For more detailed information, see the remainder of this documentation.
The steps below require that at least one device has already been registered in Cumulocity. Preferably, this is a device which is already sending measurement values to Cumulocity. These first steps assume that you are using a smartphone on which the Cumulocity Sensor App has been installed, see Cumulocity Sensor App for details.
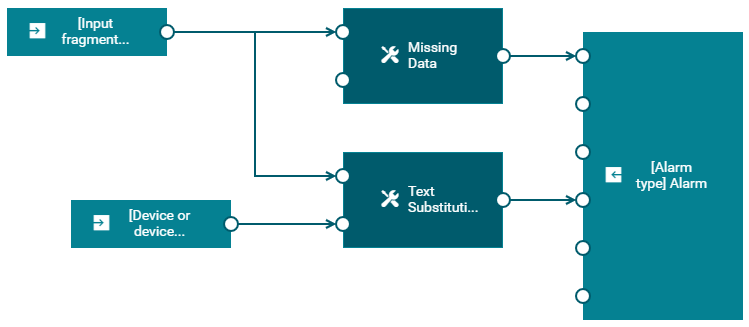
The following image shows the blocks that are defined in the On missing measurements create alarm sample.
The sample uses predefined template parameters. After you have created a model from the sample, you can create multiple instances of the model and you can specify different values for the template parameters. See also Models which explains the difference between models without template parameters and models with template parameters.
The following is a brief description of the blocks that are defined within the sample:
- The input starts with the Measurement Input block waiting for new incoming measurements that match a given value that is defined with the Input fragment and series template parameter. The name of that parameter is the label that you can see on the input block.
- The output from the Measurement Input block is then passed to the Missing Data block which triggers an output if no input is received within the time defined with the Duration (seconds) template parameter.
- The output from the Missing Data block is used as the trigger for the Create Alarm input port of the Alarm Output block. The name of the Alarm type template parameter is the label that you can see on the output block.
- The output from the Measurement Input block is also passed as input to the Object input port of the Text Substitution block, along with the input from the Managed Object Input block which is passed to the Source input port of the Text Substitution block. The name of the Device or group of devices template parameter is the label that you can see on the input block.
- The Text Substitution block supports replacement of placeholders. For example, if the input text is “Missing measurements of type: #{type}”, then the
#{type}value is replaced by the actualtypeof the measurement. See Text Substitution for more details. - The Text Substitution block is configured to use the Alarm text template parameter as user input. It applies the required substitutions and then sends the string containing the substitutions from its Output output port to the Message input port of the Alarm Output block.
- The Alarm Output block requires the Alarm type and Alarm severity template parameters to be configured and creates an alarm whenever it is triggered by the Missing Data block.
Step 1: Create a new model from a sample
The Samples tab of the model manager lists all sample models that are provided with Analytics Builder. You can view a sample by simply clicking on its card, but you cannot edit or deploy it. However, you can use the samples as a basis for developing your own models, by creating a model from a sample.
- Go to the Samples tab of the model manager.
- Click the actions menu of the On missing measurements create alarm sample and then click Create model from sample. The new model is immediately shown in the model editor. It has the same name, description and tags as the sample.
- If you want to rename the model, click Model settings which is shown at the left of the toolbar. You can then specify a new name in the resulting dialog box.
- In the toolbar of the model editor, click the save icon to save the new model.
- In the toolbar of the model editor, click the close icon to leave the model editor and thus to return to the model manager.
InfoKeep in mind that only saved models are listed on the Models tab of the model manager.
Step 2: Create a new instance of the model
The sample model uses template parameters. So when you turn the sample into a model, you create a so-called template model. You cannot activate a template model directly in the model manager. Instead, you must create at least one instance of the model, and you can then activate that instance using the instance editor.
- On the Models tab of the model manager, locate the card for your newly created model.
- To invoke the instance editor, click 0 Instances which is currently shown on the card.
- Click New Instance to create the first instance of your new model.
Step 3: Fill in the template parameter values
In the instance editor, a row is shown for each instance that you create. A column is provided for each template parameter that is defined in the template model, with the name of the template parameter being the column header. As long as an instance is not active, you can adjust the values for that instance.
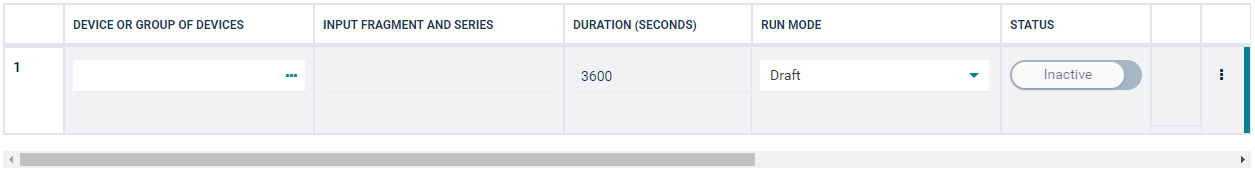
Use the horizontal scroll bar below the instance table if not all template parameters (columns) are shown on the screen.
-
Click the field below the Device or group of devices column header. In the resulting dialog, click Select device for the device that you want to use for this instance.
-
In the text box below the Input fragment and series column header, specify the details of the measurement input that you want to monitor in the following format:
<valueFragmentName>.<valueSeriesName>For example, if the measurement fragment is
c8y_Gyroscopeand the series isgyroscopeX, then you must enter the following:c8y_Gyroscope.gyroscopeXTipIf you want to find out which fragments and series are available to your device, without changing the predefined template parameters of the Measurement Input block, go back to the model editor, drag the input block for your device from the palette onto the canvas and open the Fragment and Series drop-down list box. This lists all the values that you can use. However, instead of the=>that you can see in the drop-down list box, you must use a dot (.) in this case. Don’t forget to remove this block again after you have decided which value to use. -
The fields below the Duration (seconds), Alarm type, Alarm text and Alarm severity column headers already contain default values (see also the above description of the blocks). Adapt them to your requirements. For example, change the duration to 30 seconds, rename the alarm type to “MyAlarmType”, keep the predefined alarm text, and set the alarm severity to Minor.
-
In the toolbar of the instance editor, click Save.
Step 4: Activate the instance
You will now activate the instance in production mode. This deploys the instance so that the measurements from your device are processed.
- In the Run Mode column of the instance editor, click the drop-down menu for the instance and select Production.
- In the Status column of the instance editor, click the button which currently shows Inactive to change the status to Active.
Step 5: Send in the data from your device
Once the instance has been activated, send in the data from your device. The instance starts monitoring the device once measurement data starts arriving and creates an alarm if no data is received within the configured duration.
For our example case with the gyroscope measurements from a smartphone, it should be sufficient that you simply turn off the smartphone display while the Cumulocity Sensor App is still running.
Step 6: Go to the Device Management application and view the alarms
To view the alarms that are sent from your active instance, you must switch to the Device Management application. See Device Management application for detailed information.
- Go to the Device Management application.
- In the navigator on the left, click Devices and then All devices.
- Locate your device and click its name to display the device details.
- Click Alarms on the left.
- On the resulting page, check the alarms that are sent from your device. If you have edited your instance as described above, you should see a MINOR alarm after 30 seconds, saying “Missing measurements of type: c8y_Gyroscope”. See Working with alarms for more information on the Alarms tab.
Understanding models
Models
A model is a container which can have a network of blocks connected to each other with wires.
The behavior of a block inside a model does not depend on other blocks. There can be multiple instances of the same block in a model where each instance may behave differently, depending on the configurable parameters or the inputs connected to the block.
You can create two different types of models: models without template parameters and models with template parameters.
Models without template parameters
All blocks in the model use defined input devices or ranges of devices and contain defined parameter values. Such a model can be activated immediately in the model manager.
Models with template parameters
A model in which one or more template parameters are defined is called a “template model”. Template parameters can be bound to any number of block parameters, provided that the type of the block parameter is the same as that of the template parameter.
For example, you can define a template parameter for the device name and another for the threshold value. These template parameters can later be set individually in the different instances of the model. For example, one template parameter can specify a device which can then be used for several input and output blocks. Or one instance can use device ABC with a threshold value of 100, and another instance can use device XYZ with a threshold of 200. Models with template parameters are not activated directly in the model manager. You must create at least one instance of the model, and you can then activate each instance separately using the instance editor.
The scope of the template parameters is local to the model in which they are defined. In other words, template parameters defined in one model cannot be used in any other model that is deployed in same tenant or subtenant. The names of the template parameters must be unique within the scope of the model in which they are defined.
There are two relevant roles for this type of model, this can be the same person or different persons:
- Model author. The model author creates the model and defines all of its blocks, parameters and wires. Most importantly, the model author creates the template parameters and binds them to the appropriate parameters in selected blocks.
- Instance maintainer. The instance maintainer creates the instances of the model and assigns values to the template parameters that are to be used by each instance.
The model author has the following options to define a template parameter:
- It can have default value which is provided as the default value in the instance editor. The instance maintainer may then leave it at the default value or change it to another value.
- It can be optional. The instance maintainer then has the possibility to either provide a value or leave it blank.
- It can be required. The instance maintainer must then provide a value. A required value is one that is not optional and has no default value.
Template model instances
Template model instances hold the values to be used in models with template parameters.
For example, two devices may have similar checks on data from the devices, but use different threshold values for those checks. In this case, you would configure an instance for each of the devices, specifying which device and what threshold to use.
Each instance can be activated, deactivated, or use different run modes, independently.
Blocks
Blocks are the basic processing units of the model. Each block has some predefined functionality and processes data accordingly. A block can have a set of parameters and a set of input ports and output ports.
The palette of the model editor offers for selection the following types of blocks:
- Input blocks, which receive data from external sources. An input block normally represents a device that has been registered in the Cumulocity inventory, a group, an asset, or all input sources. See also Input blocks.
- Output blocks, which send data to external sources. An output block normally represents a device that has been registered in the Cumulocity inventory. But there are also blocks for sending an email or SMS to specified receivers. See also Output blocks.
- Processing blocks, which receive data from the input blocks and send the resulting data to the output blocks. See also Processing blocks.
Info
For detailed information on each block, see Overview of all blocks which provides links to the descriptions of all the blocks in the block reference.
A block can receive data from another block through its input ports. A block can send data to another block through its output ports. Different blocks will have different numbers of input or output ports, and some blocks have only input ports or only output ports. For most blocks, it is not required to connect all of the input or output ports.
A block can have configurable parameters that define the behavior of the block. These parameters are either optional or mandatory, depending on the requirement of the block. A parameter can be configured with a value or a template parameter.
When using the same block multiple times, you can specify different values for the same parameter. For example, the Threshold block has a configurable parameter named Threshold Value. If you are using two instances of the Threshold block and configure this parameter differently for each block, the blocks will report different breaches of the threshold.
Info
Two output ports cannot be connected to the same input port, whereas one output port can be connected to multiple input ports.
Input blocks
An input block is a special type of block that receives data from an external source. It converts the data into a format understandable to wires and transfers the data to the connected blocks. For example, when an input block receives a Measurement event from Cumulocity, it extracts the required information from the event and then transfers the information to the connected blocks for further processing.
Models can process data from multiple devices, and scale up (using multiple cores) when doing so. For detailed information, see Model execution for different devices.
Info
By default, the All Inputs option is selected, which means that the input block is listening to all input sources.
In addition, Analytics Builder supports input devices that are referred to as “broadcast devices”. Signals from these devices are available to all models across all devices. For detailed information, see Broadcast devices.
Output blocks
An output block is a special type of block that receives data from a connected processing block. It converts the data into a format understandable to an external source and transfers the data to the external source. For example, when an output block receives data from a connected processing block, it packages the data into an Operation object and then sends the operation to Cumulocity.
You can specify a Trigger Device for an output block. This is a special device which can be used to send the output back to the device which triggered the output. Models can process data from multiple devices, and scale up (using multiple cores) when doing so. For detailed information, see Model execution for different devices.
Info
If you use the default option of All Inputs as the input source for an input block, you must set the output destination of the output block to Trigger Device.
Other output blocks are Send Email and Send SMS to send emails and text messages. These blocks depend on the tenant environment being correctly configured to be able to deliver the emails and text messages, see also SMS provider. Unlike the other blocks, these are not associated with devices within the Cumulocity platform.
Processing blocks
There are different types of processing blocks. They are grouped into different categories in the palette in the model editor, depending on their functionality.
| This category | includes blocks that |
|---|---|
| Logic | perform logical operations on the data. Blocks such as AND and OR are in this category. |
| Calculation | perform mathematical operations on the data. Blocks such as Difference, Threshold, Direction Detection, Delta and Expression are in this category. |
| Aggregate | perform aggregation of the data over a window of values. Blocks such as Average (Mean) and Integral are in this category. |
| Flow Manipulation | manipulate the flow of the data. Blocks such as Time Delay, Gate, Pulse and Latch Values are in this category. |
| Utility | provide miscellaneous utility functions. Blocks such as Toggle and Missing Data are in this category. |
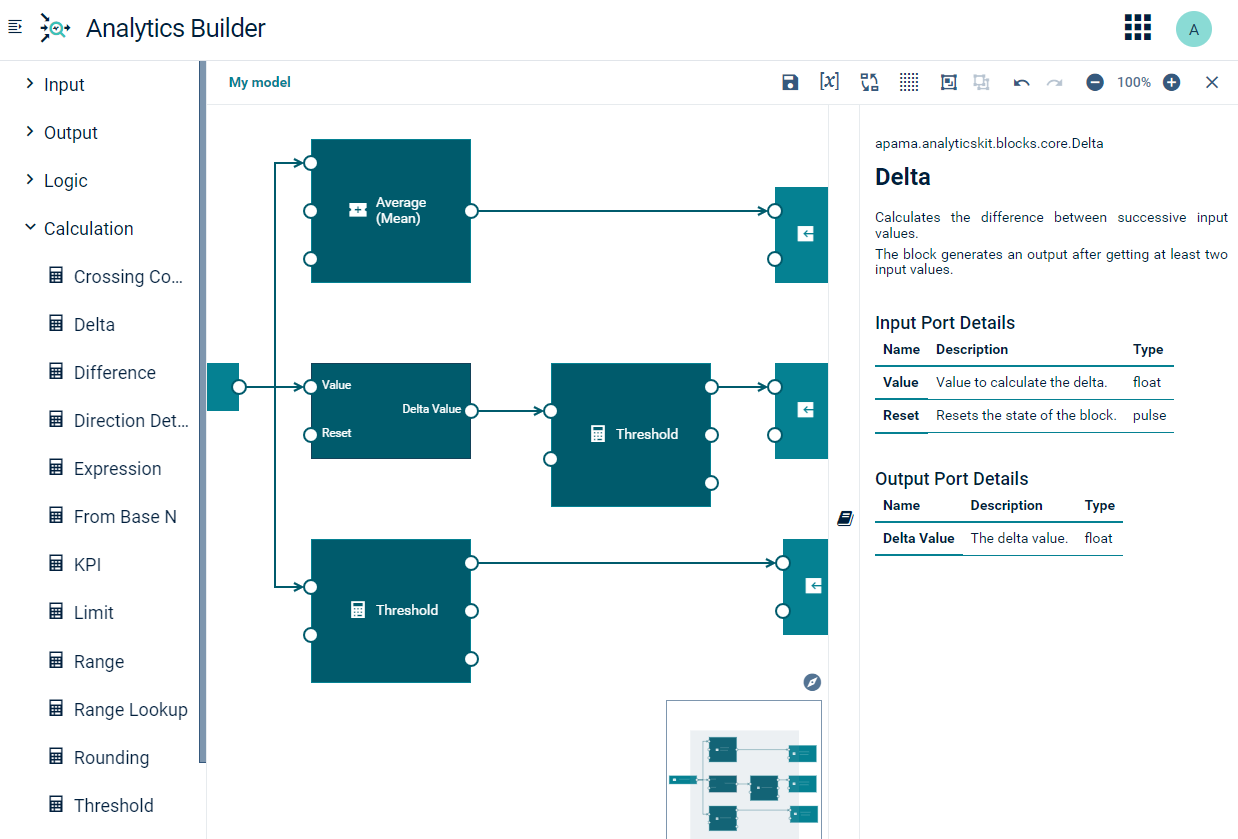
Example of a processing block - the Threshold block
The following example shows what a block looks like in the model editor, together with the block parameter editor. It shows the Threshold block, which detects whether the input value breaches the threshold or whether it crosses the threshold.
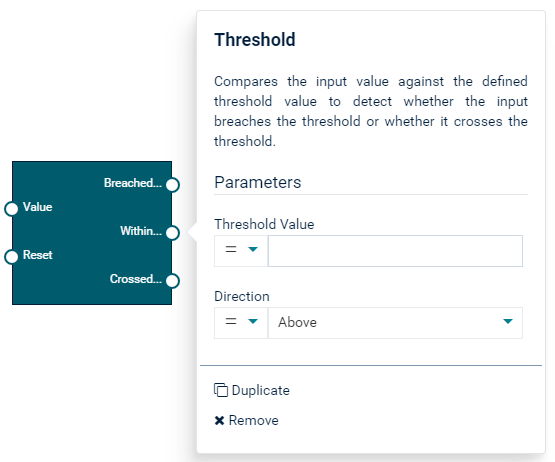
The parameters are:
- Threshold Value.
floattype. This value is compared against the input value. - Direction. The direction in which to look: whether the input value is above or below the defined threshold, or whether it crosses the threshold.
The input ports are:
- Value.
floattype. The input value to the block, to be compared against the defined threshold value. - Reset.
pulsetype. When a signal is received, the state of the block is reset so that any previously received input values are no longer used.
The output ports are:
- Breached Threshold.
booleantype. Is set totruewhen the threshold has been breached. That is, the input value is beyond the range of the defined threshold value. - Within Threshold.
booleantype. Is set totruewhen the threshold has not been breached. That is, the input value is within the range of the defined threshold value. - Crossed Threshold.
pulsetype. Sends a signal when the input value crosses the threshold, going from one side of the threshold to the other.
Creating your own blocks
You can use the Analytics Builder Block SDK to write, test, and package custom blocks and to upload these blocks into Analytics Builder.
The Block SDK is available from GitHub at https://github.com/Cumulocity-IoT/apama-analytics-builder-block-sdk. See the documentation in GitHub for detailed information.
You write the custom blocks in Apama’s Event Processing Language (EPL). Once you have written a block, you can package it into an extension and upload it. An example command line to build and upload an extension is:
analytics_builder build extension --input path --cumulocity_url $C8Y_URL --username $C8Y_USERNAME --password $C8Y_PASSWORD --name customBlocks --restart
To upload an extension, the user specified in the --username argument must have CREATE permission for “Inventory” in Cumulocity, in addition to the permissions listed in Prerequisites.
The Apama-ctrl microservice is restarted after running the above command. The user must have the ADMIN permission for “CEP management” to request a restart.
Info
When using the multi-tenant Apama-ctrl-mt microservice, only extensions uploaded to the tenant that owns the microservice will be used.
Wires
One block is connected to another block with the help of wires. All data transfer between the output port of one block and the input port of another block is done using wires. All connections must be made between compatible types. See Wires and blocks for detailed information.
Info
The network of blocks in a model cannot contain any kind of cycles. See Wire restrictions for more information.
Sample use case
Consider a situation where you are getting real-time sensor data and you want to analyze this data. For the sake of simplicity, let us assume that there is only one sensor and that you are interested in the following:
- You want to know the average value of the sensor readings over a period of time.
- You want to detect sudden changes in the sensor readings using a defined threshold value.
- You want to ensure that the sensor readings are within a certain range and that an alert is created if the readings go beyond that range. For example, you are getting pressure readings and you want to ensure that the maximum pressure does not go beyond the range that the device can handle.
The model for this example has the following blocks:
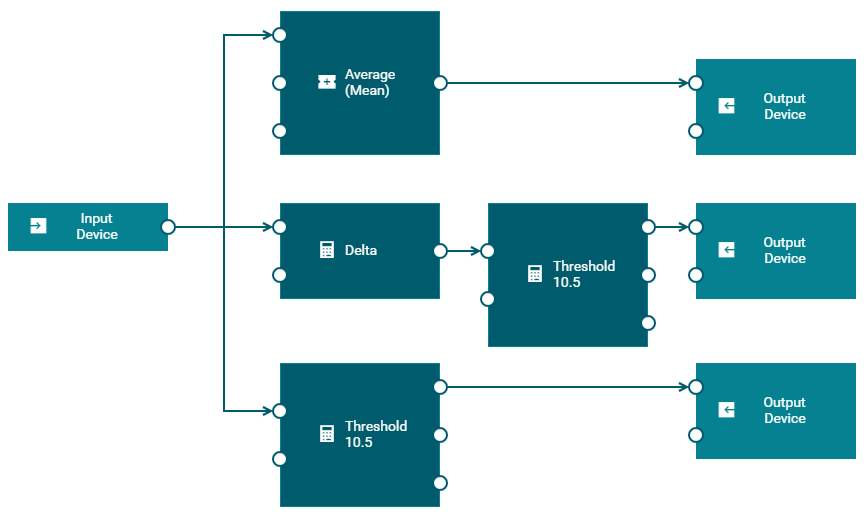
-
The input block shows Input Device as the device name. The incoming data is in real time and continuous. The input block receives the data from the sensor. It passes the data to the Average (Mean), Delta and Threshold blocks. The input ports of these blocks are connected to the output port of the input block.
-
The Average (Mean) block finds the average (or mean) of the readings that it receives over a period of time and passes this to the connected output block.
-
The Delta block calculates the difference between successive input values and passes the calculated value to the connected Threshold block.
-
The model has two different instances of a Threshold block. A Threshold block compares the input value against the defined threshold value to detect whether the input breaches the threshold or not. The first instance is connected to the Delta block and reports a breach if the delta value goes beyond the threshold. The second instance is connected to the input block and reports a breach if the input value is not within the threshold.
-
The model has three instances of an output block which show Output Device as the device name. The first instance sends the average of the sensor reading. The second instance generates an output if the values of successive sensor readings change by more than the configured threshold. The third instance generates an output if the sensor value goes beyond the configured threshold.
Using the model manager
The model manager user interface
The model manager contains two tabs: the Models tab which shows all currently defined models and the Samples tab which shows sample models that are intended to help you get started with creating your own models.
The Models tab
The Models tab lists all available analytic models within the current Cumulocity environment as cards. You add new models and manage the existing models from here.
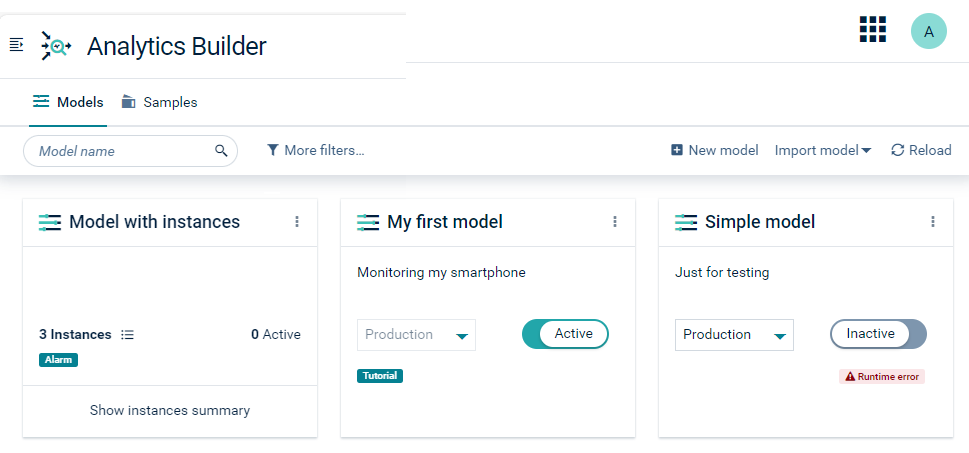
To edit a model, you can simply click on the card that is shown for the model (see also Editing an existing model. When you add a new model or edit an existing model, the model editor is invoked in which you define the blocks and wires that make up a model. See Using the model editor for detailed information.
There are two types of models, and the cards for these models look different:
-
When a card shows a mode (such as Draft or Production) and state (Active or Inactive), it pertains to a model that has no template parameters. Such a model can be activated immediately in the model manager. See Deploying a model for more information.
If a runtime time error icon
 is shown on the card of a deployed model, this model is no longer processing events. Click the runtime error icon to display information on what went wrong.
 -
When a model has template parameters, it acts as a template. In this case, the number of defined and active instances is shown on the card. A template model is not activated directly in the model manager. Instead, you use the instance editor to create a number of instances, where each instance provides values for the template parameters. Each instance has a mode and can be activated and deactivated in the instance editor, as with models without any template parameters.
To edit the instances, you can simply click the total number of instances (see also Editing the instances of a model). This invokes the instance editor. See Using the instance editor for detailed information.
You can flip the card for a template model to show more details. Click Show instances summary to do this. You can then see the number of instances in the different modes.
If an error icon such as
 is shown on the card of a template model, at least one of the instances is no longer processing events. Click the error icon to display information on what went wrong.
As long as a model has no template parameters, there will be zero instances and the card shows the controls for selecting a mode and activating it.
Each card that is shown for a model has an actions menu at the top right which contains commands for managing the model (for example, to download or delete the model).
If a description or tags have been defined for the model, this is shown on the card for that model. If you want to change the name, the description or the tags of a model, you must do this in the model editor. See Changing the name, description, and tags of a model.
If you have a long list of cards, you can easily locate the model that you are looking for by entering its name in the Model name search box. Or you can enter part of the model name. For example, enter the word “test” to find all models that have this word in their names. The characters that you type in may be contained at any position within the model name. These search criteria are not case-sensitive. When search criteria are currently applied, Clear search is shown next to the search box; click this to clear the search and thus to show all available cards.
You can also reduce the number of shown cards by using a filter. See Filtering the models and samples for detailed information.
The Samples tab
The Samples tab lists all sample models that are provided with Analytics Builder as cards.
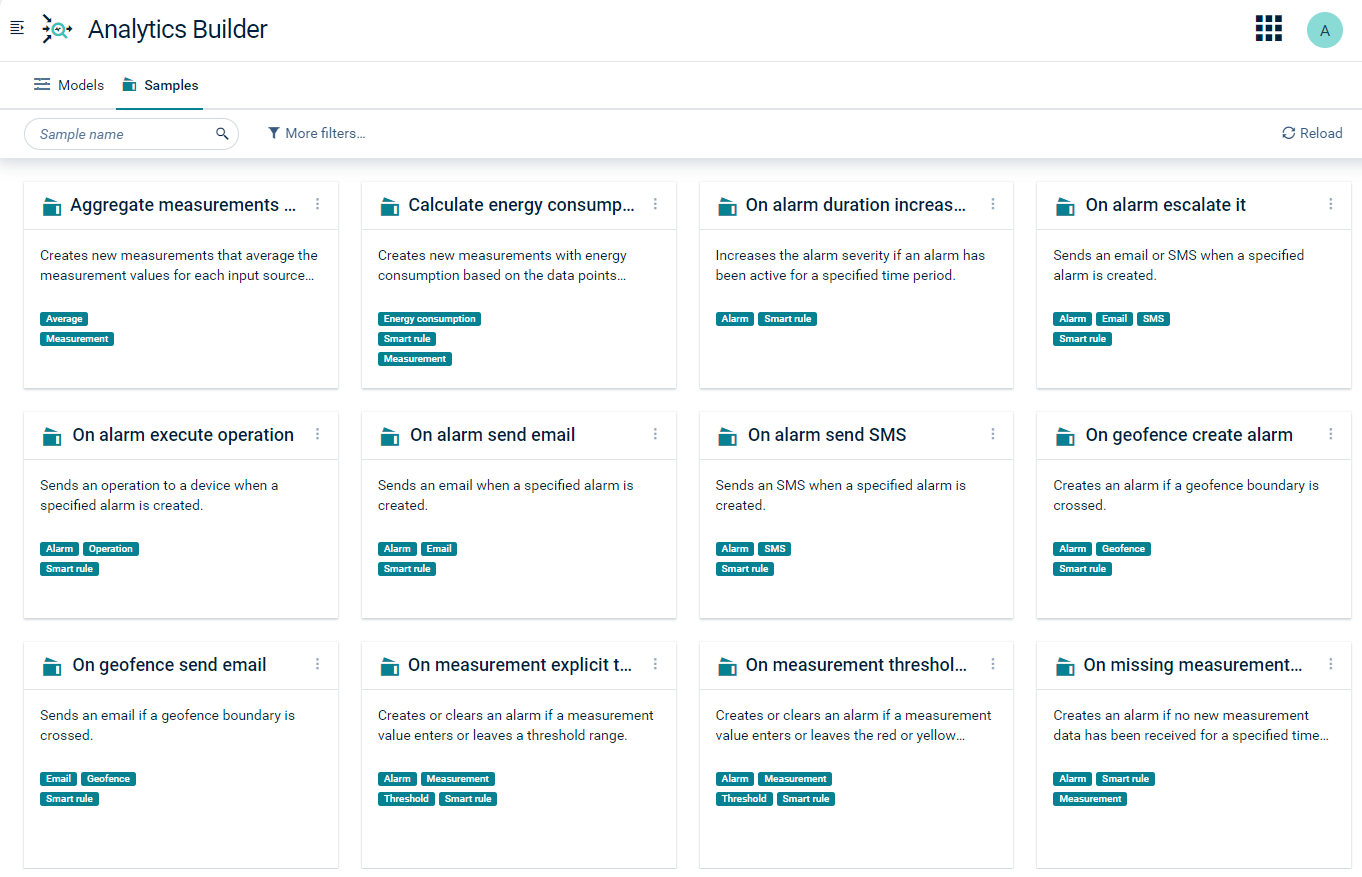
If the name of a sample or its description is not fully shown on the card, you can hover over the name or description to see the full name or description in a tooltip.
You can view the samples, but you cannot edit or deploy them. To view a sample, you can simply click on the card that is shown for the sample. The model editor is then invoked in read-only mode. See Viewing a sample for more information.
If you want to use a sample as a basis for further development, you can create a model from the sample. You can then edit the new model according to your requirements and deploy it. See Creating a model from a sample for more information.
You can easily locate a sample by entering its name or part of the name in the Sample name search box (for example, “geofence” or “email”). You enter and clear the search criteria in the same way as described above for the Model name search box on the Models tab. You can also filter the samples by their tags; see Filtering the models and samples for more information.
Filtering the models and samples
The model manager offers several ways to reduce the number of cards that are shown on the Models and Samples tabs, thus letting you quickly locate the models or samples that you are looking for.
Filtering also works in combination with a model or sample name that you specify in the Model name or Sample name search box which is explained in The model manager user interface.
To filter the models or samples
-
On the Models or Samples tab of the model manager, click More filters in the toolbar.
-
In the resulting dialog, select one or more filters for the models. For samples, it is only possible to filter by tag. On the Models tab, you can filter the models according to the following criteria:
- Mode. You can show only the models that are in a specific mode. For example, if you only want to see the models that are in simulation and test mode, select the corresponding checkboxes.
- Status. You can show only the models that are either active or inactive. For example, if you only want to see active models, select the corresponding checkbox.
- Source or destination. You can show only the models that use specific input sources or output destinations. Open the Filter by source or destination drop-down list box, select one or more items and click Apply.
- Data point.
You can show only the models that use specific data points, such as
c8y_TemperatureMeasurement. This requires that at least one item has been selected in the Filter by source or destination drop-down list box. Open the Filter by data points drop-down list box, select one or more data points, and click Apply. - Tags. You can show only the models for which specific tags have been defined in the Create model dialog box which is shown when you add a new model or when you invoke the Edit model dialog box from the model editor (see also Adding a new model and Changing the name, description, and tags of a model). Open the Filter by tag drop-down list box, select one or more tags, and click Apply.
You can combine several types of filters, for example, to show only active models in production mode that use a specific device.
On the Samples tab, you can filter the samples by tag only. Open the Filter by tag drop-down list box, select one or more tags, and click Apply.
All of the above-mentioned drop-down list boxes include a Filter search box that you can use to reduce the number of items that are offered for selection. You can enter a name or part of a name. For example, enter the word “test” to show only the items that have this word in their names. The characters that you type in may be contained at any position within the name. These filter criteria are not case-sensitive. Clicking the All checkbox selects all items that are currently shown in the drop-down list box, depending on the contents of the Filter search box.
-
Click Apply filters. The toolbar of the Models or Samples tab now shows the filters that are currently applied. This is an example of the Models tab:
 Click Clear filters in the toolbar if you want to clear all filters. Or to clear a specific filter, click the X that is shown in the label for this filter, or click the filter name in the label and deselect that filter (and other filters if required) in the resulting dialog box. Clicking Reset filters in that dialog box clears all filters.
Adding a new model
When you add a new model, the model editor is invoked. See Using the model editor for detailed information.
Info
The new model will only be listed in the model manager, when you save the model in the model editor. See also Saving a model.
You can also create a new model from a sample. See Creating a model from a sample for more information.
To add a new model
-
On the Models tab of the model manager, click New model in the toolbar.
-
In the resulting Create model dialog box, enter a unique model name.
You can optionally enter a description for the model and one or more tags. Tags are helpful for filtering the models in the model manager to show only the models for which a specific tag has been defined (see also Filtering the models and samples). To add a tag, you simply type its name and press Enter or the Tab key. The tag is then shown in a colored rectangle. To remove a tag, click the X that is shown in the rectangle. The dialog prevents you from entering duplicate tags for a model; if you enter such a tag name, the duplicate tag is not added and the original tag blinks one time.
-
Click OK. The model editor appears. See Overview of steps for adding a model for a brief overview of how to add blocks and wires to the new model.
Info
When you click Cancel without specifying a model name, the model editor also appears and the default name “New” is then shown in the breadcrumb.
You can add blocks to the model, but as long as you do not specify a model name, you will not be able to save the model.
Click Model settings and specify a model name. See also Changing the name, description, and tags of a model.
Editing an existing model
You can edit (or view) each model that is currently listed in the model manager.
When a model is active, editing will set the model to read-only mode. In this case, the model editor only allows you to view the contents of the model (for example, you can view the block parameters). You can navigate and zoom the model as usual, but you cannot change anything.
To edit a model
On the Models tab of the model manager, simply click the card that is shown for the model (but not on the toggle button for changing the state or the drop-down menu for changing the mode).
Alternatively, click the actions menu of the card and then click Edit.
When the model is active, a dialog appears informing you that you can only view the model. When you click Continue, the model editor appears and you can view the model, but you cannot change it. See Using the model editor for further information.
Info
If you do not have sufficient permissions (that is, you only have READ permission for “CEP management” instead of ADMIN permission), the actions menu provides a View command instead of the Edit command.
Editing the instances of a model
When one or more blocks in a model use template parameters (see also Managing template parameters), you can set up different instances of that model.
Each instance can then use different values for the template parameters and can be activated independently from the other instances. The instances are defined and activated in the instance editor.
Info
The actions below are only available when template parameters have been defined for the model, that is, when the card for the model shows the number of defined instances.
To edit the instances of a model
On the Models tab of the model manager, click the total number of instances on the front of the card.
Alternatively, you can also do one the following:
- Click the actions menu of the card and then click Instances.
- Or click Show instances summary to flip the card and then click the Edit Instances button on the back of the card.
Info
Show instances summary is only visible (and thus you can only get to the back of the card) if there are any instances (regardless of state).
This invokes the instance editor. See Using the instance editor for further information.
Deploying a model
A model (or instance) can have one of two states. The current state is always indicated on the card that is shown for a model:
- Active. This state indicates that the model has been deployed.
- Inactive. This state indicates that the model is currently not deployed.
The inputs that a model receives and what happens to its outputs depends on the mode to which the model is set. Each model can be set to one of the following modes:
-
Draft. The model is still under development. (New models are created in draft mode.)
-
Test. This mode is only permitted for models using a single device. When active, the model is deployed to the Apama correlator so that the measurements and events from the device are processed. The output of the model is only stored (and recorded as an
OperationorMeasurementobject of a “virtual device”) and not sent back to the device.InfoTest mode is not supported for a model which contains a custom block which consumes input data and also produces output data. Custom blocks are created with the Block SDK; see also Creating your own blocks. -
Simulation. This mode is only permitted for models using a single device. When active, the model uses historical input data (replayed in real time from previously received data) and is deployed to the Apama correlator. The output of the model is only stored (and recorded as an
OperationorMeasurementobject of a “virtual device”) and not sent back to the device. To start a simulation, you must define the time range from which the input data is to be used. When all data from the time range has been replayed, the model is automatically undeployed from Apama and the model state is changed to Inactive. The timestamps of the historical data entries remain unchanged for easier comparison of simulation runs. See also Model simulation. -
Production. When active, the model is deployed to the Apama correlator so that the measurements and events from the devices are processed. The output of the model is stored and sent back to the devices.
A model in draft mode can only be in the inactive state. A model in test, simulation or production mode can be in either the active or inactive state.
Info
The above information on the different states and modes similarly applies for the instances of a template model. The following instruction, however, only applies for non-template models. If you want to deploy the instances of a template model, see Deploying an instance.
When a model is imported by loading a JSON file, it is always imported as an inactive model.
To deploy a model
- On the Models tab of the model manager, click the drop-down menu on the card for the model that you want to deploy and select one of Production, Test or Simulation.
- If you have selected simulation mode, click the calendar icon which is now shown, specify the time span that is to be used, and click Apply. See also Simulation parameters.
- When the toggle button currently shows Inactive, click this button to change the state to Active. For simulation mode, you can only set the state to Active when a valid time range has been defined.
Undeploying a model
You can undeploy (that is, deactivate) each model that is currently in production, test or simulation mode and for which the toggle button shows Active.
When you undeploy a model, the model is stopped and no longer processes incoming data. Any state built up in the model is lost. For simulation mode, this means that the model is stopped before all historical data from the specified time range has been replayed.
Info
If you want to undeploy the instances of a template model, see Undeploying an instance.
To undeploy a model
In the Models tab of the model manager, click the toggle button on the card for the model that you want to undeploy so that Inactive is then shown on the button.
Duplicating a model
You can duplicate each model that is currently listed in the model manager.
The duplicated model gets the same name as the original model followed by the number sign (#) and a number. For example, when the name of the original model is “My Model”, the name of the first duplicate is “My Model #1”. The number in the model name is increased by one with each subsequent duplicate that you create. The duplicated model gets the same description as the original model. It is recommended that you edit the duplicate and give the model a meaningful name and description.
To duplicate a model
On the Models tab of the model manager, click the actions menu of the model that you want to duplicate and then click Duplicate.
A card for the duplicated model is immediately shown in the model manager.
Downloading a model
You can download each model that is currently listed in the model manager. This is helpful, for example, if you want to transfer a model from the current Cumulocity tenant to a different tenant. The model is saved in JSON format.
To download a model
On the Models tab of the model manager, click the actions menu of the model that you want to download and then click Download.
The resulting behavior depends on your browser. The model is usually downloaded to the download location of your browser.
Info
The Download command is also available when the model is active (read-only mode). This allows you to download the model at any time.
Copying a model
Instead of downloading a model, you can also copy the JSON code of the model to the clipboard and then paste it into an editor of your choice.
To copy a model
On the Models tab of the model manager, click the actions menu of the model that you want to copy and then click Copy.
Info
The Copy command is also available when the model is active (read-only mode). This allows you to copy the JSON code at any time.
Uploading a model
You can upload a model that has previously been downloaded in JSON format. This is helpful, for example, if you want to upload a model from a different Cumulocity tenant.
To upload a model
- On the Models tab of the model manager, click Import model in the toolbar, and then click Upload.
- In the resulting dialog box, navigate to the location where the model that you want to upload is stored.
- Select the model and click Open.
A card for the uploaded model is shown in the model manager.
Pasting a model
Instead of uploading a model, you can also paste the JSON code for a model from the clipboard.
To paste a model
On the Models tab of the model manager, click Import model in the toolbar, and then click Paste.
Info
The Paste command is enabled only if the clipboard contains content.
If the clipboard contains valid JSON code for a model, a card for the pasted model is shown in the model manager.
Deleting a model
You can delete each model that is currently listed in the model manager. When you delete a model that is currently deployed, it is first undeployed and then deleted.
To delete a model
- On the Models tab of the model manager, click the actions menu of the model that you want to delete and then click Delete.
- In the resulting dialog box, click Delete to confirm the deletion.
Reloading all models
You can refresh the display to show any changes other users have made since the page loaded, or to see whether deployed models have entered a failed state.
To reload all models
On the Models tab of the model manager, click Reload in the toolbar.
Viewing a sample
The samples are always in read-only mode. You can view the contents of each sample that is currently listed in the model manager.
For example, you can look at the block parameters and view the documentation for each block that is used in the sample. You can navigate and zoom the sample in the same way as a regular model, but you cannot add or edit anything. However, you can create a new model from a sample (see also Creating a model from a sample).
To view a sample
On the Samples tab of the model manager, simply click the card that is shown for the sample.
Alternatively, click the actions menu of the card and then click View.
Creating a model from a sample
You can create a new model from each sample that is currently listed in the model manager. The new model gets the same name, description and tags as the sample.
Info
You must save the new model so that it is listed in the model manager. If a model with that name already exists, you are prompted to save the new model with a different name.
To create a model from a sample
On the Samples tab of the model manager, click the actions menu of the sample from which you want to create a new model and then click Create model from sample.
Alternatively, when the sample is currently shown in the model editor, click Create model from sample in the toolbar.
The new model is immediately shown in the model editor and you can now change each aspect of the model.
Using the model editor
The model editor user interface
The model editor allows you to create analytic models graphically. It is invoked when you add or edit a model in the model manager. See also Adding a new model and Editing an existing model.
Info
The model editor is also invoked when you view a sample. In this case, the model editor is invoked in read-only mode and the palette on the left is not shown. See also Viewing a sample.
The palette on the left contains the blocks that you can add to your model. It has several expandable/collapsible categories for the different types of blocks.
The canvas in the middle is the area in which you “draw” your model. You drag the blocks from the palette onto the canvas, specify the parameters for the blocks, and wire the blocks together. The content of the canvas is aligned to a grid, see also Showing and hiding the grid.
The overview area at bottom right of the canvas shows the entire model. This is helpful if your model is too large to fit on the currently visible area of the canvas. See also Navigating large models.
The documentation pane on the right allows you to view reference information for the currently selected block. See also Viewing the documentation for a block.
Caution
Changes are only saved when you click the save icon .
See also Saving a model. The editor warns you if you attempt to navigate away from the editor and there are unsaved changes. However, you should always ensure that your changes are saved before disconnecting the browser from the network or suspending a laptop.
Working with models
Overview of steps for adding a model
This topic gives a brief overview of how to add and design a new model. For more detailed information, see the topics that are referenced in the steps below.
You add and design a model as follows:
- On the Models tab of the model manager, click New model. Enter a model name in the resulting dialog box. See also Adding a new model.
- In the model editor, drag the required blocks from the palette onto the canvas. See also Adding a block.
- Refer to the block documentation as necessary. See also Viewing the documentation for a block.
- Use the block parameter editor to specify the parameters of the block. See also Editing the parameters of a block.
- Connect the appropriate blocks with wires. See also Adding a wire between two blocks.
- Save your changes. See also Saving a model.
InfoOnly saved models are listed in the model manager. When you add a new model and then leave the model editor without saving the model, it will not be listed in the model manager, and all the edits you made will be lost.
- Leave the model editor. This takes you back to the model manager. See also Leaving the model editor.
- A newly added model is automatically set to draft mode in the model manager. If you want to test it, simulate it, or make it available in production, see Deploying a model.
For detailed background information, including restrictions, see Wires and blocks.
Changing the name, description, and tags of a model
You can rename each model that you are currently editing in the model editor, and you can also change the description of each model.
You can also add or remove tags. Tags are helpful in the model manager, to show only the models for which a specific tag has been defined, see also Filtering the models and samples.
To change the name, description, and tags of a model
-
In the model editor, click Model settings which is shown at the left of the toolbar.
-
In the resulting Edit model dialog box, specify a new unique name for the model, change the description, and/or change the tags.
To add a tag, you can either:
- Type its name and press Enter. The tag is then shown in a colored rectangle.
- Type its name and submit the dialog without pressing Enter. Any pending text in the Tags field will automatically be added as a tag before submission.
To remove a tag, click on the delete icon (X) that is shown in the rectangle.
The dialog prevents you from entering duplicate tags for a model. If you enter such a tag name, the duplicate tag is not added, and the original tag blinks once.
-
Click OK.
Saving a model
When you save a model in the model editor, it is stored in the Cumulocity inventory for your tenant, in JSON format.
Important
It may happen that you and another user are editing the same model at the same time. In this case, the changes that are saved last will be stored. So your changes might be overwritten by a later save by another user.
To save a model
In the toolbar of the model editor, click the save icon .
The save icon is only enabled when changes have been applied to the model and the model has been given a name.
Leaving the model editor
When you leave the model editor as described below, you are returned to the model manager. You can then, for example, edit a different model, or change the mode or state of the current model.
Caution
All unsaved changes are lost when you navigate to a different URL or close the browser window.
To leave the model editor
In the toolbar of the model editor, click the close icon .
In case there are still unsaved changes, you are asked whether to save or discard them.
Working with blocks and wires
Adding a block
The blocks in the palette are grouped into different categories. When you move the mouse pointer over a block in the palette, a tooltip appears which briefly explains the purpose of the block. The tooltip also shows the entire name of the block.
Detailed information for each block is available in the block reference, which is shown in the documentation pane. See also Viewing the documentation for a block.
To add a block
-
In the palette of the model editor, expand the category which contains the block that you want to add.
-
Drag the block from the palette and drop it on the canvas.
When you drop the block on an existing block on the canvas, the new block is created on top of that block. When you drop the block on a collapsed group, the new block is created below that group. In both cases, you should move the new block to a free space of the canvas. See also Moving a block.
When you drop the block on an expanded group (where the contents of the group are visible), the new block is added to that group. For more information on groups, see Working with groups.
-
Specify all required parameters for the block. See Editing the parameters of a block.
InfoThe block parameter editor is automatically shown when you add a block for which parameters must be specified. It is not shown, however, if the block does not require any parameters (such as the OR block).
Editing the parameters of a block
Most blocks (but not all) have parameters that you must set according to your requirements.
When “Missing” is shown on an input or output block on the canvas, this means that the defined input source or output destination cannot be found in the Cumulocity inventory. You should then either go to the Cumulocity inventory and make sure that the device is registered or that the group or asset exists, or you should select a different, existing input source or output destination in the block parameter editor (see below).
The labels of some blocks on the canvas show the value of the most important parameter. For example, the Expression block shows the defined expression, and the Time Delay block shows the defined delay in seconds.
The block parameter editor also contains commands for duplicating and removing the currently selected block. See Duplicating a block and Removing a block or wire for detailed information.
For the input and output blocks, you can globally replace the input sources and output destinations that are used. See Replacing sources or destinations for detailed information.
To edit the parameters of a block
-
On the canvas of the model editor, click the block that you want to edit using the left mouse button. The block parameter editor appears, providing input fields for all parameters that can be specified for that block.
-
For the input and output blocks, you can select a different input source or output destination from a dialog box.
The tree in the dialog box reflects the parent/child hierarchy in the Cumulocity inventory. For example, the list of devices includes any defined child devices, and the list of groups includes any defined sub-groups. These are available from expandable/collapsible nodes. By default, 10 items are shown within each node, sorted alphabetically. With a large inventory, you will have to click Load more to display any items that are not shown initially.
Using the checkboxes at the top of the dialog, you can filter the entries that are to be shown. By default, all defined devices, groups and assets are displayed in the dialog. If you also want to display any other managed objects in the dialog, select the “Other” checkbox.
The search box can be used to show any managed objects in the Cumulocity inventory which match your search and filter criteria. The search is case-sensitive. The characters that you type in may be contained at any position within the name. The tree is updated with each character that you type. With a large search result, you will have to click Load more to display any managed objects that are initially not shown.
The managed objects that are shown when searching depend on a tenant option. You can restrict the search to show only managed objects of a specific type. For more information, see Searching for devices, groups and/or assets.
Click the button which is shown when you hover over an entry to select the input source or output destination that you want to use. The name of that button depends on the entry that is currently selected:
Button name Shown for Description Select All Inputs option for input blocks Data is received from all input sources. Select Trigger Device option for output blocks Output is sent to the device which triggered the output. Select device Devices in input and output blocks Data is received from the device or output is sent to the device. Select group’s devices Groups in input blocks Data is received from all devices within the group hierarchy. You cannot directly receive data from a group. Select asset Assets in input and output blocks Data is received from the asset itself or output is sent to the asset itself. The devices of the assets are ignored. Select asset’s devices Assets in input blocks Data is received from all devices within the asset hierarchy. The block does not receive data from the asset itself. InfoFor output blocks, you cannot select a group. A button is not provided in this case. Select the Trigger Device option instead to send the output to the device which triggered the output.The maximum number of shown input sources and output destinations depends on a tenant option. For more information, see Configuring the number of shown input sources and output destinations.
-
It is possible to use a template parameter instead of specifying a value for a block parameter. This allows different values to be used for this block parameter in different instances of the model (see Using the instance editor for more information). Create a template parameter of a matching type in the Template Parameters dialog box (see Managing template parameters), switch the block parameter to use a template parameter (see below) and select the desired template parameter from the drop-down list box. Or create the template parameter directly in the block parameter editor (see below).
The block parameter editor provides the following options in a drop-down list box:
-
 When selected, you can specify a value for this parameter using the adjacent control. This value is validated in the block parameter editor.
 -
 When selected, you can select a template parameter from the adjacent drop-down list box. You can only select a template parameter that is of the same type as the block parameter to which you want to assign it; template parameters of unsuitable types are not available for selection. Template parameters are not validated in the block parameter editor.
If you want to add a new template parameter directly in the block parameter editor, type a name in the text box of the above drop-down list box. As soon as you start typing and if a template parameter with that name does not yet exist, the option Add template parameter name is shown below the text box. Click this option to add the new template parameter and thus make it available in the Template Parameters dialog box. The new template parameter will have the same type, optional and default values as the block parameter. If a template parameter with the name that you are specifying exists already, but with an incompatible type, the name and type is shown below the text box but cannot be selected.
-
-
Some blocks support multi-line input for certain block parameters. For example, the Send Email block supports this in the Text parameter and the Alarm Output block supports this in the Message parameter. Your input is automatically wrapped in the text box and you can press Enter to start text on a new line. When you add a new template parameter for such block parameter directly in the block parameter editor (as described above), the type of the new template parameter is automatically set to Multi-line String.
-
For some blocks (such as the Range Lookup block), the block parameter editor shows text boxes for specifying key-value pairs. If you want to specify more key-value pairs, click Add row. The key-value pair in the first row is processed first. You can drag a row to a different position using the move icon that is shown next to that row. You can delete a row that you do not need any more by clicking the delete icon next to that row. Empty rows are automatically deleted when you leave the block parameter editor.
-
Specify all required parameters. Detailed reference information for each block is available from the documentation pane. See also Viewing the documentation for a block.
Your input is kept in memory when you leave the block parameter editor (for example, when you click on another block or the canvas).
InfoKeep in mind that your changes are only written to the inventory when you save the model. See also Saving a model.
Viewing the documentation for a block
The documentation pane allows you to view detailed information for the currently selected block. It shows the so-called block reference which provides documentation of a block’s parameters, input ports and output ports. You can resize the documentation pane, and you can also toggle its display.
Info
You can also view the block reference directly in this documentation. See Analytics Builder block reference.
To view the documentation for a block
- In the model editor, click the block for which you want to view the documentation. You can do this in the palette or on the canvas.
- If the documentation pane is currently not shown, click the area that contains the document icon (shown at the right of the canvas) to display the documentation pane. Clicking that area again hides the documentation pane.
- If you want to resize the documentation pane (for example, to make it larger), move the mouse pointer over the area that contains the document icon. Click and hold down the mouse button and drag the mouse to the left or right (to make the documentation pane wider or smaller).
Selecting blocks and wires
If you want to move, duplicate or remove one or more blocks that are currently shown on the canvas of the model editor, you must first select the required blocks.
To select a single block on the canvas, just click the block. With a block, the resulting behavior depends on the mouse button that you use:
- When you click the block using the left mouse button, the block is selected and the block parameter editor is shown (see also Editing the parameters of a block).
- When you click the block using the right mouse button, the block is selected only (the block parameter editor is not shown). This is helpful if the editor would be in the way, for example, when adding a wire to another block.
To select a single wire, just click the wire (you can use either mouse button in this case).
To select several blocks and/or wires at the same time, do one of the following:
- Press Ctrl and click each block and/or wire that you want to select.
- Or to select an area containing several blocks and wires, click and hold down the mouse button over an empty space of the canvas and wait until the mouse pointer changes to a cross. Then drag the mouse to select the desired area. Release the mouse button when all required blocks and wires have been selected.
- Or to select all blocks and wires, press Ctrl+A.
To deselect your selection:
- Press Ctrl and click the currently selected block or wire.
- Or to deselect all selections, click an empty space of the canvas.
Moving a block
You can move each block that is currently shown on the canvas to different location. When one or more wires are attached to a block that is moved, the wires are also moved.
To move a block
On the canvas of the model editor, click the block that you want to move, hold down the mouse button and drag the block to the new location.
Alternatively, to move several blocks at the same time, select them as described in Selecting blocks and wires. Then click and hold down the mouse button and immediately drag the blocks to the new location (do not wait until the mouse pointer changes).
Duplicating a block
You can duplicate each block that is currently shown on the canvas. The original block and its duplicate will then both have the same parameters.
When you duplicate a single block, the attached wires are not automatically duplicated. When you duplicate several blocks at the same time, however, the attached wires between the selected blocks are automatically duplicated.
To duplicate a block
- On the canvas of the model editor, click the block that you want to duplicate and then do one of the following:
- Click the Duplicate command which is shown at the bottom of the block parameter editor.
- Or press Ctrl+C to copy the block, and then press Ctrl+V to paste the block.
- Or press Ctrl and drag the block to be duplicated to the position at which you want to place the duplicate.
- Or to duplicate several blocks at the same time, select them as described in Selecting blocks and wires and then proceed as described above. Exception: the Duplicate command is only available when you select a single block.
Adding a wire between two blocks
The blocks on the canvas can be wired together to indicate that the output from one block is used as the input for the other block.
The wires are attached to ports, that is, to the circles that are shown to the left and/or right of a block. Each block can have zero, one or more of the following:
- output ports (shown at the right side of a block)
- input ports (shown at the left side of a block)
To see the names of the ports, click the block to select it. Or move the mouse pointer over a port to see the port name in a tooltip (the name is displayed first, followed by the description of the port).
See Wires and blocks for detailed information on the types of values that can be sent between two blocks, the processing order of wires, restrictions, and more.
To add a wire between two blocks
On the canvas of the model editor, click the output port of the block that you want to connect and drag the mouse to the input port of another block.
Changing a wire
You can change the path that a wire takes to the block to which it is currently connected. And you can also rewire a block so that it is connected to a different block or to a different port of the same block.
Wires cannot create cycles. See Wire restrictions for detailed information.
To change a wire
-
On the canvas of the model editor, click the wire that you want to change. The port names of the attached blocks are then shown, and the ports attached to each end of the wire are highlighted.
-
To change the path that a wire takes between two blocks, drag one of the square resize icons (
 ) that are now shown on the selected wire to a different position.
Or to move the wire to a different port, drag the diamond-shaped move icon (
) that are now shown on the selected wire to a different position.
Or to move the wire to a different port, drag the diamond-shaped move icon ( ) that is now shown at the input or output port (a hand pointer is shown in this case) to a different port.
Removing a block or wire
You can remove each block or wire that is currently shown on the canvas. When you remove a block, all wires that are attached to this block are automatically removed.
To remove a block or wire
-
On the canvas of the model editor, click the block or wire that you want to remove and press Del. In the case of a block, you can alternatively click the Remove command which is shown at the bottom of the block parameter editor.
-
Or to remove several blocks and/or wires at the same time, select them as described in Selecting blocks and wires and then press Del.
Undoing and redoing an operation
You can undo and redo each change that has been applied to the canvas. For example, you can undo the removal of blocks, undo changed parameter values, or undo the rerouting of a wire.
It is not possible to undo/redo the change to a model name or its description.
Info
To use the key combinations mentioned below, the canvas must have the focus. When the documentation pane or the palette currently has the focus, the change on the canvas is not undone/redone.
To undo or redo an operation
-
To undo the last operation, click the undo icon in the toolbar of the model editor or press Ctrl+Z.
-
To redo the last operation, click the redo icon in the toolbar of the model editor or press Ctrl+Y.
The above icons are only enabled when there is an operation that can be undone or redone.
Replacing sources or destinations
You can find the input sources or output destinations that are used in the current model and replace them with other input sources or output destinations that are currently registered in the Cumulocity inventory (visualized in the Device Management application).
Info
In the rules below, the term device refers to a device or other asset (but not to a group).
The following rules apply:
- You can replace a device with another device.
- You can replace a group with another group.
- You can replace a group or a device with the All Inputs option.
- You can replace the All Inputs option with a group or a device.
- When you replace a device with a group or the All Inputs option:
- all matching input devices are changed to groups or All Inputs, whichever is selected, and
- all matching output devices are changed to trigger devices.
- When you replace a group or the All Inputs option with a device:
- the group or All Inputs, whichever is selected, is changed to a device, and
- all matching trigger devices are changed to the specified device.
InfoIf you change more than one group to a device at a time, then only the first specified device will be used to replace all trigger devices.
- The Trigger Device option is not available for selection in the dialog.
After you have replaced the devices, you must verify that the measurements that are used by the input and output blocks of the current model still refer to the appropriate measurements. The Cumulocity fragment and series are not changed by the replacement, which may or may not apply to the newly defined device.
To replace sources or destinations
-
In the toolbar of the model editor, click the replace icon . This icon is only enabled when at least one source or destination has been defined in the current model. Any defined trigger devices are not considered in this case.
-
In the Current drop-down list box of the resulting dialog box, select the source or destination that you want to replace. All input sources and output destinations that are used in the model are available for selection.
-
Click the Replace with box to display a dialog box. The dialog box is the same as when selecting a input source or output destination in the block parameter editor. See Editing the parameters of a block for more information on this dialog box. Click the button which is shown when you hover over an entry to select the source or destination that you want to use instead.
-
If you want to replace further sources or destinations, click Add row. This is only shown if more than one source or destination has been defined in the current model.
A new row is shown, containing additional Current and Replace with drop-down list boxes, and you can now select one more source or destination to be replaced. Any sources or destinations that you have previously selected for replacement are no longer offered for selection in the Current drop-down list box.
Repeat this step until all required sources and destinations have been selected for replacement. You can add as many rows as there are sources or destinations in the current model.
-
If you want to delete a row (for example, when you no longer want to replace a selected device), click the delete icon next to that row. This is only available if the dialog box currently shows more than one row.
-
Click Replace.
Managing template parameters
A model may specify zero or more template parameters, which can be used in place of defined values for block parameters. For example, instead of defining 100 as the threshold value for a Threshold block in the block parameter editor, you can assign a template parameter.
If a model has any template parameters, then multiple instances of the model can be created, and different values can be specified for the template parameters. See also Understanding models which explains the difference between models without template parameters and models with template parameters, and the different roles: model author and instance maintainer.
If you want to use template parameters, you must first define them in the Template Parameters dialog box as described below. After you defined a template parameter, you can assign it to specific parameters of the same type in the block parameter editor (see also Editing the parameters of a block).
Info
It is also possible to define template parameters directly in the block parameter editor.
Models with no template parameters can be directly activated in the model manager, with a single instance of the model running. This is different when you save the model after you have assigned at least one template parameter to one or more block parameters, you can no longer activate the model directly in the model manager. Instead, you must create at least one instance of the model, and you then activate that instance using the instance editor. See Using the instance editor for detailed information.
To define the template parameters for the instances of the current model
-
In the toolbar of the model editor, click the template parameters icon to invoke the Template Parameters dialog box. When at least one template parameter has been defined, a checkmark is shown on the above icon: .
This dialog box is initially empty and you must create the template parameters that you want to use in your model. When template parameters have already been defined, they are all shown in this dialog box.
If you have a long list of template parameters, you can easily locate the template parameter that you are looking for by entering its name or part of the name in the search box. When search criteria are currently applied, an X is shown in the search box; click this to clear the search and thus to show all available template parameters.
After a template parameter has been assigned to one or more block parameters, the Usage Count column indicates the number of places in which the template parameter is used. For example, when a template parameter is used in two places, this means that it has been assigned to two block parameters. These can be within the same block or in different blocks.
-
To create a template parameter, click Create new template parameter. This adds an empty row at the bottom of the dialog box. You can click Create new template parameter several times to add several empty rows that you can fill one after the other.
-
Specify the following information for each template parameter:
-
Name. Type a unique name to identify the template parameter within the current model. This name can later be selected in the block parameter editor.
-
Type. Select the value type of the template parameter from the drop-down list box. The type can be, for example, a string or float, a source or destination, or the parameter of a specific block.
Multi-line String is a special type which is used, for example, with the Text parameter of the Send Email block. Long input is automatically wrapped in the Default Value text box and you can press Enter to start text on a new line.
An input block specifies a device or a range of devices, while an output block specifies a device, a trigger device or an asset. For template parameters, the same template parameter and thus value can be used for both input and output blocks. If a template parameter is set to refer to a range of devices, then using it in an output block will be treated as the trigger device. Typically, a single template parameter would be used for all input and output blocks, and may be a single device or a range of devices, in which case the block output goes to the device within the range that triggered a model evaluation (so a model calculating an average of a measurement and outputting to a measurement would generate a new measurement for each device independently). Even if a different template parameter whose value refers to a different range was used, the model output would only be sent to the device that triggered a model’s evaluation.
-
Source or Destination Type. You can select one or more of the following “Source or Destination” types from the Restrict to dropdown: “Device”, “Groups”, “Assets”, or “Other”. This selection restricts the template parameter to the selected types. This restriction is mandatory when “From Context” is selected from the Value Selection dropdown.
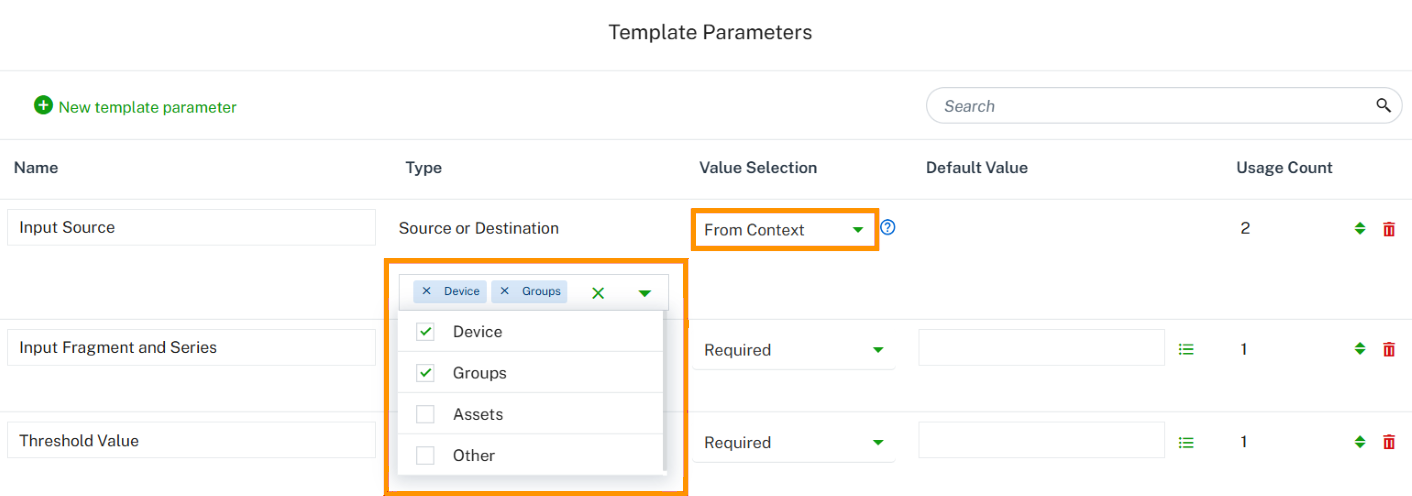
-
Value Selection - Select one of the following options from the dropdown:
- Required - Default. Instance deployment requires a value for this template parameter.
- Optional - The template parameter can remain blank or can be set later by the instance maintainer. When you select this option, it is not possible to specify a default value.
- From Context - Applicable only for “Source or Destination” type. The input will be automatically selected based on the context where the instance is created. Example: Device context or group context.
InfoOnly one template parameter per model can have a “From Context” value selection.
-
Default Value. You can only specify a default value when the Value Selection option is set to “Required”.
Exception: Boolean types always have a value and cannot be optional. They are “false” by default (that is, the checkbox for the default value is not selected).
If you specify a default value, this default value will be provided in the instance editor when the instance maintainer creates a new instance. The instance maintainer can then either leave this default value unmodified or change it as required for that instance.
When setting the default value for a source or destination, an additional dialog box appears when you click the Default Value field. The dialog box is the same as when selecting a different input source or output destination in the block parameter editor (see Editing the parameters of a block for more information on this dialog box). Click the button which is shown when you hover over an entry to select the source or destination that you want to use.
You can also define your own selection lists for specific types of template parameters. See Adding a selection list for a template parameter for detailed information.
InfoIf there is a block parameter for which a required value has not been specified, then the instance cannot be activated. Attempting to do so will report an error. -
-
You can update a template parameter at any time. This includes the name, whether it is optional or not, and the default value. All blocks in which the updated template parameter is defined are automatically adapted to use the new values. The only exception is the type. You can only change the type if the template parameter is not used in any block of the model.
-
When the model is inactive, you can reorder the template parameters. This affects the sequence in which they are shown in the instance editor. Drag a row to a different position using the move icon which is shown next to the row. See also Filtering and sorting the instances.
-
You can only delete a template parameter if it is not used in any block of the model. To delete a template parameter, click the delete icon which is shown next to the row.
-
Click OK to store the changes in memory and to close the dialog box.
InfoKeep in mind that your changes are only written to the inventory when you save the model. See also Saving a model.
Adding a selection list for a template parameter
Several types that you can select in the Template Parameters dialog box (see Managing template parameters) allow you to select a predefined value. An example of such a type is the Direction parameter of the Crossing Counter block which offers predefined values such as Upwards and Downwards for selection. In addition to the predefined values, you can also add your own selection lists for types such as string, float, source or destination, or geofence, and you can also select a specific value to be the default value. The values that you define for a selection list are then available for selection when you create instances of the model.
When it is possible to add a selection list, a selection list icon is shown in the Template Parameters dialog box, next to the text box in which you can add a default value. When a selection list is already available, a drop-down arrow is shown instead of the above icon.
To add a selection list for a template parameter
-
In the Template Parameters dialog box, click the selection list icon in the Default Value column for a defined template parameter.
-
In the resulting Selection List dialog box, click Add selection.
-
Specify a unique name and a value for the new selection. The value that you can specify depends on the type of the currently selected template parameter. For example, if float is selected as the type, you can only specify a float value. Or if Source or Destination is selected as the type, you can select an input source or output destination from a dialog box.
-
Add at least one more selection, that is, click Add selection once more and specify a unique name and a value for the new selection.
-
Repeat the above step until all required selections have been added.
-
To reorder the selection list, drag a row to a different position using the move icon which is shown next to the row.
-
To delete a selection, click the delete icon which is shown next to the row.
-
Click OK to save the selection list and to close the Selection List dialog box. In the Template Parameters dialog box, you can now select one of your selections as the default value from a drop-down list box.
-
To clear the selected default value in the Template Parameters dialog box, click the clear icon that is shown next to the selection.
-
To edit your selection list, click the actions menu in the Default Value column of the Template Parameters dialog box and then click Edit. The Selection List dialog box is then shown.
-
To permanently delete your selection list, click the actions menu in the Default Value column of the Template Parameters dialog box and then click Delete. In the resulting dialog box, click OK.
Copying items to a different model
You can copy any items on the canvas (blocks, groups, and attached wires) and paste them in a different model. The prerequisite for this is that all is done in the same session. It will not work if you try to paste the items in a different tab or in a different browser.
Caution
There may be performance issues if you copy many input blocks and output blocks. This is because this operation requires access to the inventory service of Cumulocity to get the information about the devices that are represented by these blocks.
To copy items to a different model
-
On the canvas of the model editor, select all items that you want to copy and press Ctrl+C. This also works if the model is currently in read-only mode.
-
Leave the model editor. See also Leaving the model editor.
-
In the model manager, switch to the model into which you want to paste the copied items. This can be an existing model (see also Editing an existing model) or a new model that you must first create (see also Adding a new model).
-
When the model editor is shown, press Ctrl+V to paste the copied items into the model.
Working with groups
What is a group
You can arrange blocks and their attached wires in a group. A group is a special type of block which can be collapsed and expanded. When a group is expanded, you can change its contents in the same way as you would on the canvas, for example, you can add wires or edit the block parameters. You can also add more blocks to the group or remove blocks from the group. When a group is collapsed, it occupies less space on the canvas, however, the blocks and wiring within the group are not visible in this case.
Groups are helpful if commonly required functionality needs to be made available in multiple places. You can give each group a name by which it can be identified. You can copy a group and paste it in either the same model or in a different model.
Info
Do not confuse this type of group with a group (or range) of devices. Input sources may sometimes be a group of devices, which is different. See also Editing the parameters of a block.
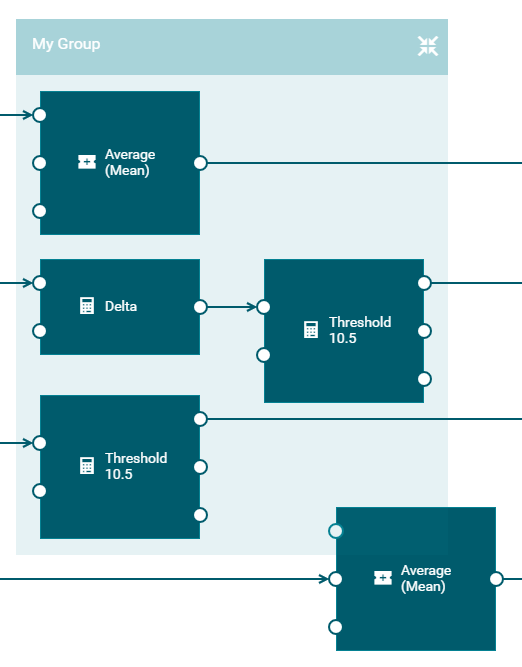
The size of the box that is shown for a group is determined by its contents. If you move a block within the group to a different position, the box size is automatically adapted (that is, the box is made larger or smaller). The same applies if you change the path that a wire takes to another block within the same group.
You move a group on the canvas in the same way as you move a block (see also Moving a block). When you move a group, the group is always shown on top of all other items on the canvas. As the group box is transparent, you can easily see which blocks belong to the group and which are just overlayed by the box.
It is not possible to nest groups.
Info
There is one exception when managing the contents of a group: When you duplicate one or more blocks that are contained in a group using Ctrl+C and Ctrl+V or if you use the Duplicate command in the block parameter editor, the duplicate is not added to the group. It is added to the canvas instead. However, when you press Ctrl and then drag the blocks to be duplicated, you can place the duplicate either within the group (this can be the same or a different group) or on the canvas. See also Duplicating a block.
Adding a group
You can add any blocks that are currently shown on the canvas (including the wires between the blocks) to a group.
It is not possible to create an empty group. You must first add a group as described below. Once the group exists, you can add more blocks to the group, either from the palette or from the canvas, as described in Adding a block and Moving blocks into a group.
To add a group
-
On the canvas of the model editor, select one or more blocks that you want to add to a group. You need not select wires; all existing wires are retained. See also Selecting blocks and wires.
-
In the toolbar of the model editor, click the group icon . Or press Ctrl+G.
Collapsing and expanding a group
If you need more space on the canvas and do not need the group contents to be visible, you can collapse the group.
When a group is collapsed, a number is shown on the collapsed group indicating the number of blocks in that group. For example:
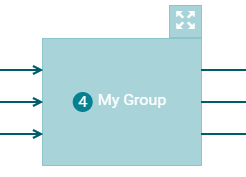
If you want to make the group contents visible again (for example, to edit block parameters or to add wires), you must expand the group.
When you save the model, the state of each group (that is, whether it is currently collapsed or expanded) is stored. The next time you edit the model, its contents will be shown as after the last save.
To collapse or expand a group
-
To collapse a group, click the collapse icon which is shown next to the group name.
-
To expand a group, click the expand icon which is shown above the top right of the collapsed group.
Renaming a group
When you add a group, its default name is “Group”. You can rename each group and give it a unique name.
If a group name is longer than can be shown in the group label, move the mouse pointer over the group name to view the entire name in a tooltip.
It is not possible to have groups without names. If you delete a group name, the previous name is automatically used again.
To rename a group
-
In the model editor, select the group and then click on the group name. You can either do this when the group is collapsed or expanded (see also Collapsing and expanding a group). This selects the entire name for editing.
-
Specify a new group name and press Enter.
Moving blocks into a group
You can move one or more blocks from the canvas into an existing group. All existing wires are retained.
You can also drag a block from the palette into an existing group. See Adding a block.
You can only move/drag blocks into a group when its contents are visible, that is, when the group is currently expanded. See also Collapsing and expanding a group.
To move blocks into a group
- Make sure that the group into which you want to move the blocks is not collapsed.
- On the canvas of the model editor, select the blocks that you want to move into the group (see also Selecting blocks and wires). You need not select the wires between the blocks; they are automatically moved together with the blocks.
- Do one of the following:
- Drag the selection into the group and drop it there.
- Or select the group into which you want to move the blocks. Then click the group icon in the toolbar of the model editor, or press Ctrl+G.
Moving blocks from a group to the canvas
You can move a block from a group to the canvas. All existing wires are retained.
When the last item of a group has been moved to the canvas, the group is automatically removed. If you want to move all items to the canvas at the same time, you can simply ungroup the entire group. See Ungrouping a group.
To move blocks from a group to the canvas
- To move one or more blocks at the same time:
- In the expanded group, select the blocks that you want to move.
- In the toolbar of the model editor, click the ungroup icon . Or press Ctrl+Shift+G.
- Or to move a single block:
- In the expanded group, select the block that you want to move.
- Click the Ungroup command which is then shown at the bottom of the block parameter editor.
Removing blocks and wires from a group
You remove blocks wires from a group in the same way as removing them directly on the canvas. The only prerequisite is that the group is currently expanded. See Removing a block or wire.
If the last item in a group is removed, the group is automatically removed.
Duplicating a group
You can duplicate each group that is currently shown on the canvas. The original group and its duplicate will then both have the same contents.
Wires coming in from blocks outside of the group or going from the group to blocks outside of the group are not duplicated.
You can also copy a group into a different model, see Copying items to a different model.
To duplicate a group
On the canvas of the model editor, click the group that you want to duplicate (it does not matter whether the group is currently collapsed or expanded) and then do one of the following:
- Press Ctrl+C to copy the group, and then press Ctrl+V to paste the group.
- Or press Ctrl and drag the group to be duplicated to the position at which you want to place the duplicate.
Ungrouping a group
When you ungroup a group, the group is removed and all the blocks from that group are shown directly on the canvas. All attached wires are retained.
You can ungroup several groups at the same time. In this case, it is important that no block or wire is selected either within or without the selected groups, otherwise ungrouping is not possible.
To ungroup a group
-
On the canvas of the model editor, select one or more groups that you want to ungroup. It does not matter whether a group is currently collapsed or expanded.
-
In the toolbar of the model editor, click the ungroup icon . Or press Ctrl+Shift+G.
Removing a group
You can remove each group that is currently shown on the canvas. Wires to blocks outside of the group are removed.
Caution
When you remove a group, all blocks and wires within this group are removed from the model.
To remove a group
On the canvas of the model editor, click the group that you want to remove (it does not matter whether it is currently collapsed or expanded) and press Del.
Managing the canvas
Navigating large models
If your model is too large to fit onto the visible part of the canvas, you can use the mouse to drag the parts of the model into view that are currently outside of the window. You can do this either directly on the canvas or in the overview area. The overview area always shows the entire model. If the overview area is currently not shown, see Showing and hiding the overview.
To navigate in a large model
-
In the model editor, position the mouse over a free spot of the canvas (which does not contain a block or wire) or anywhere over the overview area.
-
Click and hold down the mouse button, and immediately drag the mouse into the desired direction. Release the mouse button when the required area is visible on the canvas.
InfoWhen you hold down the mouse button for a longer time over a free spot of the canvas, the mouse pointer changes and you can select an area instead (for example, several blocks and attached wires). See also Selecting blocks and wires.
Showing and hiding the overview
The overview area, which shows the entire model, is shown at bottom right of the canvas. If you do not need the overview, you can hide it.
To show or hide the overview
To hide the overview, click the hide icon which is shown directly above the overview area.
To show the overview, click the show icon at the bottom right of the canvas.
Zooming the canvas
The toolbar of the model editor indicates the current zoom percentage for the canvas. The zoom icons in the toolbar allow you to
- zoom out, which makes everything on the canvas smaller so that more items can be shown, and to
- zoom in, which makes everything on the canvas larger, but less items can then be shown.
Info
When you use the key combinations mentioned below, the currently selected area defines what is to be zoomed. When the canvas has the focus (for example, when you have just selected a block or wire), only the content of the canvas is zoomed. When the documentation pane or the palette currently has the focus, the browser’s zoom functionality is used and all of the browser content is zoomed (and the zoom percentage in the toolbar remains unchanged).
To zoom the canvas
To zoom out, click the zoom out icon in the toolbar of the model editor. Alternatively, press Ctrl and the minus key.
To zoom in, click the zoom in icon in the toolbar of the model editor. Alternatively, press Ctrl and the plus key.
Showing and hiding the grid
The blocks, wires and groups on the canvas always snap to a grid. You can decide whether the grid is to be shown or not. The grid is not shown by default. When you zoom the canvas, the grid is zoomed accordingly.
To show or hide the grid
In the model editor, click the toolbar icon for toggling the display of the grid.
When the grid is hidden, the icon looks as follows: .
When the grid is shown, the icon looks as follows: .
When the model is active (read-only mode), it is not possible to toggle the display of the grid and this icon is therefore not shown.
Using the instance editor
The instance editor user interface
A prerequisite for invoking the instance editor is that one or more template parameters have been defined in the model editor (see also Managing template parameters).
The instance editor allows you to set up different instances of the same model. The blocks in each instance can then use different values for the template parameters, and the instances can be activated independently from the other instances. You invoke the instance editor from the model manager. See also Editing the instances of a model.
Info
To edit the instances, you must have ADMIN permission for “CEP management”. If you have READ permission, you will only be able to view the instances.
The instance editor shows the instances for a selected model. If there are any instances, a table shows the values of the instances, the mode and whether the instance is active.
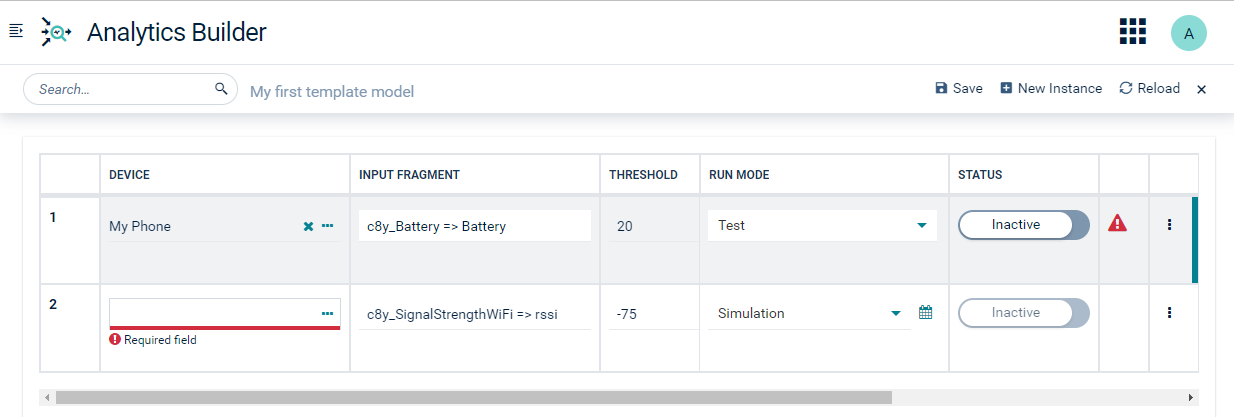
A row is shown for each instance. A column is provided for each template parameter that is defined in the template model, with the name of the template parameter being the column header. When an instance is not active, you can adjust the values for that instance.
A horizontal scrollbar is available if not all template parameters (columns) can be shown on the screen.
The right side of the table shows the mode and status of each instance. You activate (deploy) and deactivate (undeploy) the instances from here. See also Deploying an instance and Undeploying an instance.
Each row that is shown for an instance has an actions menu at the very right which contains commands for managing the instance (for example, to delete the instance).
You can control the list of instances by filtering and sorting. See Filtering and sorting the instances for more information.
If the error icon is shown near the end of a row, the corresponding instance is no longer processing events. Click that icon to get more information.
When you open the instance editor, it may happen that template parameters have been changed since you last edited the instances and that they no longer use the same values types as before. If the values specified in the instance editor are still compatible, they are converted to the new value types. Incompatible values (including checkboxes for boolean types and values that are shown in drop-down list boxes) are automatically removed. Each field from which the value has been removed shows an error underline and a corresponding error message.
Adding an instance
When you add a new instance, a new row is added to the instance editor table. You can then either immediately fill in the required values, or you can first add all required rows and then fill the rows one after the other.
To add an instance
-
In the toolbar of the instance editor, click New Instance. This adds a new row at the bottom of the table. New instances (rows) are shown with a background color until they have been saved.
-
Fill in the instance name and template parameter values, as defined by the model. See also Editing an instance.
Editing an instance
You provide the parameter values for instances in the same way as you provide values for blocks in the model editor (see also Editing the parameters of a block).
The instance editor table provides different types of input controls, depending on the type of template parameter:
- Text boxes are provided in which you can enter values, depending on the setting of the template parameter (for example, a string or a float or a multi-line string). Your input is validated as you type. For example, it is not possible to enter a string value in a text box that expects a float value.
- Checkboxes are provided for boolean values. Selecting a checkbox corresponds to setting the value to
true. - Drop-down list boxes are provided when you can select a different value (for example, to select a different rule for rounding).
- When you edit an input source or output destination, an additional dialog box appears. The dialog box is the same as when selecting a different input source or output destination in the block parameter editor (see Editing the parameters of a block for more information on this dialog box). Click the button which is shown when you hover over an entry to select the input source or output destination that you want to use.
Instances (rows) that have been edited but have not yet been saved are shown with a background color until they have been saved.
When a text box requires a value that has not yet been specified, a message is shown, indicating that this is a required field. It is possible to save the instances and leave the instance editor, and set all of the required values at a later point in time. As long as the missing fields of an instance have not been specified, it is not possible to activate that instance.
Deploying an instance
You can activate (that is, deploy) each instance separately. For example, one instance can be in production mode and another in test mode. See Deploying a model for more information on the different modes; that information applies to both regular models and template models.
When you activate an instance, all changes for that instance are first saved and the instance is then activated.
When an instance is activated, the template parameter values, where supplied, are taken and applied to those block parameters in the model which use a template parameter binding. If no template parameter value is provided, then a default value for that template parameter is used, if there is one. If no template parameter value is supplied in the case of a required template parameter, then the instance will fail to activate.
Once an instance is active, you cannot modify the template parameter values or mode without deactivating the instance first. If any instances are active, then the model is read-only and cannot be modified until all instances are deactivated.
To deploy an instance
-
In the Run Mode column of the instance editor, click the drop-down menu for the instance that you want to deploy and select one of Production, Test or Simulation. You cannot activate instances that are in draft mode.
-
If you have selected simulation mode, click the calendar icon which is now shown, specify the time span that is to be used, and click Apply. See also Simulation parameters.
-
When the toggle button in the Status column currently shows Inactive, click this button to change the state to Active. For simulation mode, you can only set the state to Active when a valid time range has been defined. In the case of an error, the error icon is shown at the right of the table and the instance cannot be activated. Click the error icon to get more information.
Undeploying an instance
You can deactivate (that is, undeploy) each instance that is currently in production, test or simulation mode and for which the toggle button in the Status column of the instance editor shows Active.
When you undeploy an instance, the instance is stopped and no longer processes incoming data. Any state built up in the instance is lost. For simulation mode, this means that the instance is stopped before all historical data from the specified time range has been replayed.
To undeploy an instance
In the Status column of the instance editor, click the toggle button for the instance that you want to undeploy so that Inactive is then shown on the button.
Filtering and sorting the instances
If you have a long list of instances, you can easily locate the instances that you are looking for by entering a value in the search box. Or you can enter part of the value. This searches all input fields in the instance editor and only lists the instances (rows) that contain this value. All values that match the filter are highlighted. The search criteria are not case-sensitive. When search criteria are currently applied, an X is shown in the search box; click this to clear the search and thus to show all available instances.
You can also sort the columns of the instance editor table. To do so, click one of the sort icons that are shown in the column header. This sorts the instances according to the values in that column (for example, alphabetically or by number). Clicking again sorts the column in the opposite direction. Fields with required values in that column that have not yet been specified can thus be shown either at the very top or bottom of the column. You can also sort the instances alphabetically according to run mode and status, for example, to show the active instances at the top.
Editing a value will not affect the display of rows in the instance editor table. If you want to reapply the search and sorting, you must save and reload the instances.
Adding a new instance will not affect the display of rows in the instance editor table. If you add a row after sorting, the row is always added at the bottom of the table, unless you reload the instances.
Info
You can also reorder the template parameters in the Template Parameters dialog box (see Managing template parameters). This affects the sequence in which they are shown in the instance editor.
Duplicating an instance
You can duplicate each instance (row) that is currently listed in the instance editor. The original instance and its duplicate will then both have the same template parameter values and the same mode. However, the duplicated instance is always inactive even if the original instance is active.
To duplicate an instance
In the instance editor, click the actions menu of the instance that you want to duplicate and then click Duplicate.
A new row for the duplicated instance is immediately shown at the bottom of the instance editor table.
Deleting an instance
You can delete each instance that is currently listed in the instance editor. When you delete an instance that is currently deployed, it is first undeployed and then deleted.
To delete an instance
-
In the instance editor, click the actions menu of the instance that you want to delete and then click Delete.
-
In the resulting dialog box, click Delete to confirm the deletion.
Saving the instances
You can save the instances even if there are still rows in which required information must be specified. This is helpful if you want to add that information at a later point in time.
Info
When you activate an instance, all of your recent changes are automatically saved. See also Deploying an instance.
To save the instances
In the toolbar of the instance editor, click Save.
This command is only enabled when changes have been applied to the instances. It saves only those instances where the rows that are highlighted with a background color.
Reloading the instances
You can refresh the display to show the latest state of all instances, or to see whether deployed instances have entered a failed state.
To reload the instances
In the toolbar of the instance editor, click Reload.
If there are unsaved changes when reloading, you are prompted to save these changes first.
Leaving the instance editor
When you leave the instance editor as described below, you are returned to the model manager.
To leave the instance editor
In the toolbar of the instance editor, click the close icon .
If there are unsaved changes when leaving, you are prompted to save these changes first.
Wires and blocks
Values sent on a wire
Blocks within a model are connected from block outputs to block inputs with wires.
Info
These block outputs and inputs are also called output ports and input ports. See also Adding a wire between two blocks.
Wires allow blocks to pass signals and values between blocks. The value sent on a wire is one of the following types, according to the block output from which it is connected:
| Type | Description |
|---|---|
boolean |
A true or false value. A boolean value stays true or false until changed. |
float |
A numeric value, which can be fractional (and processed using fixed precision). A float value maintains its current value until changed. |
string |
A textual value. A string value maintains its current value until changed. |
pulse |
A signal of a point in time. Pulses are only active momentarily. Unlike the above types, they only represent a single instance in time. See also The pulse type. |
any |
A value that may be any of the above types. See also The any type. |
The type of a wire depends on the output to which it is connected. This can be viewed in the block reference. Similarly, the type (or supported types) of a block’s input can be viewed in the block reference.
Value types
The following types are referred to as value types:
booleanstringfloatanywhen used to hold aboolean,stringorfloatvalue
Value types are useful for modeling measurements such as sensor values, which may be read intermittently, or sampled. In between readings, the physical property being measured (such as temperature) will still have some value, as it is a continuous property. For practical reasons, a sensor may not give a continuous stream of output but instead a periodic sampling, or provide new readings only if the value being measured has changed (within whatever measurement resolution the sensor provides). Between sample points, blocks will use the most recent value, as that is the most up to date value being provided. In general, blocks assume that a value stays at whatever the most recent reading of that value is until a new value is received.
For example, consider a pair of temperature sensors. One provides a reading every 10 seconds regardless, while another only provides a new reading if the value has changed by 0.5 degrees. If we connect these to a Difference block, then we may have inputs as shown in the following table, with the corresponding result from the Difference block’s Absolute Difference output:
| Time | Sensor 1 (reads every 10s) | Sensor 2 (output if changed by 0.5) | Difference block: Absolute Difference output |
|---|---|---|---|
| 10:00:00 | 20.0 | ||
| 10:00:03 | 22.0 | 2 | |
| 10:00:10 | 20.0 | 2 | |
| 10:00:20 | 20.0 | 2 | |
| 10:00:23 | 22.5 | 2.5 | |
| 10:00:28 | 23.0 | 3 | |
| 10:00:30 | 21.1 | 1.9 | |
| 10:00:35 | 23.5 | 2.4 | |
| 10:00:40 | 22.8 | 24.0 | 1.2 |
Note that two inputs (to different input ports of the block) to the same block with the same timestamp only generate a single output. For each wire within a model (and each input block), there can only be a single value for a given point in time. An input block cannot generate more than one output for the same timestamp. If it receives multiple events at the same time, then it is undefined which of the events is picked.
In general, blocks will not consider there to be any significance to a wire receiving the same boolean, float or string value as before. Most blocks will not change behavior. This is true for any arithmetic blocks, such as the Difference block in the example above: the output is still 2 on the repeated readings from sensor 1. There are some exceptions, such as the Missing Data block when the Ignore Repeated Inputs checkbox is not selected (false).
If a single block has a numeric value input and pulse signals such as reset, the absence of a new value when a pulse signal occurs means that the value is treated as having the same value still. Thus, when an Average (Mean) block is reset, its output will be equal to the most recently received input (assuming it has received an input since the model has started). In the example below, the Average (Mean) block’s duration has not been set, while the output threshold is set to 0.05; this means the block will generate new output even if there is no new input (see Common block inputs and parameters).
| Time | Reset signal | Sensor 2 | Average (Mean) block output | Notes |
|---|---|---|---|---|
| 10:00:00 | Reset | No output. There has been no input value yet. | ||
| 10:00:03 | 22.0 | 22.00 | With no history, the output value is the input value. | |
| 10:00:23 | 22.5 | All of the values up to this point have been 22, so the average value is still 22 (thus, no new output is generated). | ||
| 10:00:25.22 | 22.05 | Average of 20 seconds at value 22 and 2.22 seconds at value 22.5. | ||
| 10:00:28 | 23.0 | 22.10 | Average of 20 seconds at value 22 and 5 seconds at value 22.5. | |
| 10:00:30 | Reset | 23.00 | The input is still 23 (we just have not received a new event), and reset only discards the history. With no history, the output value is the input value. | |
| 10:00:35 | 23.5 | |||
| 10:00:35.56 | 23.05 | Average at various points in time, when the output changes by 0.05. | ||
| 10:00:36.25 | 23.10 | |||
| 10:00:37.14 | 23.15 | |||
| 10:00:38.33 | 23.20 | |||
| 10:00:40 | 24.0 | 23.25 | Average of 5 seconds at value 23 (from reset at :30 to :35) and 5 seconds at value 23.5 (from :35 to :40). |
The following graph illustrates the inputs to the Average (Mean) block and the output of this block:
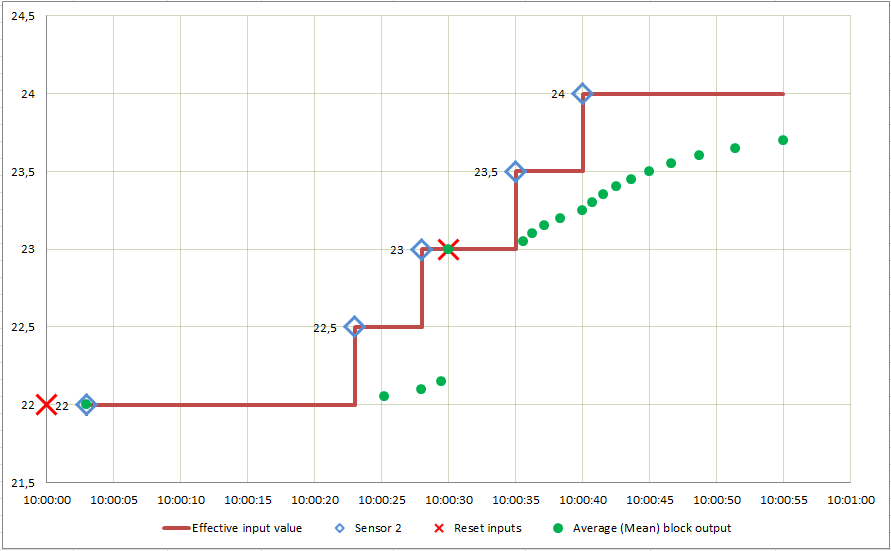
Note how the effective input value is unchanged until a new measurement input occurs, and the Average (Mean) block operates on this effective value (the red line in the above graph). When reset, the block outputs the current effective input, which at the second reset at 10:00:30 is 23. Note that when the Output Threshold parameter is set, new outputs can be generated even if no new input occurs, and will asymptotically approach the last input value. Note that this behavior differs from Apama queries or stream queries.
If the Average (Mean) block was configured with a window of 10 seconds, then the window would apply as illustrated below:
| Time | Reset signal | Sensor 2 | Effective input value | Average (Mean) block output | Values in window history | Notes |
|---|---|---|---|---|---|---|
| 10:00:00 | Reset | |||||
| 10:00:03 | 22 | 22 | 22.00 | First value after start: the window is empty, so the Average (Mean) block uses the input value for the output. | ||
| 10:00:23 | 22.5 | 22.5 | 22 | |||
| 10:00:23 - 10:00:28 | 22.5 | increasing from 22.00 to 22.20 | 22, 22.5 | Proportion of window that is 22 or 22.5 changes over time, thus the output changes. | ||
| 10:00:28 | 23 | 23 | 22.25 | 22, 22.5 | ||
| 10:00:28 - 10:00:30 | 23 | increasing from 22.25 to 22.40 | 22, 22.5, 23 | |||
| 10:00:30 | Reset | 23 | 23.00 | Window is reset and thus now empty; the current (effective) input is 23, so the Average (Mean) block uses that for the output. | ||
| 10:00:35 | 23.5 | 23.5 | 23 | |||
| 10:00:35 - 10:00:40 | 23.5 | increasing from 23.00 to 23.20 | 23, 23.5 | |||
| 10:00:40 | 24 | 24 | 23.25 | 23, 23.5 | Window is now full (10 seconds since reset). | |
| 10:00:40 - 10:00:45 | 24 | increasing from 23.25 to 23.75 | 23, 23.5, 24 | |||
| 10:00:45 | 24 | 23.75 | 23.5, 24 | Value 23 is now finally expired from the window (this was the effective input until 10:00:35, which is 10 seconds ago). | ||
| 10:00:45 - 10:00:50 | 24 | increasing from 23.75 to 24 | 23.5, 24 | |||
| 10:00:50 | 24 | 24 | 24 | Value 23.5 is now finally expired from the window (this was the effective input until 10:00:40, which is 10 seconds ago). The window now contains 10 seconds worth of measurements, all with value 24. |
In the above, note how the current value only has any weighting in the window (that is, contributing to the output value) after the measurement is received. At the point the measurement is received, it has zero weighting compared to the previous history. As before, the sensor’s value remains the effective input until it is replaced with a newer value (note that this is different to aggregates with timed-based windows in Apama queries or stream queries). For example, the block has an effective input value of 23.5 from 10:00:35 to 10:00:40, and the value 23.5 is thus only finally expired from the window at 10:00:50, 10 seconds after it ceased to be the current effective input value, rather than 10 seconds after it first entered the window. Finally, note that when the window is empty, the effective input is used as the output instead, as the window is zero-length.
The pulse type
In contrast to value types, the pulse type represents a single point in time. For example, this may be a result of:
- a user pressing a momentary-action button,
- a state transition of a device,
- a sensor detecting a person walking through a door,
- a heartbeat event to denote a remote device is still alive, or
- a state transition of a block within a model.
Typically, blocks act upon every pulse sent to one of their inputs. Pulses are commonly used to trigger an output from a model using an output block, or used to reset the state of blocks within a model.
Pulses are active momentarily. In some regards, they are similar to a boolean value which is automatically reset to false after a model has processed a value.
Repeated pulses are typically significant, though they may not necessarily result in any change, depending on how they are being used. For example, repeatedly resetting an Average (Mean) block while its input value is unchanged will result in the output value remaining the same.
The any type
The any type is used on blocks which pass through a value of any type (for example, a Time Delay block or a Gate block).
Values of the any type can represent a value type or a pulse type.
Type conversions
It is legal to connect a block output to a block input if they are the same type. Most other connections are also permissible, which result in the conversions as described in the table below. An  indicates that a connection is not legal; trying to deploy a model with such a wiring connection will fail.
| From block with output type | ||||||
|---|---|---|---|---|---|---|
| pulse | boolean | float | string | any | ||
| Connect to input of type | pulse |  |
pulse occurs when output changes to true | pulse occurs when output changes value | pulse occurs when output changes value | pulse occurs when output changes value (excluding changes to false) |
| boolean | true when the pulse has occurred, otherwise false | |
true if non-zero | true if not an empty string | true if value non-zero/empty | |
| float | |
0 for false, 1 for true | |
|
permitted if the value is of type float or boolean, other values fail at runtime | |
| string | |
"true" or "false" | number converted to a string (may be in scientific notation) | |
string value (may be in scientific notation) | |
| any | |
|
|
|
|
|
Only conversions that will always succeed are allowed. String values are not converted to float values; while the input conversion may work sometimes, it cannot be guaranteed to always work.
In many cases, you need not worry about type conversions and where a wire makes sense. Any type conversion that is needed happens automatically.
Some blocks accept different types of inputs, and may change their output type or behavior depending on the input types. For example, the logical OR block can operate on either boolean or pulse inputs, and its output is the same as its input types.
In some cases, it is desirable to force a value to be interpreted as a specific type, in which case a converter block can be used to force a conversion to a specific type. For example, the Pulse block can convert boolean or float values to pulses, according to the conversions above. This means: for boolean, generate a pulse when the boolean value changes to true; for float, generate a pulse when the value changes. Thus, connecting two float outputs to an OR block directly will generate a boolean output which is true when either of the float outputs is non-zero. Alternatively, connecting two float outputs each to a Pulse block and from them to the inputs of an OR block, will send a pulse whenever either float output changes value. This is the default behavior of the Pulse block.
Different types of pulse conversions are possible with the Pulse block, depending on the setting of its Mode parameter. The conversions in the different modes are described in the table below:
| From block with output type | ||||||
|---|---|---|---|---|---|---|
| pulse | boolean | float | string | any | ||
| Connect to Pulse block in mode | On value change (default) | |
pulse occurs when output changes to true | pulse occurs when output changes value | pulse occurs when output changes value | pulse occurs when output changes value (excluding changes to false) |
| On every input | |
pulse occurs on every input | pulse occurs on every input | pulse occurs on every input | pulse occurs on every input | |
| On non-zero values | |
pulse occurs on every true input | pulse occurs on every non-zero input | pulse occurs on every non-empty input | pulse occurs depending on value's type as described in cells to the left | |
Processing order of wires
Where a block has multiple inputs connected, all of these inputs are calculated before the block performs any calculations based on the inputs. It may be that the inputs for a block occur out of step with each other (such as in the example for two temperature sensors in Value types), in which case a block uses the latest value for value type inputs.
Where a single value is sent on two or more paths which both lead to the same block, the block performs calculations based on the latest value for both paths. This ensures consistent behavior when multiple paths to a single block exist. For example:
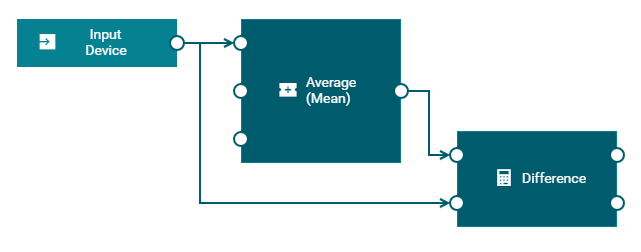
When the device measurement is received, the Average (Mean) block calculation is completed to generate an average before the Difference block computes the difference between the value and its average.
Wire restrictions
While a block’s output can be connected to multiple other blocks, a block’s input can only have a single connection.
It is also legal to leave a block’s input or output unconnected if that is not required (the Average (Mean) block in the example that is given in Processing order of wires does not have anything connected to its Sample or Reset inputs).
Wires cannot create cycles. This means, the output of a block cannot be connected to
- the input of the same block, or to
- the input of any block that is connected directly or indirectly to one of the source block’s inputs.
For example, there are three blocks: Block1, Block2 and Block3. A model would contain a cycle in the following cases:
- The output of Block1 is connected to the input of Block2, and the output of Block2 is connected to the input of Block1.
- The output of Block1 is connected to the input of Block2, the output of Block2 is connected to the input of Block3, and the output of Block3 is connected back to the input of Block1.
There are many possible connections which may lead to cycles in the model. The model editor, however, prevents you from creating cycles.
Block inputs and outputs
Many blocks have inputs or outputs that do not have to be used.
Some blocks generate several different outputs, and a model may only require some of the outputs available.
Some blocks have inputs, especially inputs of the pulse type, which do not have to be used. Leaving these not connected to anything is fine, and the operation associated with those inputs (such as Reset, see Common block inputs and parameters) will never be triggered.
Blocks can, when needed, detect which inputs are connected. For example, the AND block has five inputs, but it only requires the inputs that are connected to be true to generate a true output.
Common block inputs and parameters
The inputs listed below are the names of common input ports that are shown on the left side of a block.
-
Value input
Most calculation blocks have one main input which is called Value. This is the value on which the block performs its main calculation.
-
Value 1 and Value 2 inputs
Blocks may have a number of similar inputs, which may be labeled Value 1, Value 2, and so on. You can find such inputs with the Difference block (see also the example in Value types) or with the AND and OR logic blocks. Typically, there is nothing significant as to which input is used.
-
Reset input
Blocks that maintain some internal state may also have a Reset input, which is typically a
pulsetype. This does not have to be connected, but can be used to explicitly control on which range of readings a block should perform a calculation. For example, a model that monitors vehicle journeys may reset on the engine starting, which signifies the beginning of a journey. See also Value types for an example that illustrates the Reset input. -
Sample input and Output Threshold parameter
Blocks typically re-calculate their output when a new input is received. Some blocks may also generate output at some point after receiving an input, either because of time delay parameters set (for example, with the Missing Data or Time Delay blocks), or because their output may change over time even if the input value is constant. For example, the Integral block with a positive input generates an ever-increasing output until its window is full (or indefinitely if no duration has been set, when the block is calculating the integral over an unbounded window).
As with real-world sensors, it is not practical to create a continuously changing output. As well as generating an output if their input value changes, such blocks may also have a Sample input which triggers the block to re-evaluate and generate a new output, even if the input has not received any new value and the output has not changed by a significant amount. This is useful if there is a specific point in time when the output of the block should be calculated, as its output is going to be used at a later point in the model.
Alternatively, such blocks may have an Output Threshold parameter, which is used to control how frequently the output is re-calculated. When set, the block determines when its output will change by the output threshold, and when that occurs, even if it is not as a result of any new input value, the block generates an output value.
The Output Threshold should be set taking into account what error margins will exist on the input value (real-world physical sensors have some limited precision and accuracy in the property they are measuring), and what precision is required in the output.
Take care to avoid Output Threshold values that are too large or too small. If the values are too large, the block does not generate a new output when needed (unless the Sample input is used). If the values are too small, the block limits how frequently it generates output. If you want to change the values, send a
POSTrequest to Cumulocity that changes the value for theminimum_wait_time_secskey. See Configuration for detailed information.The scale of appropriate values varies depending on what the magnitude of the input value is. If Output Threshold is not set, then the block only generates new outputs if it receives an input (this may be appropriate if it is receiving frequent inputs on the value, or if the Sample input is being used).
-
Ignore Timestamp parameter
For Cumulocity measurements, events and alarms, the block by default uses the source timestamp available on the input. The block reorders the input based on the timestamp (see also Input blocks and event timing), but drops events that are delayed by too much. If this behavior is not desirable (for example, if a device’s clock is not well synchronized, or if data from a device may be delayed), then you can disable this behavior by selecting the Ignore Timestamp parameter. If this is selected, the timestamp of the data is ignored, and the model processes the input data as soon as it is received, regardless of what timestamp it has. This may give different results compared to the default behavior of using timestamps. The behavior which is most desirable will depend on the nature of the device and its connectivity to Cumulocity.
Note that when a model is running in simulation mode, the setting of the Ignore Timestamp parameter is ignored. The block will always use the source timestamp, so that when replaying simulation events, the data is guaranteed to be processed in order and this will yield more realistic results (and there is no record of when the data was received, only the source timestamp). See also About simulation mode.
Input blocks and event timing
Input blocks make data from external sources (such as Cumulocity measurements) available to the model. Many data sources have timestamps on each piece of data, which reports the time that a measurement or event actually occurred. There may be delays in transmitting the data to the Apama system for processing, leading to events being received by Apama out of order.
Data sources with timestamps, such as measurements, can be reordered. Operations, for example, do not have timestamps and are therefore processed as they are received, without reordering.
Analytics Builder delivers several input blocks which consume data sources with timestamps. These blocks provide an Ignore Timestamp parameter which allows you to disable data reordering and thus to process the inputs as they are received. See also Common block inputs and parameters.
The following table lists the available input blocks and indicates whether they are able to reorder the input:
| Input block | Reordering is possible |
|---|---|
| Alarm Input | Yes |
| Event Input | Yes |
| Managed Object Input | No |
| Measurement Input | Yes |
| Operation Input | No |
| Position Input | Yes |
Info
The Position Input block is a specialized Event Input block. You can also use the Cron Timer block to activate a model periodically. Unlike the above blocks, the Cron Timer block is not associated with a device and can be found in the Utility category of the palette.
For data sources that have timestamps associated with a piece of data, the input block can handle events received out of order. In order to do this, the input blocks hold all received events in a reorder buffer and delay processing them until a predefined delay time after their source timestamp. By delaying the processing of the event relative to the source timestamp, the input block allows events to be reordered. The key parameter to this process is the amount of time by which the events are delayed. To configure the time in seconds by which the input blocks delay inputs, send a POST request to Cumulocity that changes the value for the timedelay_secs key. See Configuration for detailed information.
The input blocks assume that while events may be delivered out of order, they are received by Apama within the defined time delay value. If an event is received after a delay of more than the defined number of seconds (that is, the difference between the timestamp in the event and the time on the system running Apama), then it is dropped if an event for the same timestamp or a more recent timestamp has already been processed by the model. Thus, it is possible that an old event might be processed by one model but dropped by another model.
If the time delay value is set too low, then a small delay may result in Apama dropping an event, which can lead to erroneous results. The higher the time delay value is, the larger is the delay before an event is processed. Thus, it is important to pick a suitable value for the time delay to match the environment for events being delivered into Apama.
The correlator logs the number of dropped events periodically to the log file. See Configuration for configuring logging throttling and Log files of the Apama-ctrl microservice.
Output blocks and event timing
Output blocks make data (such as Cumulocity measurements or operations) from the model available to external systems (such as Cumulocity). Outputs blocks can either produce synchronous or asynchronous values.
The values from an output block which generates synchronous output (such as measurements) can also be consumed by another model in a time-synchronous manner and can be processed by the model with any other data from the same timestamp. See also Connections between models.
The values from an output block which generates asynchronous output can also be consumed by another model, but only in a time-asynchronous manner when data is received back from the external system.
The following table lists the available output blocks and indicates whether the output is synchronous or asynchronous:
| Output block | Type of output |
|---|---|
| Alarm Output | Synchronous |
| Event Output | Synchronous |
| Managed Object Output | Asynchronous |
| Measurement Output | Synchronous |
| Operation Output | Asynchronous |
Fragment properties on wires
Each wire has a primary value that is of the type of the wire: one of float, boolean, string or pulse.
In addition to this, some blocks may provide other fragments of information alongside the value. These are named properties on the value. They may be other pieces of information provided from an input block, such as the unit in which a measurement is measured, or some extra contextual information for a data source.
Most blocks only operate on the primary value from their input wires, but some blocks can make use of these fragment properties values and extract them into separate output ports (for an example, see the Extract Property block). This gives more flexibility in processing more complex data from external sources.
Keys for identifying a series of events
Input and output blocks identify a series of events by specifying a key for the series (or stream) of events. This series of events is used to identify correct events to deliver to an input block. The key is made up of multiple block parameters, and identifies that series of events distinct from other series of events through the same block type. For example:
- For
Measurementobject input and outputs, the key is the device, the fragment, and the series. The Unit parameter specified in an output block is not considered part of the key (it is for information only) and is not required to match the parameters of the Measurement Input block. - For
Eventobjects, the key is the device and the event type. - For
Alarmobjects, the key is the device and the alarm type.
Important
In Analytics Builder, for synchronous output types such as measurements, events and alarms (see also Output blocks and event timing), it is allowed to have more than one output block that generates output with any given key.
As there can be connections between the models, ambiguities may occur while processing events in the input blocks if there are multiple output blocks (in different models) generating the same output stream at the same point in time. When using output blocks, ensure that no two blocks generate output of the same stream type at the same time.
Details of values and blocks
Introduction
Analytics Builder provides an environment for connecting blocks together to form models that can process and react to inputs. Analytics Builder uses a few types of values internally, and it is important to understand the differences between these. The following topics cover the distinctions between value types representing continuous-time and discrete-time values, and the pulse type. They also cover some of the details of block implementations around windowing and when blocks generate output.
Summary
In Analytics Builder, the value types float, boolean, and string are used to represent continuous-time values. They have the following properties, which you should consider when writing models or creating custom blocks:
- A value wire holds its value until there is new input.
- Repeated inputs of the same value should not affect the output (for most cases).
- There is no guarantee that a new input will occur within a defined time period.
Contrast these to the pulse type, which represents discrete events and has the following properties:
- A pulse represents a single point in time.
- Multiple inputs of a pulse have significance, even if there is no difference to any value associated with the pulse.
- If a block has multiple input ports for pulses, inputs occurring at different times to different ports will only be “seen” one at a time. An input port for a pulse on a block acts as if it is automatically “reset” after evaluation.
These properties and the rationale behind them are explored and explained in the following topics. These topics also explain how to handle cases that do not fit into these distinctions, such as discrete numeric measurements.
Values as representations of continuous-time physical quantities
A continuous-time value type, especially of the float (that is, numeric) type, is typically used to represent the measurement of some continuous physical quantity or property by a sensor. For example, a value may represent one of the following:
- The pressure in a pipe.
- The temperature measured by a thermometer.
- The rotational speed of an axle.
- The position of an object.
These are all continuous measurable properties which are analog in nature. There will be some degree of precision as to how accurately they can be measured in both time and value (and within physical limits). By time accuracy, we mean how frequently a measurement can be made and how precisely the time of the measurement is recorded. There may also be latency - a delay between a change in the actual property and when that can be measured. By value accuracy, we mean with what level of precision the value can be measured - typically at least 2 significant figures, and rarely more than 4 or 5 significant figures of precision can be distinguished. By continuous, we mean that it is valid to measure the property at any point in time.
Taking discrete measurements at different times rather than continuously may be referred to as “sampling” (see also https://en.wikipedia.org/wiki/Sampling_(signal_processing)), and limits as to the value precision may be referred to as “quantization error” (see also https://en.wikipedia.org/wiki/Quantization_(signal_processing)). When measuring a continuous value, the rate at which measurements are obtained should not make significant differences to the output of a block or a model. More measurements may give a more accurate output, but should not make a gross change to calculations.
For example, a sensor measuring the rotational speed of an axle may be able to provide a new measurement every one tenth (0.1) of a second, and only measure in the range 0 to 10000 rpm to the nearest 50 rpm. A change of 10 or 20 rpm may not result in any change of measured value, as the change is less than the level of precision. Applying brakes to a rotating axle to stop it may not be detected immediately, but result in one reading of 1000 rpm, followed by a reading 0.1 seconds later at 0 rpm after the axle has stopped (while the axle would take a few tens of milliseconds to stop, slowing down over that time period).
A sensor may be connected in such a way that it provides a new measurement at a regular frequency (for example, audio sampling at 8,000 Hz or a camera taking video at 50 frames a second). This is a regular sampling input.
A simple and common optimization is that a sensor or device may generate a new measurement value only if the value is different to the previous value. For many sensors, it would be normal to measure something that often maintains a steady or constant value (at least to within the quantization limit), and there is little value in repeatedly sending the same value. This is an on-change input. There will still be an underlying sampling frequency, but new values are only transmitted from the sensor if they are different.
It is also possible to combine the regular sampling and on-change forms together: a sensor that generates a new input if the measurement is different, or periodically. This is a hybrid input. For example, the rotational sensor described above may only send a value if the rotation speed changes, or every 10 seconds regardless.
As an example, consider a raw value that changes over time as so:
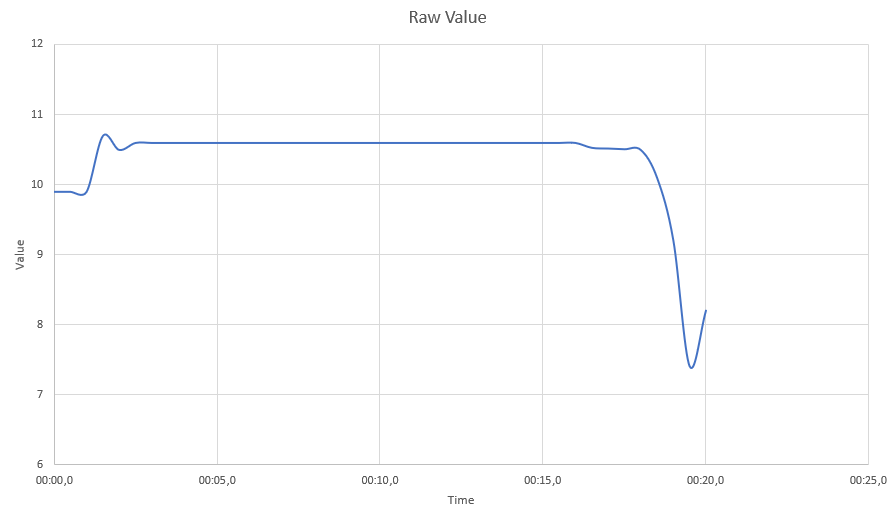
But suppose the sensor can only measure to the nearest whole number, and only once a second. The value thus has some error, shown by the red error bars:
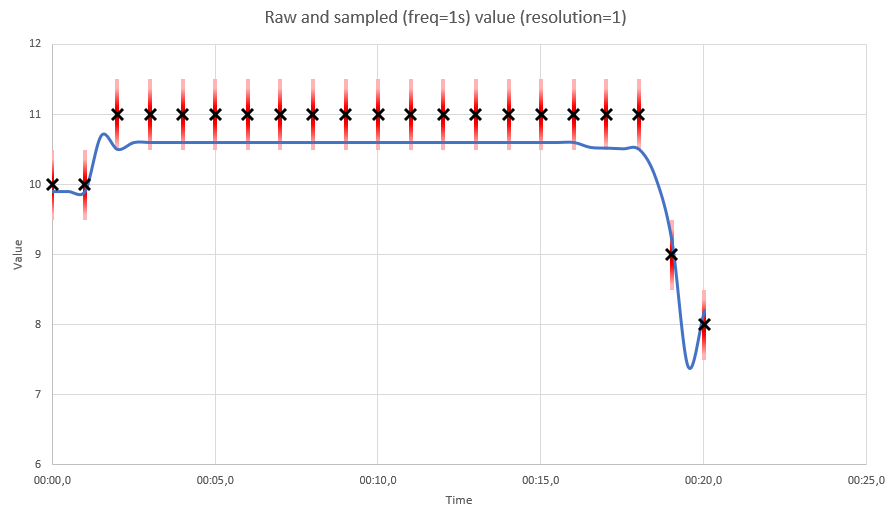
A regular sampling sensor would generate uniform inputs:
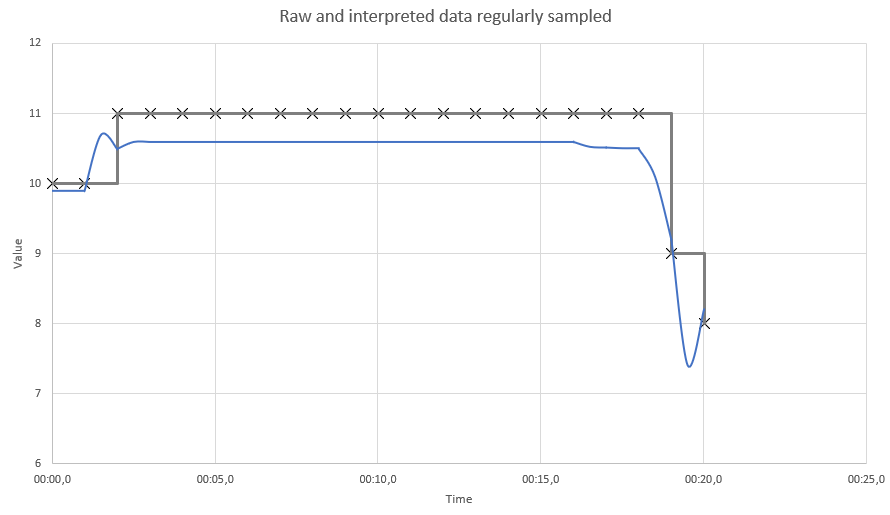
While an on-change sensor would generate inputs only when a value changes:
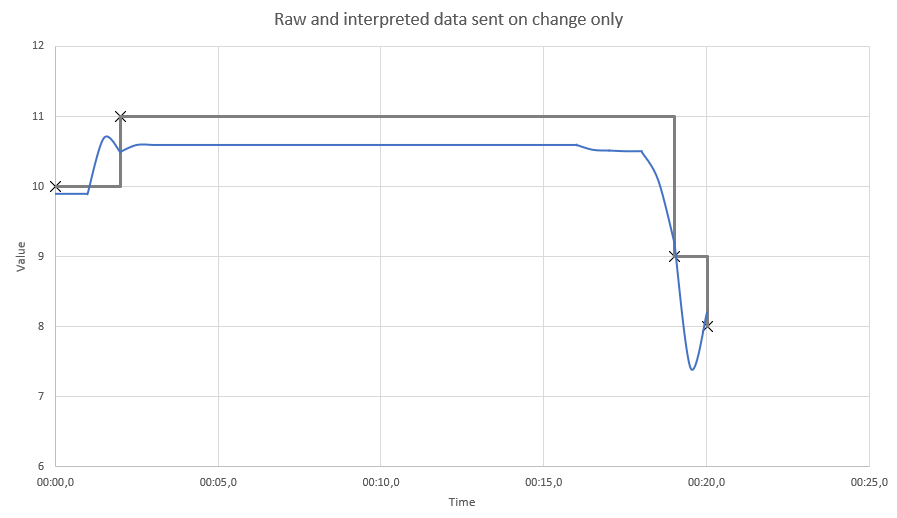
The grey line shows how a real-time processing system such as Apama interprets such values. A value is assumed to maintain the latest value until it is replaced by a newer value. It is also common to draw lines between measurements. So there is a straight line decreasing from value 11 at 00:01 to value 9 at 00:19. However, a real-time system cannot do this. It does not know what the next value is, whereby viewing historic data can interpolate between values. At time 00:19.5, the only information it has is that the value was 11 and then 9. It does not yet know that the value will be 8 at time 00:20. Note that there is no difference between the interpreted grey line in the regularly sampled and on-change-only case. Note that in the middle of the graph, there is a significant quantization error (the true value of 10.6 is read as 11), and the sampling frequency of only once a second means that the minimum point of 7.4 at 00:19.5 seconds is lost.
Input values at different times
Consider two position sensors which give the position of two robot arms, and both are on-change sensors. If the two arms move together in unison in the same direction and speed, then the position sensors should update to new values at the same time such that they are a constant distance apart (or at least, close to a constant distance). If the Difference block has inputs connected to both sensors, then even if the robot arms move, the output of the Difference block should be approximately constant. Analytics Builder evaluates all values with the same timestamp, so even though there may be a small delay in receiving the values from the two sensors, provided they supply timestamps from the same clock (and the Ignore Timestamp parameter of the Measurement Input block is not set), then the Difference block will always generate a synchronized output, as shown in the table below:
| Time | Position sensor 1 | Position sensor 2 | Output of the Difference block |
|---|---|---|---|
| 00:00 | 4 | 14 | 10 |
| 00:01 | 6 | 16 | 10 |
| 00:02 | 9 | 19 | 10 |
By contrast, consider if the two robot arms do not move in unison - one moves, then another. The distance between the arms may vary as either arm moves. As the sensors are on-change inputs, there will only be a new value when the position changes. However, the absence of an input does not mean that the corresponding robot arm does not have a position. It has remained where it is (within error margins). For example:
| Time | Position sensor 1 | Position sensor 2 | Output of the Difference block |
|---|---|---|---|
| 00:00 | 9 | 19 | 10 |
| 00:01 | 11 | 19 | 8 |
| 00:02 | 13 | 19 | 6 |
| 00:05 | 13 | 18 | 5 |
| 00:06 | 13 | 17 | 4 |
| 00:07 | 13 | 15 | 2 |
The bold numbers indicate the effective value. The last value latches if it has not been replaced by a more up-to-date value.
On-change inputs and time windows
If an on-change input is connected to an aggregate block such as the Average (Mean) block, then the block should treat the input as continuously having the most recent value it received. This is significant for blocks that maintain a time window. Even if the block last received an input (and thus had its $process action called) more than the time window ago, the contents of the window will contain the most recent value. For example, consider the Average (Mean) and Integral blocks with window duration set to 10 seconds, and input as so:
| Time | Input value | Window contents | Output of the Average (Mean) block | Output of the Integral block |
|---|---|---|---|---|
| 00:00 | 10 | 0: 10 | 10 | 0 |
| 00:02 | 11 | 0-2: 10 | 10 | 20 |
| 00:10 | 11 | 0-2: 10, 2-10: 11 | 10.8 | 108 |
| 00:12 | 11 | 2-12: 11 | 11 | 110 |
| 00:19 | 9 | 9-19: 11 | 11 | 110 |
| 00:20 | 8 | 10-19: 11; 19-20: 9 | 10.8 | 108 |
In this case, note how a measurement received at time 00:02 still has influence on the output at 00:19 and later - because it is not replaced until 00:19. Also note that when a new value occurs, it has zero influence on the average or integral - it has not been that value for any time yet. The only exception is for the Average (Mean) block when it starts - with an empty window, the output is the input value.
Also refer to the diagram below for what values the window covers at time 00:20:
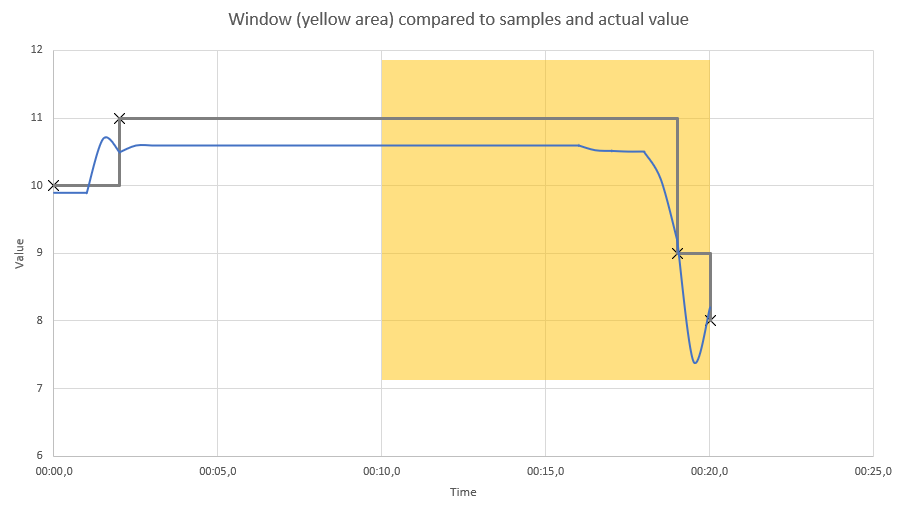
While only the measurement updates with values 9 and 8 were received within the window, the average value within the window is close to the 11 value. The measurement update for that was received at time 00:02, but as it is a continuous value, it continues to hold the 11 value until time 00:19.
Note that for a block such as Missing Data, the absence of input for some time may affect the behavior of the block. If the Missing Data block is configured with a 10 second duration, then it would trigger at time 00:12.
If the Average (Mean) and Integral blocks receive a regular input from a regular sampling sensor, then the block will receive more measurement values, and the comparable table is:
| Time | Input value | Window contents | Output of the Average (Mean) block | Output of the Integral block |
|---|---|---|---|---|
| 00:00 | 10 | 0: 10 | 10 | 0 |
| 00:01 | 10 | 0-1: 10 | 10 | 10 |
| 00:02 | 11 | 0-2: 10 | 10 | 20 |
| 00:03 | 11 | 0-2: 10, 2-3: 11 | 10.333 | 31 |
| 00:04 | 11 | 0-2: 10, 2-4: 11 | 10.5 | 42 |
| 00:05 | 11 | 0-2: 10, 2-5: 11 | 10.6 | 53 |
| 00:06 | 11 | 0-2: 10, 2-6: 11 | 10.667 | 64 |
| 00:07 | 11 | 0-2: 10, 2-7: 11 | 10.714 | 75 |
| 00:08 | 11 | 0-2: 10, 2-8: 11 | 10.75 | 86 |
| 00:09 | 11 | 0-2: 10, 2-9: 11 | 10.778 | 97 |
| 00:10 | 11 | 0-2: 10, 2-10: 11 | 10.8 | 108 |
| 00.11 | 11 | 1-2: 10, 2-11: 11 | 10.9 | 109 |
| 00:12 | 11 | 2-12: 11 | 11 | 110 |
| 00:13 | 11 | 3-13: 11 | 11 | 110 |
| 00:14 | 11 | 4-14: 1 | 11 | 110 |
| 00:15 | 11 | 5-15: 11 | 11 | 110 |
| 00:16 | 11 | 6-16: 11 | 11 | 110 |
| 00:17 | 11 | 7-17: 11 | 11 | 110 |
| 00:18 | 11 | 8-18: 11 | 11 | 110 |
| 00:19 | 9 | 9-19: 11 | 11 | 110 |
| 00:20 | 8 | 10-19: 11; 19-20: 9 | 10.8 | 108 |
Note that the highlighted lines are the same as without the repeated measurements. Repeated measurements of the same value received by these blocks make no difference to what the block would calculate if re-evaluated.
Window block output timings
For aggregate blocks such as the Average (Mean) block, the effect of a change of input value means that, if regularly re-evaluated, the output of the block will change, approaching the new value. If there have been different input values received by the block in the past, then a re-evaluation of the block at any point in time is possible, and each may generate a different output.
With the previous example from On-change inputs and time windows, repeatedly re-evaluating an Average (Mean) block with a 10 second window will yield the following:
| Time | Input value | Output of the Average (Mean) block |
|---|---|---|
| 00:00 | 10 | 10 |
| 00:01 | 10 | 10 |
| 00:02 | 11 | 10 |
| 00:03 | 11 | 10.333 |
| 00:04 | 11 | 10.5 |
| 00:05 | 11 | 10.6 |
| 00:06 | 11 | 10.667 |
| 00:07 | 11 | 10.714 |
| 00:08 | 11 | 10.75 |
| 00:09 | 11 | 10.778 |
| 00:10 | 11 | 10.8 |
| 00.11 | 11 | 10.9 |
| 00:12 | 11 | 11 |
It would also be possible to re-evaluate the block every half a second, or any fraction of a second - to milliseconds or even smaller times between re-calculations. It is impractical to “continuously” re-evaluate the block (to re-calculate the average value at a given point in time and generate a new output). So when is an appropriate time for the block to evaluate and generate an output?
The Average (Mean) block (and others) provide an Output Threshold parameter. If this is set, then the block emulates a sensor which generates a new measurement reading if the output changes by the output threshold amount. Thus, if set at 0.1, we get several outputs between 00:02 and 00:03 (when the output is changing from 10 to 10.333), another output between 00:03 and 00:04 (when it reaches 10.4), outputs at 00:04 and 00:05 exactly, another between 00:06 and 00:07 (10.7), then at 00:10 and 00:11 and 00:12. The block calculates at what time the output would vary by more than the output threshold compared to the most recent output, and re-evaluates at that point in time. Thus, the output may occur quite irregularly in time, but output at times such that the values output always differs by an amount equal to the output threshold. The block also re-evaluates on any new inputs, even if there is not a different value to the last input.
As models may wish to perform a calculation with the output of the Average (Mean) block at any point in time (for example, to compare to another measurement), a Sample input port is also provided, to force a re-evaluation and generate an output value.
Windows and buckets
A number of blocks, primarily those in the Aggregate category, maintain a time-based window of input values received in the past. Their output is a calculation based on values within this window. Typically, such blocks offer two distinct ways of managing this window:
- A parameter value specifying the duration of the window. If set, the window automatically expires interpreted values older than the time specified (where interpreted values are the latest received value at any point in time, as described in On-change inputs and time windows). If the parameter is not specified, then the block does not automatically expire any data.
- A reset input. When a signal is received, the contents of the window is cleared and the block resets to having no contents.
It is possible to use these in combination, or neither, but more typically one or the other.
For the case of the window duration being specified, the block must be able to expire old data. A strictly exact implementation of this would be to store each different measurement input along with the time it occurred. For long windows and/or high frequency inputs, this can result in a large amount of data being stored. To avoid an excessive amount of data being stored, the product blocks do not store all measurement values and times. Instead, the window duration is divided into equal-size buckets. The blocks store state per bucket and use that information to re-calculate the output of the block. A historic bucket can either be completely within the window or be partly expired. If a bucket is partly expired, then the block applies a fractional proportion of the values within that bucket. The practical effect of this is that if the value is changing without significant fluctuations, there is only small difference between an exact (but more resource-intensive) implementation of the block and one that uses buckets. If there is a significant fluctuation in the input value that causes a shift in the output, then the exact time of individual measurement inputs is lost, and the effect that the significant value has as it expires will be spread in time by up to one bucket duration. The product blocks use 20 buckets as a reasonable compromise between accuracy and efficiency.
To illustrate this, we exaggerate the effect by simulating an Average (Mean) block with 3 buckets and a 3 second window, so each bucket is 1 second in duration. A few anomalous readings (after a continuous input of value 1) affect the average for both exact and bucket-based Average (Mean) blocks in the same way, but we can compare the result of “exactly” expiring each value exactly 3 seconds after it occurred with using buckets, where the change in output is smoothed over the bucket duration:
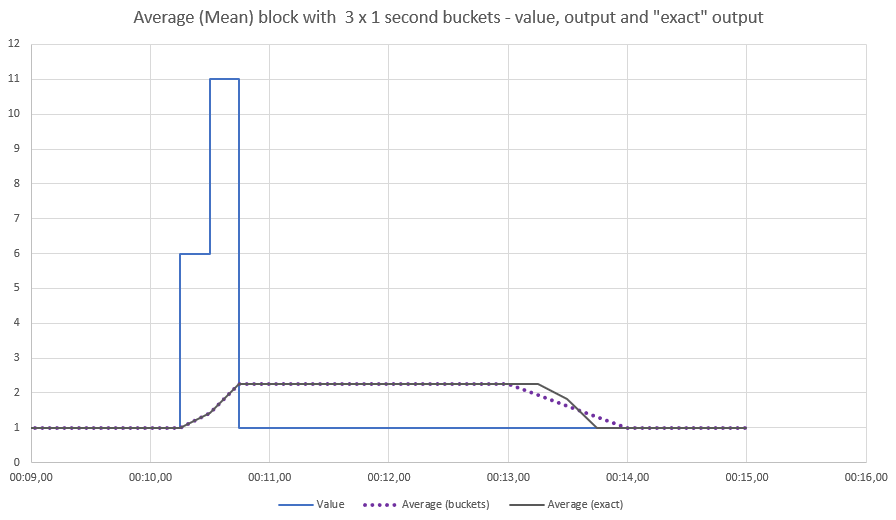
Note that not only is the timing of the expiry of the anomalous values less precise, the exact shape of the output is lost. The bucketed average changes uniformly between time 00:13 and 00:14. Remember, the product blocks use 20 buckets, so the effect would be less pronounced in this case.
Pulse signals
A pulse is used to signal a point in time or a change of state. Examples of use cases for pulses are:
- A person goes through a gate (for example, at a train station).
- A button is pressed (for example, an emergency stop button).
- A machine goes into a new state (for example, a gateway is reset or powered on).
- A device has made a connection to the network.
In Cumulocity, events, alarms and operations are used as the sources of pulses.
A pulse may be merely a point in time, but it can also convey extra information, for example, the version number of the software or which network node it has connected to. These can be obtained using the Extract Property block. If you are writing your own custom blocks, these are accessible if the input is declared as a Value type, which has a properties field. This can be used with numeric value types as well. See the documentation for the Analytics Builder Block SDK for more information on the Value type.
In contrast to measurement values, the timing and number of pulses is very significant, and even though the only difference between subsequent pulses may be the time they were received, each is still significant (whereas multiple measurements with the same value are of little interest).
In contrast to measurement values, a pulse is only active for a single evaluation of a model, where a model evaluation processes all blocks that have a timer that fires (including input blocks) and any blocks connected to outputs that have changed. While both pulses and boolean measurement values are represented by the boolean type in the EPL of the blocks, their behavior is different:
- If a boolean measurement value is received by a block, it will “stick” to its value until replaced. For example, if looking at whether temperature sensors 1 and 2 are both over a threshold using an AND block, that value is still true after receiving high measurements.
- If a pulse is received by a block, it is reset after it is evaluated. For example, if an Average (Mean) block is reset by an event, then the reset happens when the event is received. After that, if no further event is received, the block is not reset on future value inputs.
It is still valid and sensible to combine multiple pulses, for example, with an AND block. If two pulses occur at the same point in time, that will be a single evaluation. For example, the Threshold block has a Crossed Threshold output port which is a pulse that is sent only when a continuous value input goes from one side of the threshold value to another. Two sensors on the same device (thus with the same timestamp) may cross thresholds at the same time, so the AND of the output of two such thresholds will only trigger if both inputs cross the threshold with new values of the same timestamp. Note that if one sensor crosses the threshold and then later the other sensor, the blocks below would never give an output from the AND block. They would only do this if the two occurred at the same time.
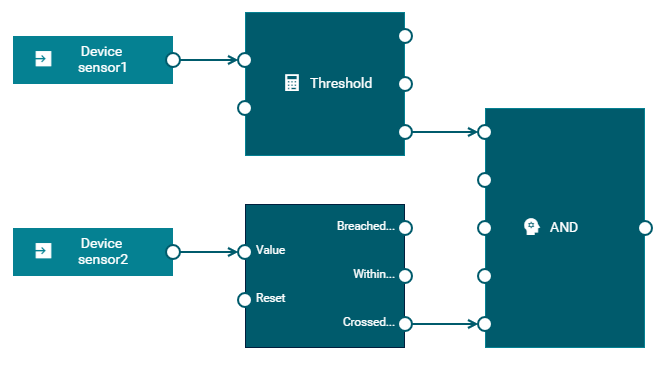
Discrete-time measurements
There are some cases where a measurement would be used where a numeric measurement value does not represent a continuous-time property. For example:
- The weight of parcels passing a weighing machine on a conveyor belt.
- The size of objects passing a measuring point.
- The value of a ticket scanned or printed by a machine.
In contrast to the continuous-time values, each of these are significant, even if two measurements are of the same value. The time of each measurement may have some significance, but the time between subsequent measurements is of no great significance. If the measurements were received with slightly different timings, or even potentially out of order, this would not signify a difference (for example, the sum of the value of tickets does not change if they are processed in a different order or with different timings, and the time between values is unlikely to be uniform). Note that by discrete-time we are only referring to the time of the measurements. The value may still be continuous. For example, weight is a continuous value, but we may weigh individual parcels - while the weight of a parcel may be representable to fractions of a gram of weight. If we are between two parcels on a conveyor belt, there is no “current” value for the weight of the parcel at that point. The value could also be discrete. For example, the ticket value would typically be a discrete value (for example, to the nearest cent, or one of a few predefined ticket values).
Compare also: https://en.wikipedia.org/wiki/Discrete_time_and_continuous_time and https://en.wikipedia.org/wiki/Continuous_or_discrete_variable. In practice, all measurements are samples of a continuous-time property.
When dealing with discrete-time inputs, you should use the Discrete Statistics block rather than the Average (Mean) block. While it is possible to connect an input from a parcel weight sensor to the Average (Mean) block, the Average block weights by time. For example:
| Time | Input value | Average of continuous-time input | Average of discrete-time input |
|---|---|---|---|
| 00:10 | 11 | 11 | 11 |
| 00:19 | 9 | 11 | 10 |
| 00:20 | 8 | 10.8 | 9.33 |
Compare this to the table in On-change inputs and time windows, looking at times 00:10 onwards (that is, what would be in a window from 00:10 to 00:20). Note that the continuous-time block would generate a different output if the inputs occurred at different times, while a block averaging values based on discrete-time would not.
Note that by default measurements are treated as continuous-time values. So it is possible, for example, to calculate the difference between two values:
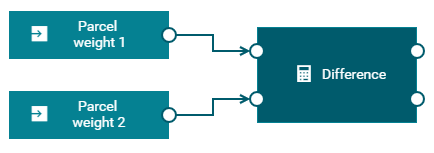
The above example gives the difference between the most recent weight received by two sensors. This may not be a particularly useful distinction if these are genuinely discrete-time inputs. However, it can make sense to compare the difference of averages (or means) between two discrete-time inputs. The Average output port of the Discrete Statistics block gives a continuous-time value:
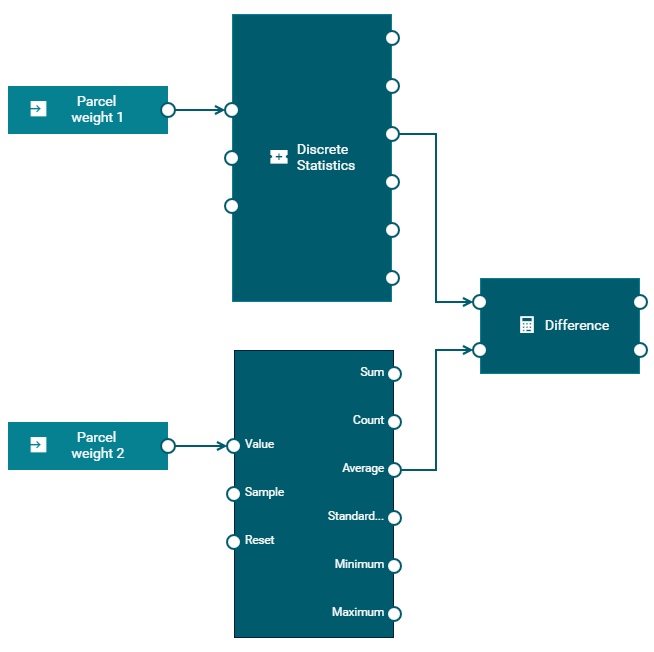
Models and devices
Model execution for different devices
Models are executed independently of each other. That is, models for specific devices can execute in parallel, making use of hardware parallelism where possible, if models are processing data (such as Measurement, Event, or Operation objects) for a different set of devices. When defining a model, you can configure it to use data from a set of specific devices or from a range of devices, with each device being handled independently.
Each model must either:
-
receive input from a set of specific devices and send output to a set of specific devices, or
-
receive input from each device within a range of devices and send output to the trigger device or an asset. Note that asset output can only be used for sending cross-device aggregates.
A range of devices can include a Cumulocity group, an asset, or all input sources on the tenant. When a model uses a range of devices, the model acts on all devices referred to by the range, either directly or indirectly through members of the group that are themselves groups and have device members (or even “grand-children” group members). A device can be a member of zero, one or many groups. For more information, see Grouping devices and Managing assets.
InfoA model that acts on a range of devices only determines the group membership when the model is activated. If the membership of a group changes while a model is running, the model will not behave any differently for any new or removed members of the group. If a group membership is changed, then models that refer to that group should be de-activated and re-activated.
It is not possible to mix the two types of input blocks above (but see Broadcast devices). However, data from a model processing specific devices can be sent to and received from other models, including models for ranges of devices, and vice versa (see Connections between models).
When a model consumes data from a range, the model behaves as if multiple instances of the model are running, as illustrated below, each one processing data from each device independently. Each instance processes data for a different device, but all share the same blocks and block parameters. The values of the wires are independent for different instances. Any blocks that are stateful, such as the Average (Mean) block, operate independently of the data from other devices. As with models using specific devices, if any block causes a runtime error or exception, then the entire model goes into a failed state - it stops processing data for all devices.
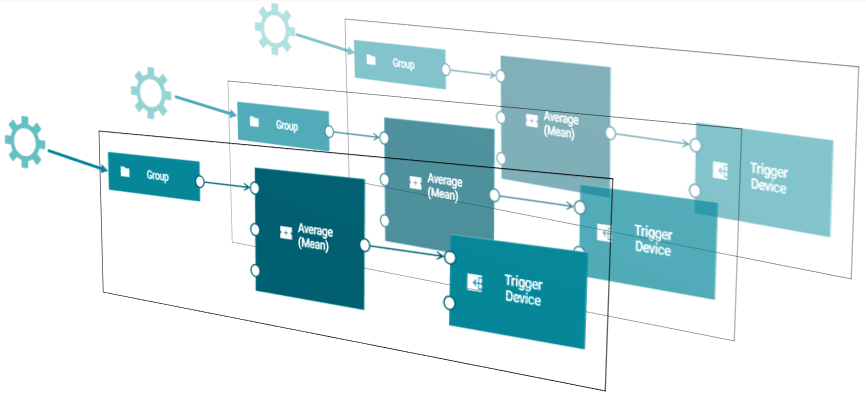
Typically, when using ranges of devices for inputs, all input blocks would use the same group. It is possible to use different groups. If there are devices in one group but not in another, those blocks will never generate a signal for devices that are not in that group. For some blocks, such as the Expression block, this is not useful - an Expression block will only generate an output if all of the required inputs have received a value, but it may be useful for pulse inputs of a Gate block.
When a model has inputs that are consuming data from specific devices, then the output blocks generating outputs can specify the same or different specific devices.
When a model has inputs that are consuming data from a range of devices, all synchronous output blocks must specify the trigger device or asset. The trigger device generates data (Measurement, Event or Operation) for whichever device that instance applies to - or whichever device sent the data to trigger that instance. Asynchronous output blocks in such models can specify the trigger device, asset or any other specific device.
When a model has inputs that are consuming data from each device belonging to an asset, the output blocks can send the output to a specific asset or trigger device. Keep in mind that asset output can only be used for sending cross-device aggregates.
When a template parameter is used for an output block, then if the parameter’s value is a range of devices, then this is treated the same as if it were set to the trigger device. The output goes to whichever device triggered the model’s evaluation, with each device within a range being treated independently. Typically, the same template parameter will be used for both input and output, so these will refer to the same range, and each device is processed independently.
You can use the model editor to change input and output blocks from one input source or output destination to another. When changing between a range of devices and a device or asset, output blocks will switch between the trigger device and the device or asset specified, so that the model is kept in a usable state. See also Replacing sources or destinations.
The test and simulation modes are only permitted for models using specific devices. If you wish to test or simulate a model using a range of devices, then use the model editor to modify it to apply to a single device within the range, and then activate the model in test or simulation mode. See Deploying a model for more information on these modes.
Configuring the concurrency level
By default, the Analytics Builder runtime uses 1 CPU core to execute models. If you want to change the number of CPU cores, send a POST request to Cumulocity that changes the value for the numWorkerThreads key. See Configuration for detailed information.
Typically, this configuration value would be set to the number of CPU cores available for the system, but it may be useful to configure this either higher or lower according to what resources are available. It does not need to scale to the number of devices (that is, it is quite reasonable to have 4 worker threads with hundreds of devices, assuming a moderate event rate per device).
With the concurrency level set to 1, it is still possible to create models which use ranges of devices as inputs, but these continue to operate independently for each device within the range, and it is still not possible to mix range and single device input or output.
Info
Using multiple specific devices in a model with the concurrency level set to more than 1 can lead to connections between models which are deployed across multiple workers. Chains of models using multiple specific devices with high throughput usually scale less well than chains of models all using a single specific device.
Info
The concurrency level has a fix value of 1 for microservices with multi-tenant support.
Broadcast devices
It is sometimes useful to have signals that can apply to all models. These may be signals from devices, or from other systems that are presented as if they were signals from a device. Analytics Builder thus supports devices that are referred to as broadcast devices and signals from these devices are available to all models across all devices.
Broadcast devices can be used as inputs in any model, together with either inputs from a specific device or a range of devices. The diagram below illustrates how a broadcast device applies to all devices within a range of devices. It is possible to combine signals from devices in a range of devices with signals from a broadcast device by providing them as different inputs into a processing block such as the Expression block.
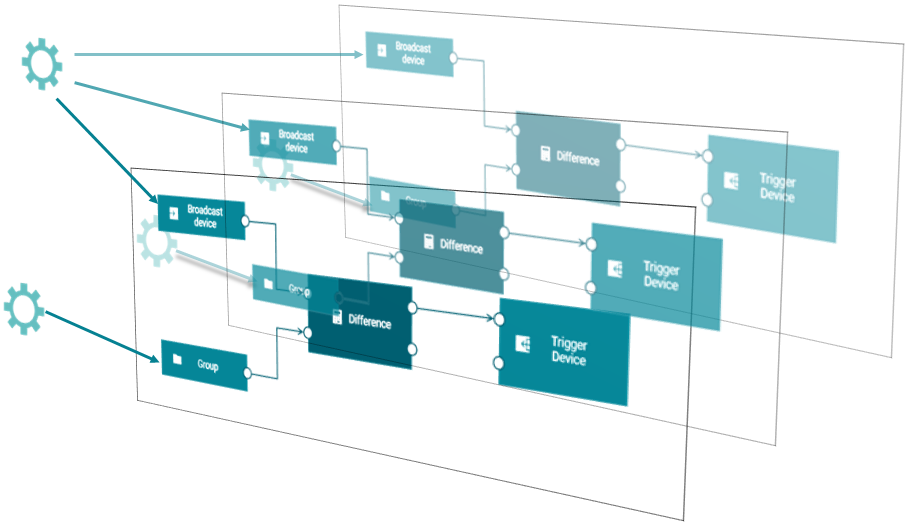
Unlike other devices, a broadcast device can only be used for synchronous output of a model that only consumes data from broadcast devices. Broadcast output of the asynchronous type can be generated by a model consuming non-broadcast inputs.
It is also not possible to connect models together using synchronous data from a broadcast device output (that is, no model may use a measurement from a broadcast device that is the output of a different model). Models can be connected together using asynchronous outputs from a broadcast device (that is, models may use an operation from a broadcast device that is the output of a different model).
Identifying broadcast devices
Broadcast devices are identified by the presence of a property on the device object in the inventory for that device; the presence of either the pas_broadcastDevice or c8y_Kpi property. Thus, whether a device is considered a broadcast device or not is global for that device across all models. It is not permitted to use a range of devices that contains a broadcast device. c8y_Kpi objects are typically used with the KPI block. Thus, it is possible to use a KPI object to compare measurements from a range of devices - one KPI object is used for all devices in the range.
Virtual devices
A virtual device is used when a model is deployed in test or simulation mode. See also Deploying a model.
Virtual devices are objects in the Cumulocity inventory with a c8y_VirtualDevice property. This property refers to the identifier of the real device of which the virtual device is a copy.
Use the creationDate to find out what virtualDevice was created for a model activation and which measurements have that device as their source.
By default, the virtual devices are kept for 30 days. If you want to change this default, you must change the tenant options. That is, you must send a POST /tenant/options request. For detailed information, see the information on the tenant options in the Cumulocity OpenAPI Specification. For example, specify the following to set the retention period for the virtual devices to 1 day:
{
    "category": "analytics.builder",
    "key": "retention.virtualDevicesMaxDays",
    "value": "1"
}
See also Configuration.
Virtual devices are not shown in the Device Management application. Use REST operations to find these entries.
Connections between models
You can connect multiple models together using output blocks and input blocks. A model that contains an output block such as Measurement Output (for Measurement objects of Cumulocity) will generate a series of events, and this can be consumed by a suitable input block (such as Measurement Input) in another model. For more details, see Keys for identifying a series of events.
When models are connected together using inputs and outputs for the same stream of events, the term “chain” is used to refer to all of the models that are connected to each other in this way. There may be multiple chains if there are separate groups of models that are connected to each other.
Info
The events from one model can only be consumed by another model when all involved models are deployed in production mode. When the models are deployed in test or simulation mode, virtual devices are used and the events from one model can therefore not be consumed by another model.
When one model has a synchronous output block generating a series of events for a given key and a second model has an input block consuming from that same series of events (that is, with the same key parameters), then this forms a connection from the first model to the second. When the first model triggers the output block, this causes the second model to be evaluated with a new input on its input block.
It is also possible to form connections between models using the output from an asynchronous output block. In this case, when the first model triggers the asynchronous output block, the output is generated and sent to the external system (such as Cumulocity). The data is received back from the external system at some later point in time and causes the evaluation of any other models consuming the data.
Similar to the processing order of wires within a model (see also Processing order of wires), the following applies when an output block in one model generates a series of events that an input block in another model consumes:
-
A single model can send the same events to more than one other model. This means, it is possible to have a single model perform some common pre-processing, such as unit conversion or calculating an average (with the Average (Mean) block), and that value to be used by multiple other models.
-
Models are executed in order with respect to the connections between models formed using synchronous output so that the source of a connection is always evaluated before the target of a connection. If a model has connections from multiple blocks all triggered from the same initial event, then they will all evaluate first, and the receiving model will evaluate with all of the inputs once.
Connections formed using asynchronous output do not have a specific execution order. A model consuming the output is executed only when the output is received back from the external system.
Similar to the wire restrictions within a model (see also Wire restrictions), there are restrictions on how output blocks and input blocks can be used to connect models together:
-
One block across all models is permitted to generate a series of synchronous events for a given key. See also Keys for identifying a series of events. Multiple output blocks generating asynchronous events can be used within a single model or across multiple models.
-
No cycles can be created between models using synchronous output. A model that receives events via an input block synchronously generated from another model cannot include an output block that generates synchronous events that the other model would consume. This applies even if one of the models contains two separate parts, such that there is no actual cycle in terms of wires and connections between models. Cycles among models can be created because of asynchronous outputs. Therefore, care must be taken not to introduce indefinite cyclic executions of models.
Any model that does not meet these restrictions when used in combination with the already activated models will cause an error on trying to activate it. This will count for the last element in a cycle of models. For such errors, the problem may be in interactions between models rather than a problem specific to a single model, but existing models that have already been activated will not automatically be deactivated. For example, if multiple models all generate the same series of synchronous events (with the same key), then the first model to be activated can be deployed, but all subsequent models will report an error upon trying to activate them.
For example, there are three models: Model1, Model2, and Model3. A cycle may exist if:
- An output block of Model1 produces a series of synchronous events that is consumed by an input block in Model2, and Model2 contains an output block that generates a second series of synchronous events, and
- Model3 contains an input block that consumes a series of events from Model2, and Model3 also contains an output block that generates a series of synchronous events used by an input block in Model1.
Note that only activating any two of these models can be done without error. If activated in order, only Model3 would have an error. But if Model1 or Model2 were deactivated, then Model3 could be activated. The error will occur even if one of the models does not contain a link from the input block that is part of the chain to the output block that forms part of the chain, such as the example for Model3 below: the events from Model2 do not form a cycle to the To Model1 Measurement output block, but they count as a cycle as they are both in the same model. (In this case, the issue could be resolved by splitting that model into two models, thus removing the cycle).
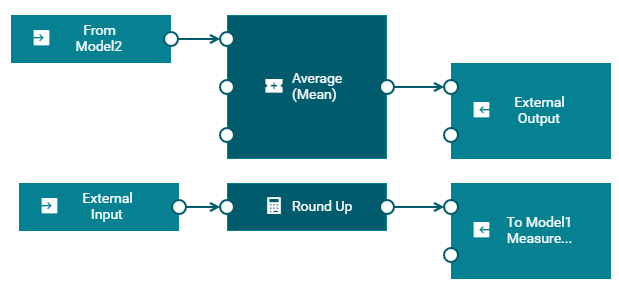
Info
Using multiple specific devices in a model with the concurrency level set to more than 1 can lead to connections between models which are deployed across multiple workers. Chains of models using multiple specific devices with high throughput usually scale less well than chains of models all using a single specific device.
Configuring the number of shown input sources and output destinations
By default, a maximum of 10 items are shown in the following cases:
- When you select a different input source or output destination (see Editing the parameters of a block).
- When you replace devices, groups or assets (see Replacing sources or destinations).
When you use the search box in the above cases, this default also applies to the maximum number of items that are shown in the search result. When you click Load more, up to 10 more items are shown.
If you want to change this default value (to show either more or less items), you must change the tenant options. That is, you must send a POST /tenant/options request. For detailed information, see the information on the tenant options in the Cumulocity OpenAPI Specification.
For example, specify the following to set the value to 20:
{
    "category": "analytics.builder",
    "key": "c8yAnalyticsBlocks.queryInventoryPageSize",
    "value": "20"
}
See also Configuration.
Searching for devices, groups and/or assets
By default, only devices, groups and assets are shown in the following cases:
- When you select a different input source or output destination (see Editing the parameters of a block).
- When you replace devices or groups (see Replacing sources or destinations).
When you use the search box in the above cases, all managed objects in the Cumulocity inventory which match the search and filter criteria are shown, grouped by type. You can thus build analytic models by defining any managed objects in the inventory as input blocks or output blocks.
If you want to restrict the search to show only managed objects of a specific type (for example, to show only devices), you must change the tenant options. That is, you must send a POST /tenant/options request. For detailed information, see the information on the tenant options in the Cumulocity OpenAPI Specification.
For example, specify the following if you only want to show devices:
{
    "category": "analytics.builder",
    "key": "c8yAnalyticsBlocks.queryInventoryNameSearchAdditionalFilter",
    "value": "has(c8y_IsDevice)"
}
The c8y_IsDevice in the value is a so-called fragment. You can specify any fragment that is known to Cumulocity, including any fragments that you have created yourself.
You can combine several values. For example, specify the following if you only want to show devices and groups:
{
    "category": "analytics.builder",
    "key": "c8yAnalyticsBlocks.queryInventoryNameSearchAdditionalFilter",
    "value": "has(c8y_IsDevice) or has(c8y_IsDeviceGroup)"
}
The default value of this tenant option is not has(c8y_IsVirtualDevice). As long as you do not change this tenant option, virtual devices are not shown as they would not make sense in an analytic model. If you change the value for this tenant option, make sure to specify all managed objects that you want to see in the search result.
See also Configuration.
Support for dynamic changes to group and asset hierarchy
By default, input blocks in Analytics Builder now support dynamic changes to the group hierarchy. This includes the addition, deletion, and update of devices or assets, as well as structural changes within groups. Analytics Builder models automatically adapt to these changes, processing data based on the most current group or asset hierarchy.
Info
This is also applicable to the Smart rules plugin.
Key behavior and limitations
- Deletion of source/target: If a specific device, group, or asset configured as an input or output in the model is deleted, the deployed model will automatically transition to a FAILED state.
- Empty groups: If a monitored group becomes empty, the model remains in the ACTIVE state. It will resume processing data as soon as a new device, group, or asset is added to the group.
- Nested & cascaded deletions: Dynamic detection does not support the deletion of nested groups or the cascaded deletion of devices. In these scenarios, the model must be undeployed and redeployed to recognize the updated hierarchy.
To enable this behavior for custom blocks, refer to the Analytics Builder Block SDK documentation.
Model simulation
About simulation mode
You can deploy a model in simulation mode to run it against historical input data (such as Cumulocity measurements). This allows testing the behavior of a newly developed model against historical data or fine-tuning an existing model. Or it allows testing a model against a set of historical data with known properties.
You use the model manager to deploy a model in simulation mode. See Deploying a model for more details.
Info
Simulation mode is only permitted for models using specific devices. If you wish to simulate a model using a range of devices, then use the model editor to modify it to apply to a single device within the range, and then activate the model in simulation mode.
When a model is deployed in simulation mode, it uses data from a virtual device (see also Virtual devices). Thus, a simulated model can run alongside other non-simulated models without interfering with them.
A simulated model runs as if it is running at the time of the historical data. The input data are processed in the order of their historical time. The simulated model also uses the historical time for the timestamps of the generated output.
Events, alarms and operations are created with a timestamp. However, with time there can be updates to these objects. For example, an alarm can be cleared or the status of an operation can be changed. As a history of changes to event, alarm and operation objects is not maintained, the object is only replayed at its initial timestamp, with the latest version of its properties. Thus, changes to these objects are not replayed and simulation mode is of limited use if your models depend on changes to objects.
Info
Simulation mode is not permitted for models with Managed Object Input blocks.
When running a simulation, historical data is replayed into the Apama correlator from the Cumulocity database. If there is a significant delay in the data being queried from the database or high load in the system, this can lead to dropping the input in exceptional circumstances. A simulated model processes input data at normal speed. For example, if the historical data entries are separated by one second, they are processed one second apart. This means that simulating a model with one hour of historical data will take approximately one hour of simulation time.
Simulation parameters
To deploy a model in simulation mode, you must provide values for two parameters in the model manager: start time and end time. These values determine the time range for which historical data is to be sent into the simulated model.
- The start time from which historical data is to be sent into the model.
- The end time until which historical data is to be sent into the model.
Sending of data into the simulated model is stopped when all historical data from the specified time range has been sent.
Configuring the maximum number of simulation models
By default, a maximum of 3 simulation models can be deployed at a time.
If you want to change this default value (to deploy either more or fewer simulation models at a time), you must change the tenant options. That is, you must send a POST /tenant/options request. For detailed information, see the information on the tenant options in the Cumulocity OpenAPI Specification.
For example, specify the following to set the value to 5:
{
    "category": "analytics.builder",
    "key": "simulation.maxInstances",
    "value": "5"
}
See also Configuration.
Monitoring dropped inputs
The simulated model may drop delayed input events in exceptional cases. Alarms are periodically raised with the number of input events dropped across all the models. See also Monitoring dropped events.
Monitoring and configuration
Monitoring
You can monitor the current status of each model in the model manager. The card for a model shows the current mode for this model (such as production mode) and whether it is active (deployed) or inactive.
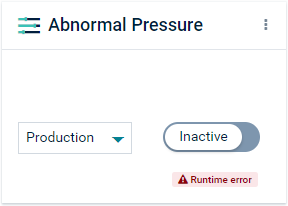
If a model failed to deploy or failed while running, a runtime error icon is shown on the card for the model.
To find out whether a model has failed while processing data, reload all models in the model manager to show their latest states. See also Reloading all models.
Monitoring periodic status
In addition to the status that is shown on the card for a model, it is possible to enable generation of periodic status published as Cumulocity operations or events. See Configuration on setting the status_device_name and status_period_secs tenant options.
Each operation has the following parameters:
| Parameter | Description |
|---|---|
models_running |
Information about deployed models that are running. |
models_failed |
Information about deployed models that have failed. |
chain_diagnostics |
Information about model chains. See Connections between models for more information. |
apama_status |
The Apama correlator status metrics. Many status names correspond to the key names in the Apama REST API. The values are returned by the getValues() action of the com.apama.correlator.EngineStatus event and exposed via the REST API. |
Model status
The following information is published for each deployed model that is currently running or has failed:
| Name | Description |
|---|---|
mode |
The mode of the deployed model. It is SIMULATION for models deployed in simulation mode. Otherwise, it is PRODUCTION. |
modeProperties |
Any mode-specific properties of the model. This includes the start and end time of the simulation for models running in the SIMULATION mode. |
numModelEvaluations |
The total number of times the model has been evaluated since it was deployed. |
numBlockEvaluations |
The total number of times that the blocks have been evaluated in the model since it was deployed. This is the sum of the count of evaluation for each block in the model. |
avgBlockEvaluations |
The average number of blocks that have been evaluated per model evaluation. |
numOutputGenerated |
The total number of outputs generated by the model since it was deployed. |
This information about each model provides insight into the performance or working of models. For example, a model with a much larger number of numBlockEvaluations than another model might indicate that it is consuming most resources even though it might have low numModelEvaluations. Similarly, it can be used to find out whether a model is producing output at the expected rate relative to the number of times it is evaluated.
You can monitor the status using the Apama REST API or the Management interface which is an EPL plug-in. See the following topics in the Apama product documentation for further information:
Chain diagnostics
The following information is published for all chains that are present:
| Name | Description |
|---|---|
creationTime |
The time when this chain was created. |
executionCount |
The number of times the chain was evaluated. (1) |
modelsInEvalOrder |
A list of model identifiers in the order in which the models were evaluated. |
pendingTimersCount |
The number of pending timers which are behind the current time. |
maxTime |
The maximum time taken to evaluate the chain. (1) |
minTime |
The minimum time taken to evaluate the chain. (1) |
meanTime |
The mean time taken to evaluate the chain. (1) |
execBucket |
The execution time statistics of the chain. (1), (2) |
(1) The fields are updated if the chain is evaluated fully or partially. Partial evaluation of a chain means that only some models of the chain are evaluated.
(2) There are 21 buckets which store the number of times when the execution time falls within the bucket range. Each bucket has size of timedelay_secs divided by 10 seconds, except for the last bucket which stretches to infinity. For example, if timedelay_secs is 2 seconds, then the first bucket holds the number of times when the chain execution took up to 0.2 seconds, the second bucket holds the number of times when the chain execution took more than 0.2 seconds but up to 0.4 seconds, and so on. See also the following example:
| Bucket | Execution time range |
|---|---|
| 1 | 0 - 0.2 |
| 2 | 0.2 - 0.4 |
| 3 | 0.4 - 0.6 |
| … | … |
| 20 | 3.8 - 4.0 |
| 21 | 4.0 - infinity |
For more information on timedelay_secs, see Keys for model timeouts.
Slowest chain status
When chains of models with a high throughput are deployed across multiple workers, it may happen that the chain falls behind in processing input events, creating a backlog of input events that are still to be processed. These chains are referred to as “slow chains”. A message is written to the correlator log if the slowest chain is delayed by more than 1 second. For example: “Analytics Builder chain of models “Model 1”, “Model 2”, “Model 3” is slow by 3 seconds.” See Log files of the Apama-ctrl microservice for information on where to find the log.
The following information on the slowest chain is also available in the periodic status that is published as Cumulocity operations or events, within the apama_status parameter:
| Name | Description |
|---|---|
user-analyticsbuilder.slowestChain.models |
All models contained in the slowest chain. |
user-analyticsbuilder.slowestChain.delaySec |
The number of seconds the chain lags behind in processing the input events. |
Example
The following is an example of the status operation data that is published by Cumulocity:
{
    "creationTime": "2021-01-05T21:48:54.620+02:00",
    "deviceId": "6518",
    "deviceName": "apama_status",
    "id": "8579",
    "self": "https://myown.iot.com/devicecontrol/operations/8579",
    "status": "PENDING",
    "models_running": {
        "Package Tracking": {
            "mode": "SIMULATION",
            "modeProperties":{"startTime":1533160604, "endTime":1533160614},
            "numModelEvaluations": 68,
            "numBlockEvaluations": 967,
            "avgBlockEvaluations": 14.2,
            "numOutputGenerated": 50
        }
    },
    "models_failed": {
        "Build Pipeline ": {
            "mode": "PRODUCTION",
            "numModelEvaluations": 214,
            "numBlockEvaluations": 671,
            "avgBlockEvaluations": 3.13,
            "numOutputGenerated": 4
        }
    },
    "chain_diagnostics": {
        "780858_780858": {
            "creationTime": 1600252455.164188,
            "executionCount": 4,
            "modelsInEvalOrder": ["780858_780858", "780860_780860"],
            "pendingTimersCount": 1,
            "timeData": {
                "execBucket": [2,1,0,1,0,0,0,0,0,0,0,0,0,0,0,0,0,0,0,0,0],
                "maxTime": 0.00014781951904296875,
                "meanTime": 0.0001152356465657552,
                "minTime": 6.29425048828125e-05
            }
        }
    },
    "apama_status": {
        "user-analyticsbuilder.slowestChain.models": "\"Model 1\", \"Model 2\", \"Model 3\"",
        "user-analyticsbuilder.slowestChain.delaySec": "3",
        "numJavaApplications": "1",
        "numMonitors": "27",
        "user-httpServer.eventsTowardsHost": "1646",
        "numFastTracked": "183",
        "user-httpServer.authenticationFailures": "4",
        "numContexts": "5",
        "slowestReceiverQueueSize": "0",
        "numQueuedFastTrack": "0",
        "mostBackedUpInputContext": "<none>",
        "user-httpServer.failedRequests": "4",
        "slowestReceiver": "<none>",
        "numInputQueuedInput": "0",
        "user-httpServer.staticFileRequests": "0",
        "numReceived": "1690",
        "user-httpServer.failedRequests.marginal": "1",
        "numEmits": "1687",
        "numOutEventsUnAcked": "1",
        "user-httpServer.authenticationFailures.marginal": "1",
        "user-httpServer.status": "ONLINE",
        "numProcesses": "48",
        "numEventTypes": "228",
        "virtualMemorySize": "3177968",
        "numQueuedInput": "0",
        "numConsumers": "3",
        "numOutEventsQueued": "1",
        "uptime": "1383561",
        "numListeners": "207",
        "numOutEventsSent": "1686",
        "mostBackedUpICQueueSize": "0",
        "numSnapshots": "0",
        "mostBackedUpICLatency": "0",
        "numProcessed": "1940",
        "numSubListeners": "207"
    }
}
Monitoring dropped events
When a model receives an event, it may be dropped if the correlator delivers or processes it too late. See Input blocks and event timing. Alarms are periodically raised with the total number of dropped events and a sample of the last dropped event. See Analytics Builder dropped events for information on alarms.
All dropped input events are also sent to channel AnalyticsDroppedEvents, allowing you to implement your own monitoring of the dropped events. A dropped input event sent to the channel AnalyticsDroppedEvents is packaged inside an event of type apama.analyticsbuilder.DroppedEvent. This allows you to extract the original dropped event and perform any analysis on it, for example, categorizing the number of dropped events per device. This can be achieved by writing EPL that listens for the DroppedEvent events, aggregates by device identifier and/or time, and sends measurements to Cumulocity that can be monitored. See also Deploying apps.
Monitoring the model lifecycle
Life-cycle messages are written to the correlator log whenever a model is created or deleted, or when it fails. The log messages may look as follows:
Model "Build Pipeline" with PRODUCTION mode has started.

Model "Build Pipeline" with PRODUCTION mode has ended.

Model "Build Pipeline" with PRODUCTION mode has failed with an error:
IllegalArgumentException - Error while validating parameters for the
block "toggle" of type "apama.analyticskit.blocks.core.Toggle":
The "Set Delay" must be finite and positive: -1.
Deploying a model can combine existing models or chains to form a new chain. The formation of a chain may take a while to complete as it may combine multiple existing models and chains. Activation messages are written to the correlator log whenever the activation of a chain is started and completed. For example:
Analytics Builder chain of models "Model 1", "Model 2", "Model 3" is being activated.
Analytics Builder chain of models "Model 1", "Model 2", "Model 3" has been activated.
See Log files of the Apama-ctrl microservice for information on where to find the log.
Configuration
You can customize the settings of Analytics Builder, the so-called “tenant options”, by sending REST requests to Cumulocity. The key names that you can use with the REST requests are listed in the topics below. A category name is needed along with the key name; this is always analytics.builder.
You can find some concrete examples in Using curl commands for setting various tenant options. However, you can use any tool you like.
To change the tenant options, you need ADMIN permission for “Option management”. See Managing permissions and roles for more information.
Caution
After you have changed a tenant option using a REST request, the correlator will automatically restart. An alarm with a MAJOR severity will be created in this case; you can view it on the Alarms page of the Cockpit application (see Working with alarms for more information).
Keys for status reporting
| Key name | Description |
|---|---|
status_device_name |
The name of the Cumulocity device to which the status operations are to be published. The default name is apama_status. |
status_period_secs |
The frequency in seconds at which the status is to be published. The default value is 0 seconds, meaning that status reporting is disabled. You can enable status reporting by setting the frequency to a positive value. |
status_send_type |
How the status is to be published. The default value is OPERATION, meaning that the status is published as a Cumulocity operation. You can change this to one of the following values:
|
status_send_keys |
A comma-separated list of field names to be used when publishing the status. If not set or empty, the status for all fields is published. For example, if you specify the following, then the status includes only the values for these fields in one measurement.numQueuedInput,numListeners,numMonitors |
status_event_type |
The event type if the status is published as a Cumulocity event, or the measurement type if the status is published as a Cumulocity measurement. The default type is apama_status. |
status_event_text |
The event text if the status is published as a Cumulocity event. The default text is Apama Status. |
Keys for model timeouts
| Key name | Description |
|---|---|
timedelay_secs |
The maximum delay in seconds before the input block considers an event to be old. The default value is 1 second. See also Input blocks and event timing. |
logging_throttle_secs |
Logging throttling in seconds. Periodic log messages (for example, those reporting changes in the number of events being dropped by the input block) will not appear more frequently than defined by this constant. The default value is 1 second. See also Input blocks and event timing. |
minimum_wait_time_secs |
The minimum wait time in seconds. Some blocks can generate output automatically, based on the rate of change of the output. This sets a lower limit on the time between such outputs. See also Common block inputs and parameters. |
Keys for simulation mode
| Key name | Description |
|---|---|
simulation.maxInstances |
The maximum number of simulation models to be deployed at a time. The default value is 3 models. See also Configuring the maximum number of simulation models. |
Other keys
| Key name | Description |
|---|---|
numWorkerThreads |
The number of worker threads. The per-tenant microservice defaults to 1 AB worker per core. For example, the apama-ctrl-2c-8g variant will have 2 worker threads. The multi-tenant microservice defaults to 1 worker thread per tenant.See also Configuring the concurrency level. Note that the number of worker threads cannot be changed for the microservice with multi-tenant support. |
retention.virtualDevicesMaxDays |
The retention period in days for keeping virtual devices. The default value is 30 days. See also Virtual devices. |
c8yAnalyticsBlocks.queryInventoryPageSize |
The number of items that are shown in the Select Input Source and Select Output Destination dialog boxes. The default value is 10. See also Configuring the number of shown input sources and output destinations. |
c8yAnalyticsBlocks.queryInventoryNameSearchAdditionalFilter |
The managed objects that are shown when you use the search box and filter checkboxes of the Select Input Source or Select Output Destination dialog box. See also Searching for devices, groups and/or assets. |
Logged tenant options
The values for some of the tenant options are logged. These are the following:
status_device_namestatus_period_secstimedelay_secsnumWorkerThreads
If you want to find out which values are currently used for these tenant options, you can look them up in the log. See also Log files of the Apama-ctrl microservice.
Using curl commands for setting various tenant options
You can set or change various tenant options by sending POST requests to Cumulocity. This topic explains how you can do this using the curl command-line tool. See https://curl.se/ for detailed information on curl. See also the information on the tenant options in the Cumulocity OpenAPI Specification.
The syntax of the curl command depends on the environment in which you are working. The syntax for a Bash UNIX shell, for example, is as follows:
curl --user username -X POST -H 'Content-Type: application/json' -d '{"category": "analytics.builder", "key": "keyname", "value": "value"}' -k https://hostname/tenant/options
where:
-
usernameis the name of a user who has ADMIN permission for “Option management” in Cumulocity. curl will prompt for a password. Or you can provide a password in theusernameargument by appending it with a colon (:) and the password. For example:--user User123:secretpwIf your tenant does not have its own unique host name, you must provide the tenant identifier in the
usernameargument. For example:--user management/User123or
--user t12345/User123 -
keynameis one of the keys listed in the previous topics. -
valueis the value that is to be set for the key, which can be a number or a string, depending on the key. -
hostnameis the host name of your tenant where your user application is deployed. -
The
categoryis alwaysanalytics.builder.
Example (Bash shell):
curl --user User123 -X POST -H 'Content-Type: application/json' -d '{"category": "analytics.builder", "key": "numWorkerThreads", "value": "4"}' -k https://mytenant/tenant/options