Troubleshooting and diagnostics
If you have the Apama-ctrl-smartrules or Apama-ctrl-smartrulesmt microservice, most of the functionality described in this topic does not apply.
If you have the Apama-ctrl-smartrules or Apama-ctrl-smartrulesmt microservice, most of the functionality described in this topic does not apply.
To download diagnostics information, you need READ permission for “CEP management”. See Managing permissions and roles for more information.
If you have READ permission for “CEP management”, links for downloading diagnostics information are available when you click the User button in the Streaming Analytics application. This opens the right drawer which contains a Diagnostics section with the following links:
It may be useful to capture this diagnostics information when experiencing problems, or for debugging EPL apps. It is also useful to provide to product support if you are filing a support ticket. You can find the tenant ID in the Platform info section of the right drawer. If you want to find out the version numbers of the different components on your tenant, click the Download platform details button in the Platform info section and then open the downloaded JSON file. See User options and settings for more details.
Basic diagnostics information is provided in a ZIP file named diagnostic-overview<timestamp>.zip and includes the following information:
The microservice log file contents, if available, including a record of the correlator’s startup logging and the last hour or maximum of 20,000 lines of logging.
Apama-internal diagnostics information (similar to the engine_watch and engine_inspect command-line tools available in Apama).
A copy of all EPL apps, smart rules and analytic models.
A copy of any alarms that the Apama-ctrl microservice has raised.
CPU profiling (over a duration of 5 seconds).
EPL memory profiler snapshots.
Some information from the environment (tenant details, environment variables).
Version information for the components.
Enhanced diagnostics information is provided in a ZIP file named diagnostic-enhanced<timestamp>.zip and includes the following information:
What you can see or do depends on your permissions:
There are two ways to get the logs of the Apama-ctrl microservice:
The correlator log is embedded in the log file of the Apama-ctrl microservice. See also Descriptions of correlator status log fields in the Apama documentation.
Contact product support if needed.
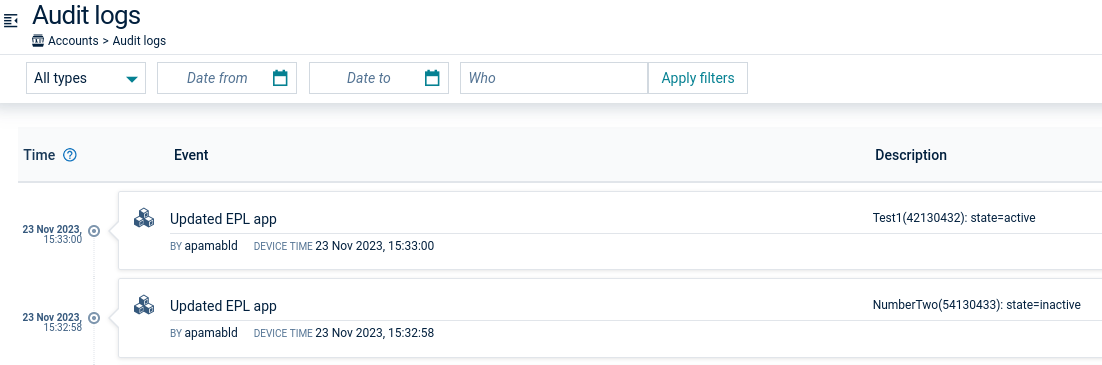
Activation and deactivation of analytic models and EPL apps is shown in the audit logs. The audit logs are accessible via the Administration application and the audit API. See Audit logs and Audit API in the Cumulocity OpenAPI Specification for details of accessing the audit logs.
Audit log entries include the current action and the name of the user performing that action. For example:
The following diagnostics endpoints are available for REST requests. These require authentication as a user with READ permission for “CEP management”:
/service/cep/diagnostics/metrics/service/cep/diagnostics/overview/service/cep/diagnostics/enhanced/service/cep/diagnostics/request/service/cep/diagnostics/correlator/infoengine_inspect information.The following monitoring endpoints are available for REST requests. These require authentication as a valid user, but do not require any special roles.
/service/cep/health
GET only. JSON.
Obtains information on whether the Apama-ctrl microservice is up or not.
/service/cep/prometheus
GET only. Plain text format.
Prometheus metrics from the correlator and microservice. For details, see Monitoring with Prometheus in the Apama documentation.
Alarms are created by user applications in the Cumulocity tenant (for example, by an analytic model, an activated EPL file, or a smart rule). To learn about alarms in general, refer to Working with alarms. The Apama-ctrl microservice also generates alarms because it has encountered some problem, so that the user is notified about the situation. The information below is about alarms that are generated by the Apama-ctrl microservice, their causes, consequences and possible ways to resolve them.
You can view alarms in the following ways:
| Severity | Description |
|---|---|
| CRITICAL | Apama-ctrl was unable to continue running the user’s applications and will require corrective action. |
| MAJOR | Apama-ctrl has encountered a situation that will result in some loss of service (for example, due to a restart). |
| MINOR | Apama-ctrl has a problem that you might want to fix. |
| WARNING | There is a warning. |
Apama-ctrl can create alarms to notify users in scenarios such as the correlator running out of memory, uncaught exceptions in activated EPL files, and so on. Once you see an alarm in the Cumulocity tenant, you should diagnose it and resolve it depending on the severity level of the raised alarm. Each alarm has details such as title, text, type, date, and count (represents the number of times the alarm has been raised).
The following is a list of the alarms. The information further down below explains when these alarms will occur, their consequences, and how to resolve them.
Once the cause of an alarm is resolved, you must acknowledge and clear the alarm in the Cumulocity tenant. Otherwise, you will continue to see the alarm until a further restart of the Apama-ctrl microservice.
This alarm is raised when a tenant option changes in the analytics.builder or streaminganalytics category. For details on the tenant options, refer to the Tenant API in the Cumulocity OpenAPI Specification for more details.
tenant_option_changeAnalytics Builder allows you to configure its settings by changing the tenant options, using key names such as numWorkerThreads or status_device_name. For example, if you want to process things in parallel, you can set numWorkerThreads to 3 by sending a REST request to Cumulocity, which will update the tenant option. Such a change automatically restarts the Apama-ctrl microservice. To notify the users about the restart, Apama-ctrl raises an alarm, saying that changes have been detected in a tenant option and that Apama-ctrl will restart in order to use it.
Once you see this alarm, you can be sure that your change is effective.
This alarm is raised whenever the Apama-ctrl microservice switches to safe mode.
apama_safe_modeApama-ctrl detects if it has been repeatedly restarting and if user assets (EPL apps, analytic models, extensions) have been modified recently. Apama-ctrl disables all user assets as a precaution. Potential causes are, for example, an EPL app that consumes more memory than is available or an extension containing bugs.
You can check the mode of the microservice (either normal or safe mode) by making a REST request to service/cep/diagnostics/apamaCtrlStatus, which contains a safe_mode flag in its response.
To diagnose the cause of an unexpected restart, you can try the following:
Check the EPL apps memory profiler by making a REST request to /service/cep/diagnostics/eplMemoryProfiler for any memory leaks. Note that you must re-activate the EPL apps that were active before as the Apama-ctrl microservice loses information about the previous microservice instance when it restarts due to safe mode. To replicate the previous scenario, run the EPL apps and process some events to trigger a leak and then use the memory profiler to check for any memory leaks.
Check the microservice logs for any exceptions by downloading the basic diagnostics ZIP file as described in Downloading diagnostics and logs. In the downloaded ZIP file, you can find the logs under /diagnostics/. As mentioned in the above point, re-activate the EPL apps and analytic models that were active before and then check the logs.
Check the audit logs. The audit logs are accessible via the Administration application and the audit API. See Audit logs and Audit API in the Cumulocity OpenAPI Specification for details of accessing the audit logs.
In safe mode, all previously active analytic models and EPL apps are deactivated and must be manually re-activated.
This alarm is raised when Apama-ctrl switches from the fully capable microservice to the Apama-ctrl-starter microservice with more than 3 active models.
apama_ctrl_starterWith the Apama-ctrl-starter microservice, a user can have a maximum of 3 active models. For example, a user is working with the fully capable Apama-ctrl microservice and has 5 active models, and then switches to Apama-ctrl-starter. Since Apama-ctrl-starter does not allow more than 3 active models, it deactivates all the active models (5) and raises an alarm to notify the user.
This alarm is raised whenever the Apama-ctrl microservice consumes 90% of the maximum memory permitted for the microservice container. During this time, the Apama-ctrl microservice automatically generates the basic diagnostics ZIP file which contains diagnostics information used for identifying the most likely cause for memory consumption.
There are 3 variants of this alarm, depending on the time and count restrictions of the generated basic diagnostics ZIP file.
First variant:
apama_highmemoryusageSecond variant:
apama_highmemoryusageThird variant:
apama_highmemoryusageRunning EPL apps (and to a lesser extent, smart rules and analytic models) consumes memory, the amount will depend a lot on the nature of the app running. The memory usage should be approximately constant for a given set of apps, but it is possible to create a “memory leak”, particularly in an EPL file or a custom block. The Apama-ctrl microservice monitors memory and raises an alarm with WARNING severity if the 90% memory limit is reached along with the basic diagnostics ZIP file and saves it to the files repository (as mentioned in the alarm text).
Apama-ctrl generates the basic diagnostics ZIP files with the following conditions:
To diagnose high-memory-consuming models and EPL apps, you can try the following (it could be listener leaks, excessive state being stored or spawned monitors leaking, and so on):
Download the automatically generated basic diagnostics ZIP file (refer to the alarm text for its location) and look at correlator/inspect.json and correlator/status.json for the number of listeners. This number may be large in the case of a listener leak. Note that this ZIP file includes the EPL memory profiler snapshots.
Download the diagnostics information from the Streaming Analytics application. Click the User button to display the right drawer and then click one of the links in the Diagnostics section (as described in Downloading diagnostics and logs). The EPL memory profiler from the Basic diagnostics (ZIP) link in /diagnostics/eplMemoryProfiler.csv gives the memory consumed by each monitor along with details such as the number of listeners or the number of monitor instances running something like shown in the snippet below. This can help you to understand which monitor is consuming more memory and try to reduce it.
| Monitor | Monitor instances | EPL objects | Listeners | Bytes | Overhead bytes |
|---|---|---|---|---|---|
| mon1 | 1 | 5384 | 4 | 1073908 | 383240 |
| mon2 | 1 | 2 | 2 | 696 | 2280 |
| mon3 | 1 | 4 | 1 | 840 | 752 |
When using the Enhanced diagnostics (ZIP) link in the Streaming Analytics application, the diagnostics information includes, in addition to the information that you get with the Basic diagnostics (ZIP) link, requests that are more resource-intensive and may significantly slow down the correlator. This includes the contents of the queues. So when diagnosing the cause for the first time, it is recommended to use the ZIP file from the Basic diagnostics (ZIP) link, unless additional information is required.
Also check for memory usage on all the input and output queues available from the Enhanced diagnostics (ZIP) link in /diagnostics/toStringQueues.txt.
If the memory continues to grow, then when it reaches the limit, the correlator will run out of memory and Apama-ctrl will shut down. To prevent the microservice from going down, you must fix this as a priority.
See also Diagnostic tools for Apama in Cumulocity in the Cumulocity Tech Community.
This alarm is raised whenever messages are logged by EPL files with specific log levels (including CRITICAL, FATAL, ERROR and WARNING).
The Streaming Analytics application allows you to deploy EPL files to the correlator. The Apama-ctrl microservice analyzes logged content in the EPL files and raises an alarm for specific log levels with details such as monitor name, log text and alarm type (either of WARNING or MAJOR), based on the log level.
For example, the following is a simple monitor which prints a sequence and logs some texts at different EPL log levels.
monitor Sample{
   action onload() {
      log "Info"; // default log level is now INFO
      log "Fatal Error" at FATAL; // log level is FATAL
      log "Critical Error" at CRIT; // log level is CRITICAL
      log "Warning" at WARN; // log level is WARNING
   }
}
Apama-ctrl analyzes all the log messages, filters out only certain log messages, and raises an alarm for the identified ones. Thus, Apama-ctrl generates the following three alarms for the above example:
First alarm:
APAMA_CTRL_FATAL_<HASHCODE>Second alarm:
APAMA_CTRL_CRIT_<HASHCODE>Third alarm:
APAMA_CTRL_WARN_<HASHCODE>You have seen that the Apama-ctrl microservice raises alarms for logged messages. In addition, there can also be uncaught exceptions (during runtime). Apama-ctrl identifies such exceptions and raises alarms so that you can identify and fix the problem.
For example, the following monitor throws IndexOutOfBoundsException during runtime:
monitor Sample{
   sequence<string> values := ["10", "20", "30"];
   action onload() {
      // IndexOutOfBoundsException (runtime error)
      log "Value = " + values[10] at ERROR;
   }
}
Apama-ctrl generates the following alarm for the above example:
APAMA_CTRL_ERROR_<HASHCODE>You can diagnose the issue by the monitor name and line number given in the alarm.
For more details, you can also check the log files of the Apama-ctrl microservice if the tenant has the “microservice hosting” feature enabled. Alarms of this type should be fixed as a priority as these uncaught exceptions will terminate the execution of that monitor instance, which will typically mean that your app is not going to function correctly. This might even lead to a correlator crash if not handled properly. See also Log files of the Apama-ctrl microservice.
If an EPL app has an infinite or long-running loop, it may block the correlator context for too long, not letting any other apps run in the same context or, even worse, causes excessive memory usage (as the correlator is unable to perform any garbage collection cycles) leading to the app running out of memory. The Apama-ctrl microservice identifies such scenarios (the correlator logs warning messages if an app is blocking a context for too long) and raises alarms, so that the user can identify and fix the problem.
For example, the following monitor blocks the correlator main context:
event MyEvent {
}

monitor Sample{
    action onload() {
        while true {
            // do something
            send MyEvent() to "foo";
        }
    }
}
Apama-ctrl generates the following alarm for the above example:
APAMA_CTRL_WARN_<HASHCODE>You can diagnose the issue by the monitor name given in the alarm.
For more details, you can also check the log files of the Apama-ctrl microservice if the tenant has the “microservice hosting” feature enabled. Alarms of this type should be fixed as a priority as these scenarios may lead to the microservice and correlator running out of memory. See also Log files of the Apama-ctrl microservice.
If restoring an EPL app on a restart of the Apama-ctrl microservice takes a long time and exceeds the time limit
specified by the recovery.timeoutSecs tenant option (in the streaminganalytics category) or a default of 60 seconds,
the Apama-ctrl microservice times out and raises an alarm, indicating that it will restart and reattempt to restore the EPL app.
The alarm text includes the names of any EPL apps that are considered to be the reason for the timeout.
eplapp_restore_timeoutThe following information is only included in the alarm text if the Apama-ctrl microservice detects that the timeout is due to some EPL apps: “The following EPL apps may be the cause of this: <comma-separated list of app names>.”. If no such apps are detected, this information is omitted from the alarm text.
This alarm is raised when the Apama-ctrl microservice tries to activate the deployed extensions during its startup process and there are multiple extensions with the same name.
extension_errorThis disables all extensions that were deployed to Apama-ctrl. In order to use the deployed extensions, the user must decide which extensions to keep and then delete the duplicate ones.
This alarm is raised if a smart rule contains an invalid configuration.
smartrule_configuration_errorTo diagnose the cause, download the basic diagnostics ZIP file as described in Downloading diagnostics and logs. Or, if that fails, log on as an administrator and look at the result of a GET request to /service/smartrule/smartrules?withPrivateRules=true. Review the smart rules JSON and look for invalid smart rule configurations. Such smart rules must be corrected.
The Apama microservice log contains more details on the reason for the smart rule configuration failure. For example, it is invalid to configure an “On measurement threshold create alarm” smart rule with a data point that does not exist.
This alarm is raised if a corrupt smart rule is present in the inventory and the correlator therefore fails to recover it correctly during startup.
smartrule_restore_failedTo diagnose the cause, download the basic diagnostics ZIP file as described in Downloading diagnostics and logs. Or, if that fails, log on as an administrator and look at the result of a GET request to /service/smartrule/smartrules?withPrivateRules=true. Review the smart rules JSON and look for invalid smart rule configurations. Such smart rules may need to be deleted or corrected.
This alarm is raised in certain cases when the connection between the Apama-ctrl microservice and the correlator is lost. This should not happen, but can be triggered by high load situations.
lost_correlator_connectionApama-ctrl will automatically restart. Report this to product support if this is happening frequently.
Input or output queues that are filling up are a symptom of a serious performance degradation, suggesting that events or requests are being produced by Apama or Cumulocity faster than they can be processed by Apama or Cumulocity.
The performance of the correlator’s input and output queues is periodically monitored. Different types of alarms can be raised, where the alarm text contains a snapshot of the correlator status at the time of raising the alarm.
This alarm is raised for the input queues:
input_queues_fillingThis alarm is raised for the output queues:
output_queues_fillingThis alarm is raised for both the input and output queues:
input_output_queues_fillingSee also List of correlator status statistics in the Apama documentation.
Check the text from the above alarms to get an indication of which queue is blocking. A problem is likely to trigger these alarms, followed by this alarm:
This alarm is raised whenever the CEP queue for the respective tenant is full. It is coming from Cumulocity Core, but concerns Apama-ctrl.
Core java application nodes that send events to the CEP engine maintain per-tenant queues for the incoming events. This data gets processed by the CEP engine for the hosted CEP rules. For various reasons, these queues can become full and cannot accommodate newly arriving data. In such cases, an alarm is sent to the platform so that the end users are notified about the situation.
If the CEP queue is full, older events are removed to handle new incoming events. To avoid this, you must diagnose the cause of the queue being full and resolve it as soon as possible.
The CEP queue size is based on the number of CEP events, not raw bytes.
To diagnose the cause, you can try the following. It may be that the Apama-ctrl microservice is running slow because of time-consuming smart rules, analytic models or EPL apps, or the microservice is deprived of resources, or code is not optimized, and so on. Check the correlator input and output queues from the above alarms (or from the microservice logs or from the basic diagnostics ZIP file under /correlator/status.json).
This alarm is raised for a subtenant that was subscribed before the parent tenant was subscribed.
parent_tenant_not_subscribedThe Apama-ctrl microservice allows you to subscribe to tenants in any order. However, as long as the parent tenant is not subscribed, the microservice functionality will not work on the subtenant.
This alarm is cleared once the parent tenant is subscribed.
This alarm is raised when an Analytics Builder model drops an event because it is delayed beyond the reorder buffer duration.
analyticsbuilder_dropped_eventsAnalytics Builder models use buffers to reorder incoming events by their source timestamp and process them in order. By default, input blocks reorder events with a delay of up to 1 second. If an event is received after a delay of more than the reorder buffer duration, the event may be dropped without processing. See Input blocks and event timing for detailed information.
To resolve the issue, you can either disable the reordering of input events or increase the duration of the reorder buffer. You can disable the reordering of input events by enabling the Ignore Timestamp parameter of the input blocks. When the Ignore Timestamp parameter is enabled, the input events are processed as soon as possible without reordering. You can increase the duration of the reorder buffer by changing the timedelay_secs tenant option in the analytics.builder category. For more information on timedelay_secs, see Keys for model timeouts.