
Observability
The Observability page shows an audit trail of all agent runs in your tenant and the tool calls of each run. Use it to see which agents run, who runs them, whether they succeed, how long they take, and how many tokens they use. To open it, navigate to AI Agent Manager > Observability in the Administration application. The page remains available while AI agents are disabled with the kill switch, so you can still review past agent runs.
The AI Agent Manager records every agent run, including calls via the REST API, AI chat widgets, AI assistants in other applications, and tests in the AI Agent Manager. The audit trail only contains metadata and never the content of a run, see What is recorded.
ROLES & PERMISSIONS:
- To view the Observability page: READ or ADMIN permission for the permission type “AI agent”.
AI agent runs
The list shows the agent runs of your tenant, newest first.
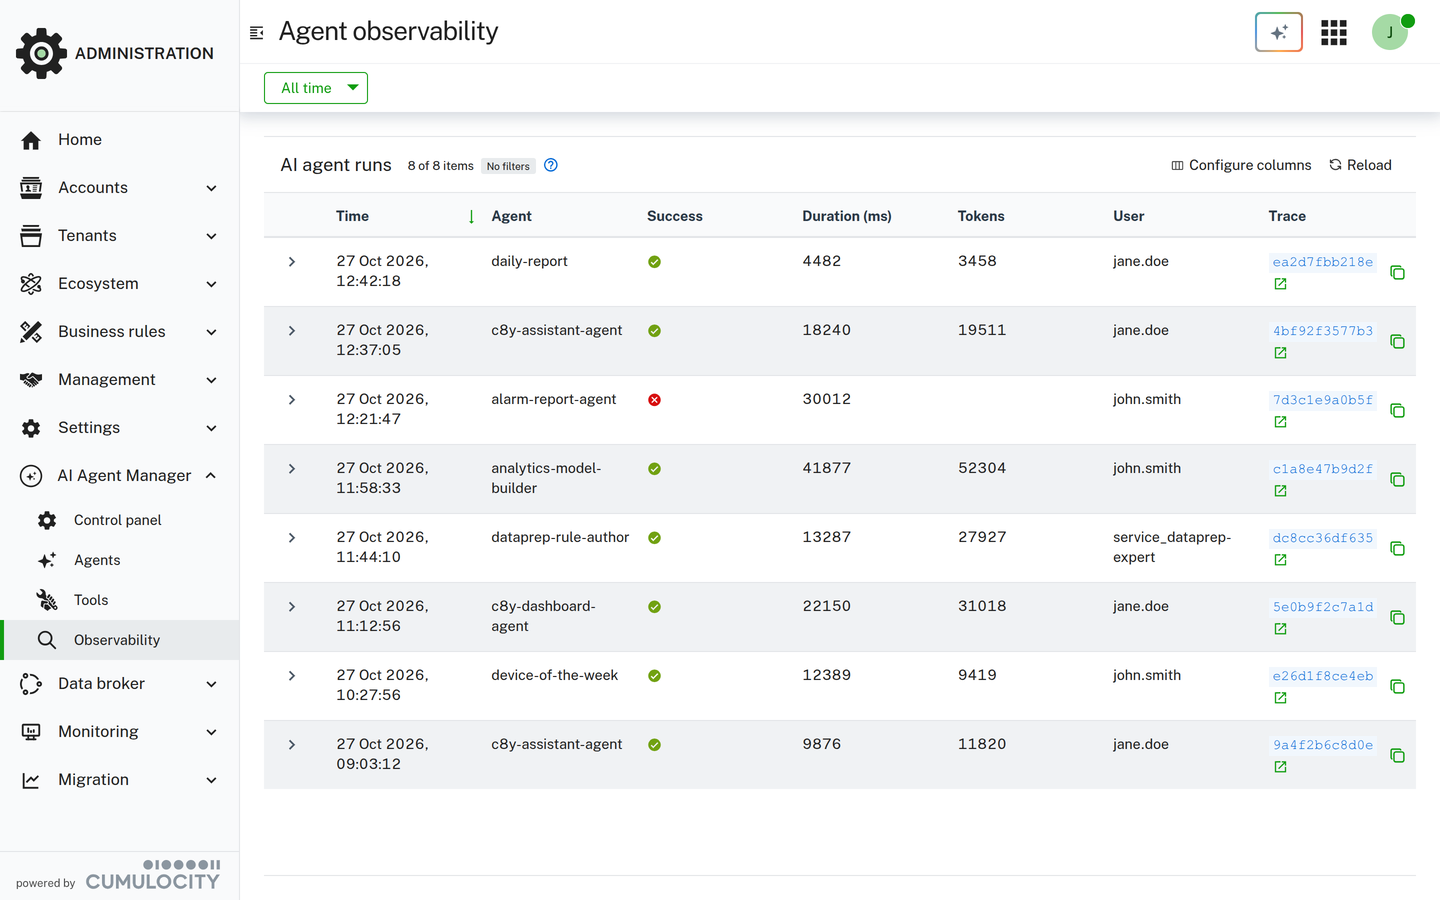
Each run is shown with the following information:
- Time: The time when the run ended.
- Agent: The name of the agent.
- Success: A green check mark if the run succeeded, a red cross if it failed.
- Duration (ms): The duration of the run in milliseconds.
- Tokens: The total number of input and output tokens of the run.
- User: The user who ran the agent.
- Trace: The beginning of the trace ID of the run. Click the copy icon to copy the full trace ID. If you configured a Trace viewer URL template in the OpenTelemetry export, the trace ID is a link that opens the trace in your tracing backend.
Use the following options to find runs:
- Date range: Click the date range button in the action bar, which shows All time by default. Select a From date and a To date and click Apply. Click Clear to show all runs again.
- Agent: Click the column header Agent to filter the runs by the agent name. The filter matches every agent name that contains the text, regardless of upper or lower case. It only searches the 2000 newest runs of the selected date range. To find older runs, narrow the date range.
- Time: Click the column header Time to sort the runs by time.
Tool calls of a run
Click the arrow at the start of a row to expand the run. The tool calls of the run are shown as a timeline in the order they were called.
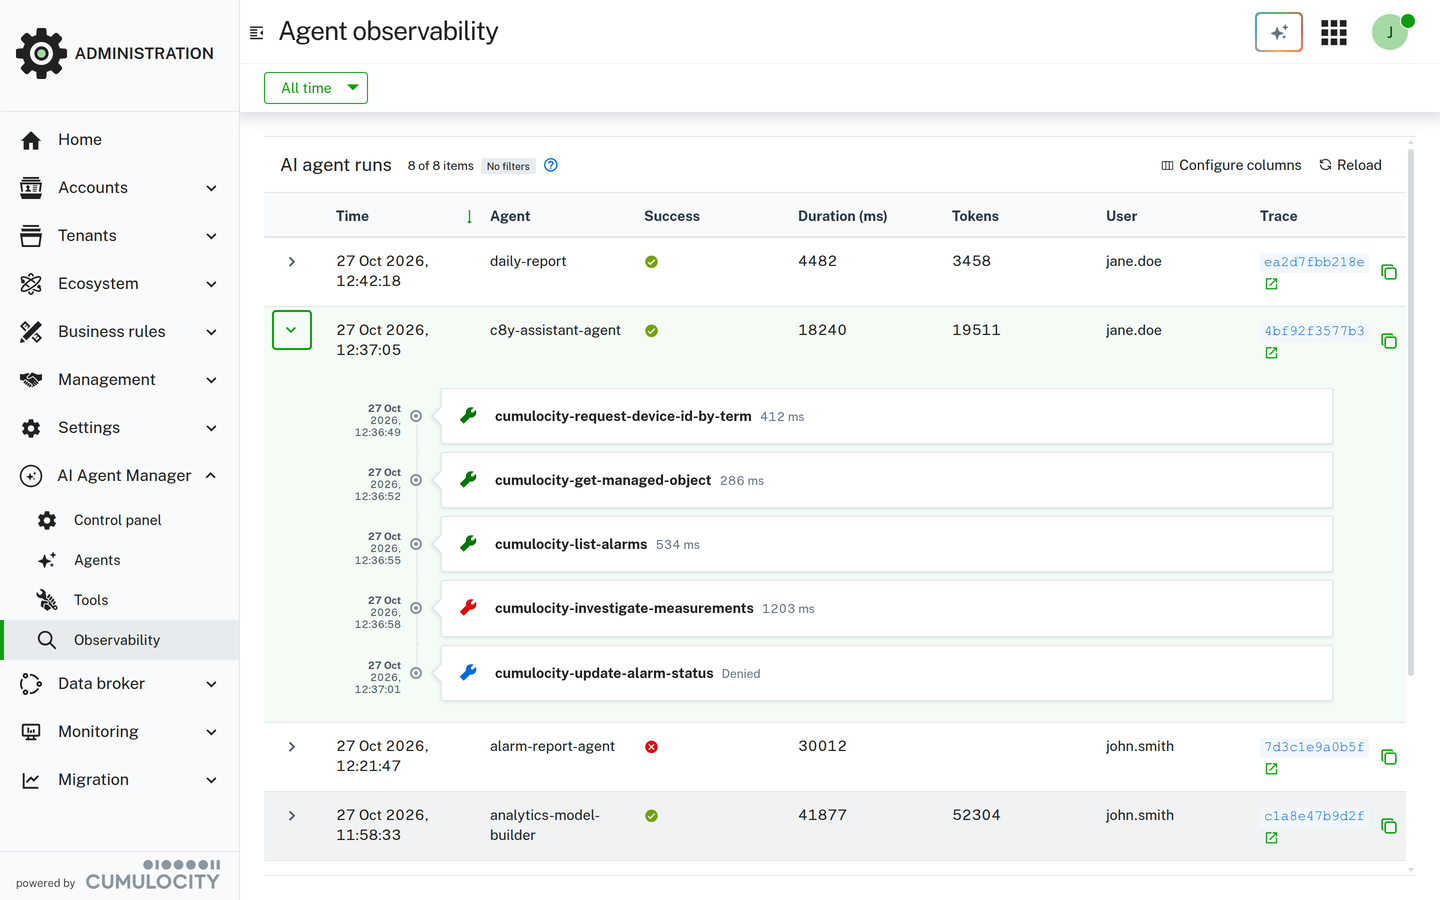
For each tool call, the timeline shows the time, the name of the tool, and the duration in milliseconds. The icon shows whether the tool call succeeded or failed. If a tool call requires approval and the user rejected it, the tool call is marked as Denied. Denied tool calls never run, so they have no duration.
If the agent did not call any tools, “No tool calls for this run.” is shown.
What is recorded
The audit trail only contains metadata. For each run, the AI Agent Manager records the following information:
- The agent name, and whether the agent was called as a text agent, as a streaming text agent, or as an object agent.
- Whether the run succeeded or failed, its duration, the reason why the model stopped, and the input, output, and total tokens.
- The user who ran the agent.
- The trace ID (
telemetryId).
For each tool call, it records the agent and tool name, the trace ID of the run, the user, whether the call succeeded, failed, or was denied, and its duration. For failed tool calls, only the type of the error is recorded, not the error message.
The audit trail never contains prompts, system prompts, responses, or tool call arguments and results. To analyze the content of agent runs, export the runs to your own collector with the OpenTelemetry export.
Where the records are stored
The AI Agent Manager stores the records as audit logs of your tenant with the following types:
| Type | Description |
|---|---|
c8y_AiAgentRun |
An agent run. |
c8y_AiToolCall |
A tool call of an agent run. |
c8y_AiAgentDefinition |
A custom agent was created, updated, or deleted. These records are not shown on the Observability page. |
The source of all records is a managed object named “AI Agents” of type c8y_AiAgentService, which the AI Agent Manager creates automatically with the first record. The records are kept according to the retention rules for audit logs of your tenant.
To read the records programmatically, see Observability in the REST API documentation.
Linking runs to traces
Every run has a trace ID, also called telemetryId. It is the ID of the OpenTelemetry trace of the run and connects the run with its tool calls on the Observability page and with the trace in your tracing backend, if you export traces with the OpenTelemetry export.
To find the trace of a run in your tracing backend, copy the trace ID in the Trace column and search for it in your backend. To open traces with one click instead, configure a Trace viewer URL template in the OpenTelemetry export, for example, https://grafana.example.com/explore?traceID={telemetryId}.