Working with dashboards
Cumulocity allows you to create individualized dashboards for all your groups and devices. Dashboards provide you with a customized visualization of your data, for example, alarms and events, and allow you to trigger remote actions, by using a set of widgets. Widgets can display maps, images, graphs, tables, and other graphic representations of data.
Cumulocity comes with a number of preset widgets, see Widgets collection for details.
ROLES & PERMISSIONS:
- To view dashboards: READ permission for permission type “Inventory” or READ permission for “Inventory” in inventory roles
- To edit widgets within a dashboard: ADMIN permission for permission type “Inventory” or CHANGE permission for “Inventory” in inventory roles
- To create a dashboard: CREATE or ADMIN permission for permission type “Inventory” or CHANGE permission for “Inventory” in inventory roles
- To delete a dashboard: ADMIN permission for permission type “Inventory” or CHANGE permission for “Inventory” in inventory roles
- To share/copy a dashboard: CREATE permission for permission type “Inventory” or CHANGE permission for “Inventory” in inventory roles
To create a dashboard
To create your individualized dashboard, execute the following steps:
-
In the Groups menu select the group or the device in the navigator for which to create a dashboard.
-
Click the Add dashboard button right from the tabs to open the dashboard editor.
-
In the General tab of the dashboard editor, provide the following information:
- An icon which is shown next to the dashboard name in the navigator.
- A menu label to be used as the name of the dashboard.
- A description of the dashboard.
- The location of the dashboard in the navigator, with “5000” being ordered first and “-5000” last.
-
In the Availability section, specify which users have access to the dashboard based on global roles. By default, all available global roles are selected, which means that a user with at least one such role has access to the dashboard.
Info- Dashboards are always visible to their owner and to users with ADMIN permission for the permission types “Inventory” or “Managed object”.
- This functionality is entirely based on client-side solutions. If users have an accurate link to the dashboard, they will still be able to access it.
-
Enable the option Dashboard template to share the dashboard with all devices of this type. This option is only available for devices dashboards. See To share a dashboard
-
In the Appearance tab, you can select a theme for the dashboard (one of “Match UI”, “Light”, “Dark” or “Branded”), a default header style for the widgets (one of “Regular”, “Border”, “Overlay”, or “Hidden”), and the gap between the widgets. Moreover, you can select from two different layout modes:
- Grid: The default one, which lets each widget snap into a fixed grid.
- Responsive: Lets you define the responsive look of the dashboard. You can define the number of columns, select that widgets can be freely positioned (not snapping to the top), or fit the rows into the viewport to create full height.
-
Under the Translate if possible option, you can select to have the dashboard and/or widget titles translated. For this option to work, the titles must be written in English and the corresponding translations must be available in the loaded translation resources, for example in the standard application translations, or in the custom ones provided via the localization feature or in the application options.
-
All changes are immediately displayed to visualize your selections in the dashboard below the dashboard settings.
-
Click Save to create and open the dashboard.
Next, widgets can be added to the dashboard. They allow you to display more detailed data in your dashboard.
Refer to Using widgets in dashboards and reports for details on how to add, modify or remove widgets.
Dashboard template
You can create a dashboard for a specific device and share it with all devices of the same type. This is only possible though, if the type property is set for the device.
To do so, enable the Dashboard template option. A corresponding message will be displayed in the editor. After enabling the dashboard, you can see how many devices will share this dashboard. You also have the option to duplicate type dashboard as regular one (assigned to current device only).
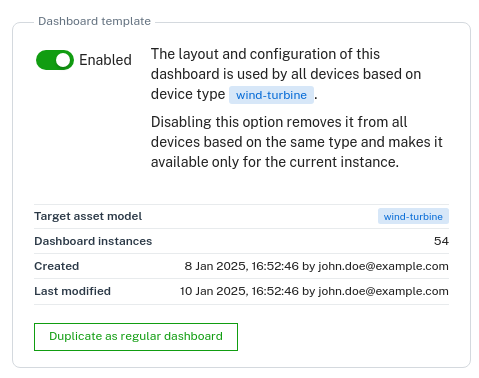
The dashboard with the dashboard template option enabled can be accessed and modified from all devices of this type. This means that changes made to this dashboard are automatically applied to all dashboard instances, no matter from which device they have been added.
Global time context
Dashboards support a global time context that allows you to control the time range, auto-refresh, and data aggregation for all connected widgets at once. Instead of configuring each widget individually, you can set these options in a central toolbar and all compatible widgets update together.
For details, see Global time context.
To edit a dashboard
To edit a dashboard, the edit mode must be enabled. There are two primary ways to enter the edit mode:
- Clicking Dashboard settings: This modifies the overall properties of the dashboard, such as its name, description, position, availability, or appearance.
- Clicking Edit widgets: This manages the content of the dashboard, including adding, removing, or changing the position of widgets.
Once in edit mode, the redo and undo functionality is automatically enabled. This allows you to easily revert any unwanted changes you make to the dashboard. Any changes made to the dashboard in the edit mode will only be reflected on saving.
To restore a dashboard state
It is possible to restore your dashboard to a previous state using the version history. Navigate to the dashboard settings and open the Version history tab. This section will display a list of previous versions of your dashboard, including timestamps for each version. Hovering over a desired version from the list will reveal the Restore button.
When a new version is created in the version history, it includes a brief description of the changes made. A new version is added each time when saving the dashboard in edit mode or when editing the general settings of the dashboard.

To copy a dashboard from one object to another
-
Click More… in the top menu bar and from the context menu select Copy dashboard.
-
Next, navigate to the object you want to copy the dashboard to and from the context menu select Paste dashboard [NAME] to insert the dashboard.
An alternative way to copy a dashboard is to use the “dashboard per type” approach. With the “dashboard per type” approach you share the dashboard from one object with all objects of the same type, see To share a dashboard.
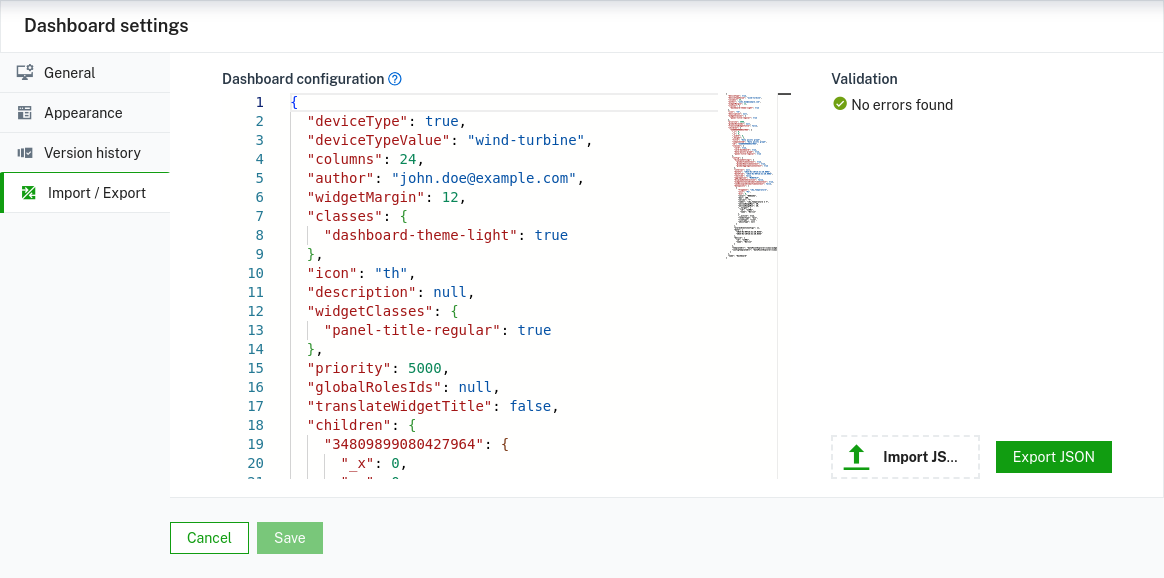
To export a dashboard to a JSON file and import it
For more advanced users there is a feature that allows more complex operations on dashboards. To access it, navigate to the dashboard settings and open the Import/export tab.
The advanced feature allows to edit dashboards as JSON with the incorporated code editor. Be aware that this requires knowledge of ContextDashboard and widgets configuration interfaces. It also allows to export a dashboard to a JSON file (with some additional data that supports particular widgets in the importing process, for example, that helps to suggest a suitable widget device or takes care of images uploaded for the widget) and then to import the dashboard from the JSON file. This is a much more flexible approach than the one described in To copy a dashboard from one object to another as it allows to share dashboards not only between the same type of assets in scope of the same tenant, but also to share dashboards between different asset types and different tenants. However, if you share dashboards between different types like groups and devices, for example, a review might be required after the import.
To delete a dashboard
To delete a dashboard from an object, click More… in the top menu bar and from the context menu select Delete dashboard.