Optional services
In addition to the standard and built-in applications that come with Cumulocity, various additional applications are provided which you may subscribe to, i.e. integrated agents for several device types.
In addition to the standard and built-in applications that come with Cumulocity, various additional applications are provided which you may subscribe to, i.e. integrated agents for several device types.
Cloud Fieldbus is a Cumulocity application with the ability to collect data from fieldbus devices and remotely manage them. This section describes how to
It is supported out of the box by the following terminals:
OPC UA support is implemented in Java and runs on any system running JRE7 (Java Runtime Environment 7) or newer.
If you want to support Cloud Fieldbus with your terminal, please contact info@cumulocity.com for more information.
For the following instructions, we assume you have a Cloud Fieldbus terminal available and it is registered as a device in your Cumulocity tenant. To register a terminal with Cumulocity, follow the instructions provided with the terminal.
To connect a Modbus/RTU device:
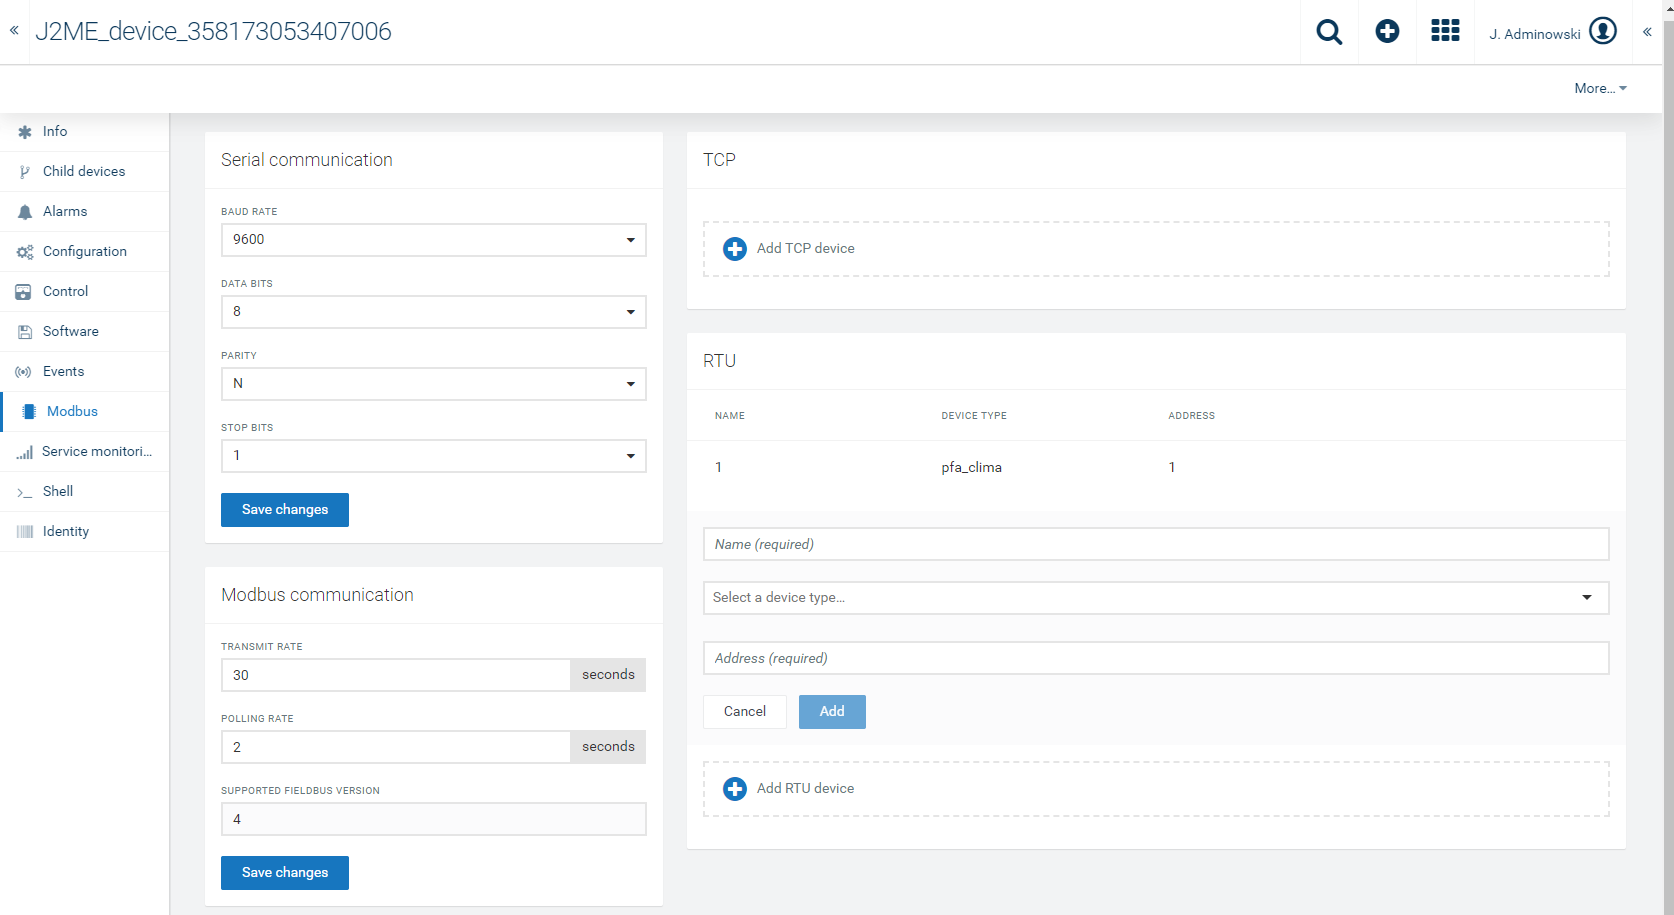
After completion, a new child device has been added to the terminal and can now be managed. You can click on the name of the device in the table to navigate to the device. If you have not yet added Modbus devices to the terminal, you may have to reload your browser window to make the Child Devices tab visible.
To connect a Modbus/TCP device:
Adding child devices
Cumulocity will now send a notification to the Modbus terminal that a new device is ready to be managed. This may take a few seconds.
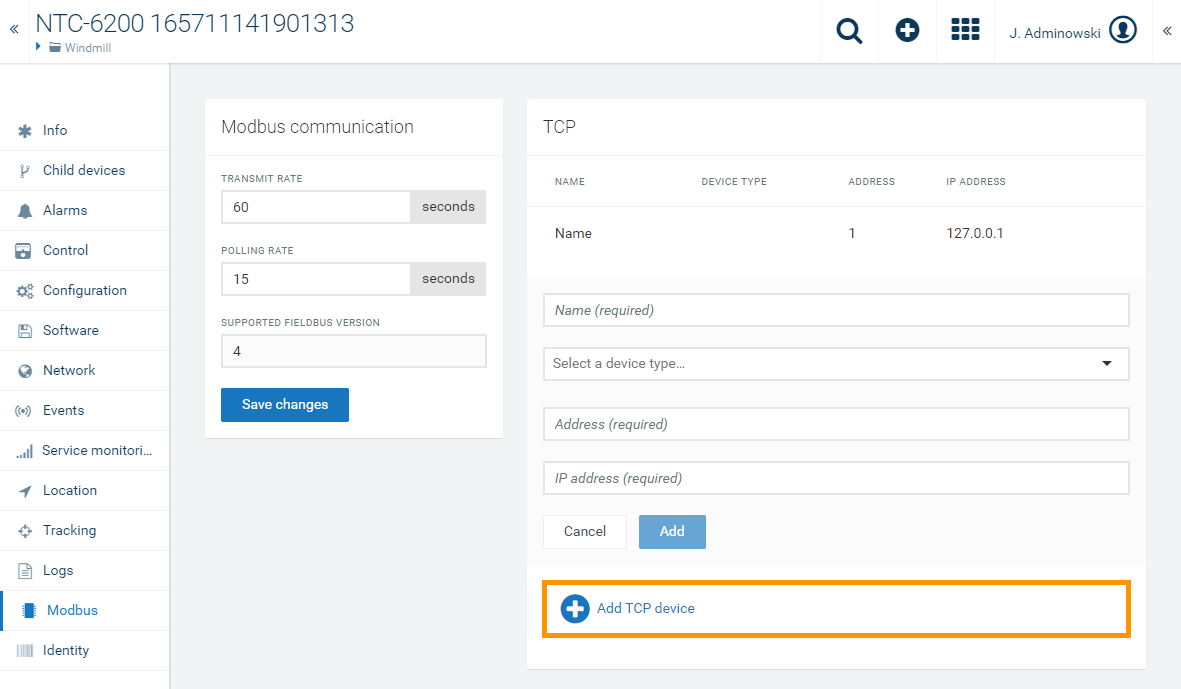
We assume that all Modbus/TCP communication uses the standard Modbus/TCP port 502. On the NTC-6200, the port to be used can be configured through the variable “service.cumulocity.plugin.lua__modbus.port” using, for example, Device Shell or the local web user interface of the device.
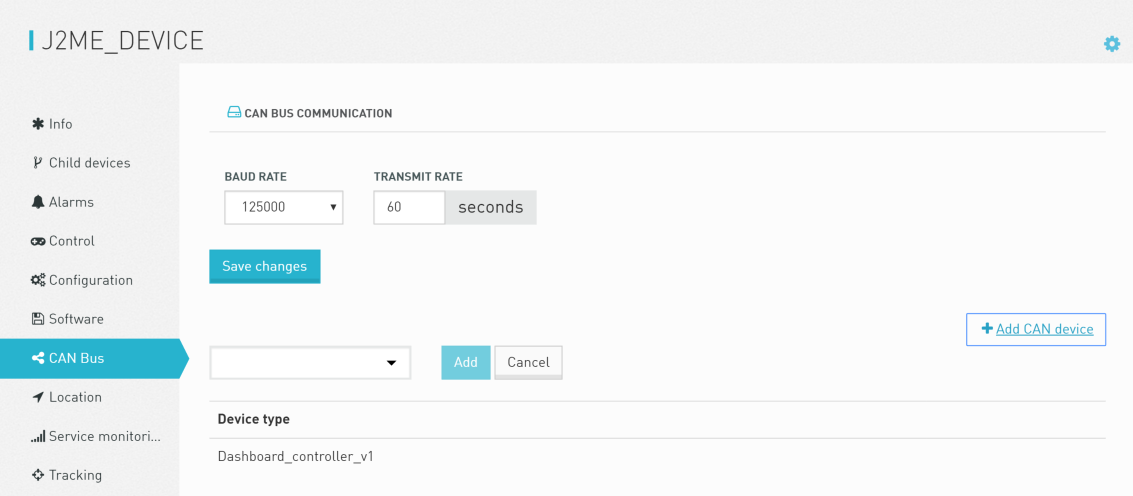
To connect a CAN device:
Adding child devices
Cumulocity will now send a notification to the Fieldbus terminal that a new device is ready to be managed. This may take a few seconds.
After completion, a new child device has been added to the terminal and can now be managed. You can click on the name of the device in the table to navigate to the device. If you have not yet added Fieldbus devices to the terminal, you may have to reload your browser window to make the “Child Devices” tab visible.
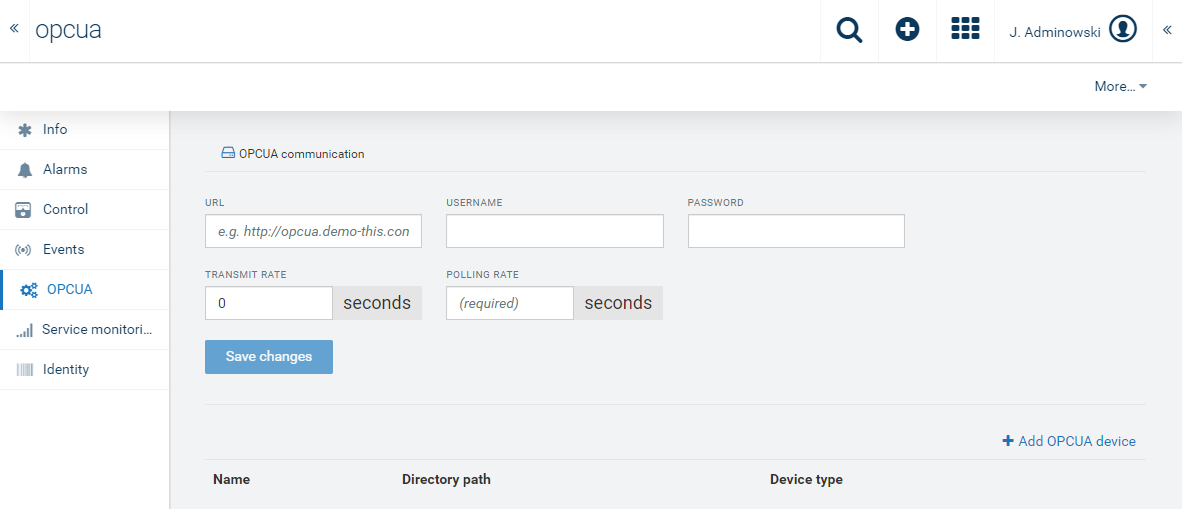
To connect an OPC UA server to Cumulocity, you need a gateway or industrial PC running the Cumulocity OPC UA agent.
Adding child devices
Cumulocity will now send a notification to the OPC UA agent that a new device is ready to be managed. This may take a few seconds.
After completion, a new child device has been added to the gateway and can now be managed. You can click on the name of the device in the table to navigate to the device.
Connecting Profibus differs slightly from the regular Plug & Play approach of Cloud Fieldbus. The gateway device acts as slave on the Profibus so it can easily be integrated into existing infrastructure. This means that Profibus data must be actively sent to the gateway though. Typically this is done by programming a PLC to actively send information to the gateway via it’s configured Profibus slave address.
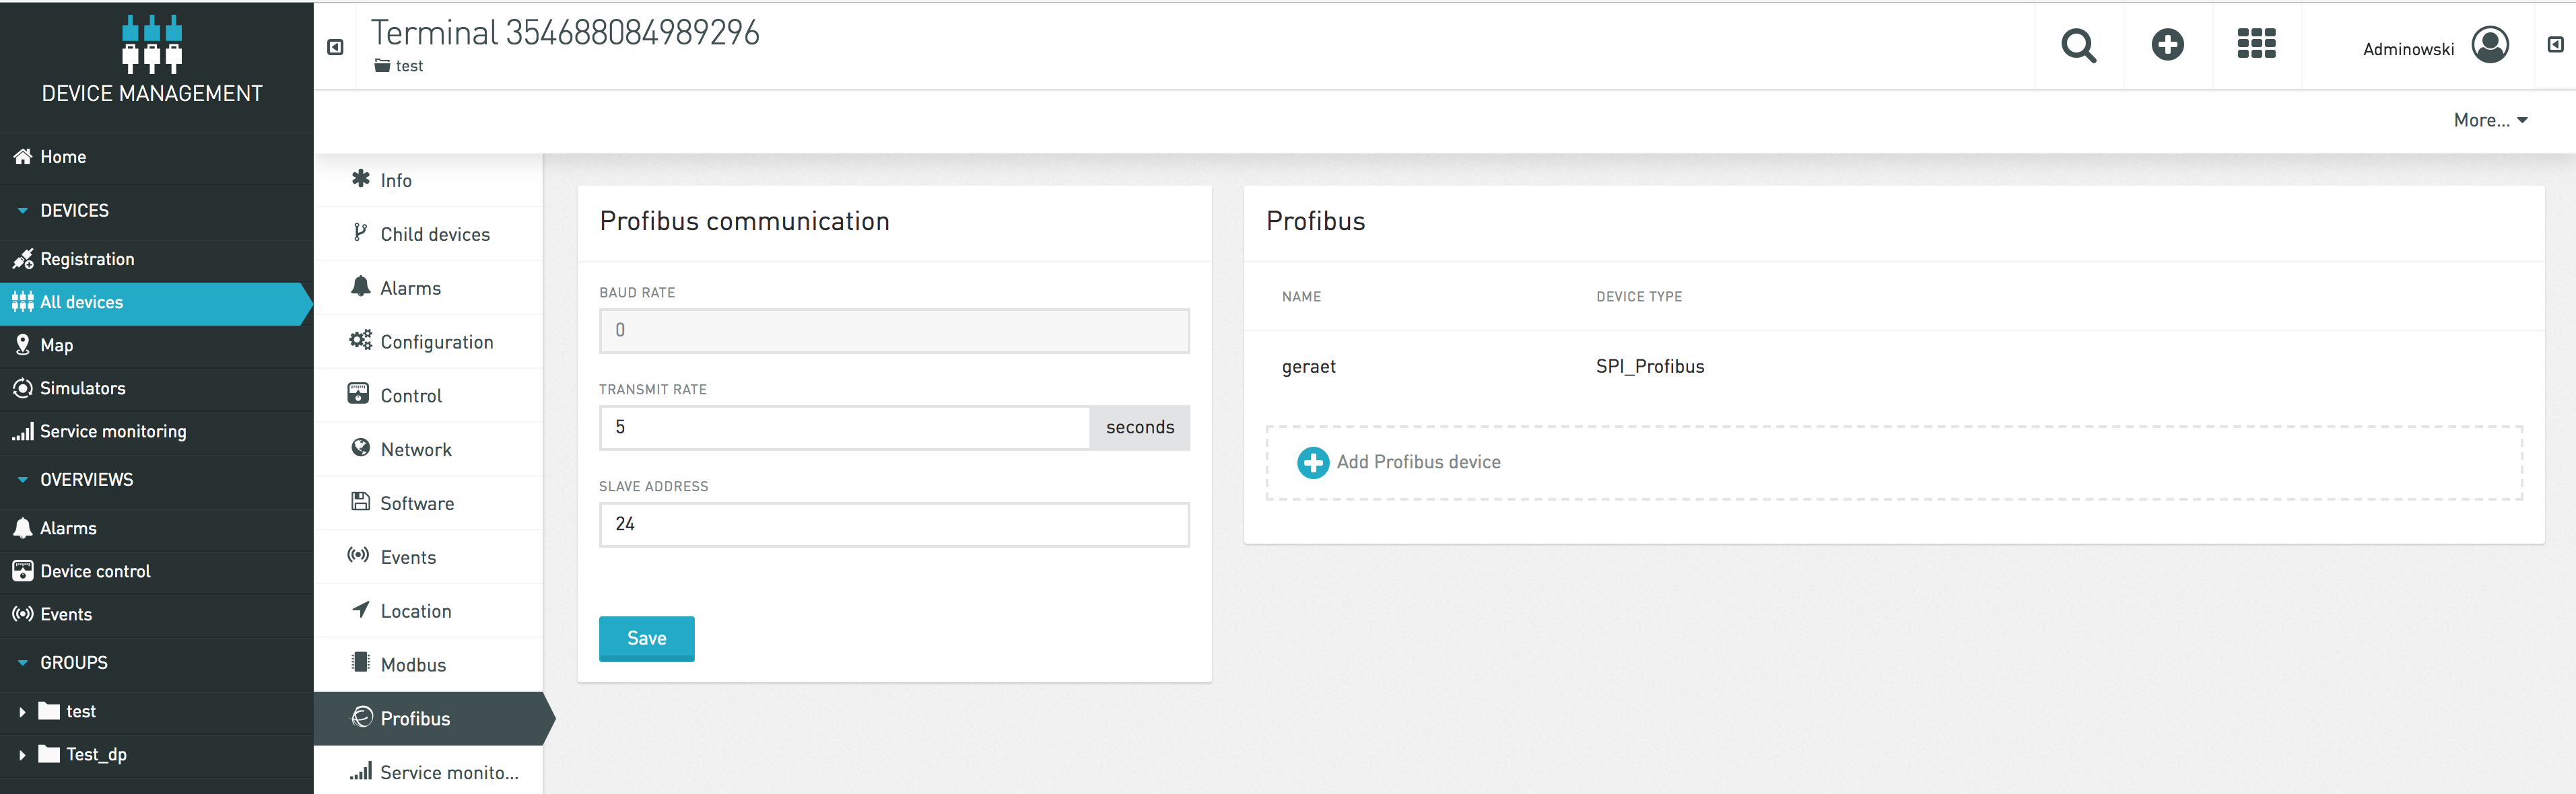
Adding child devices
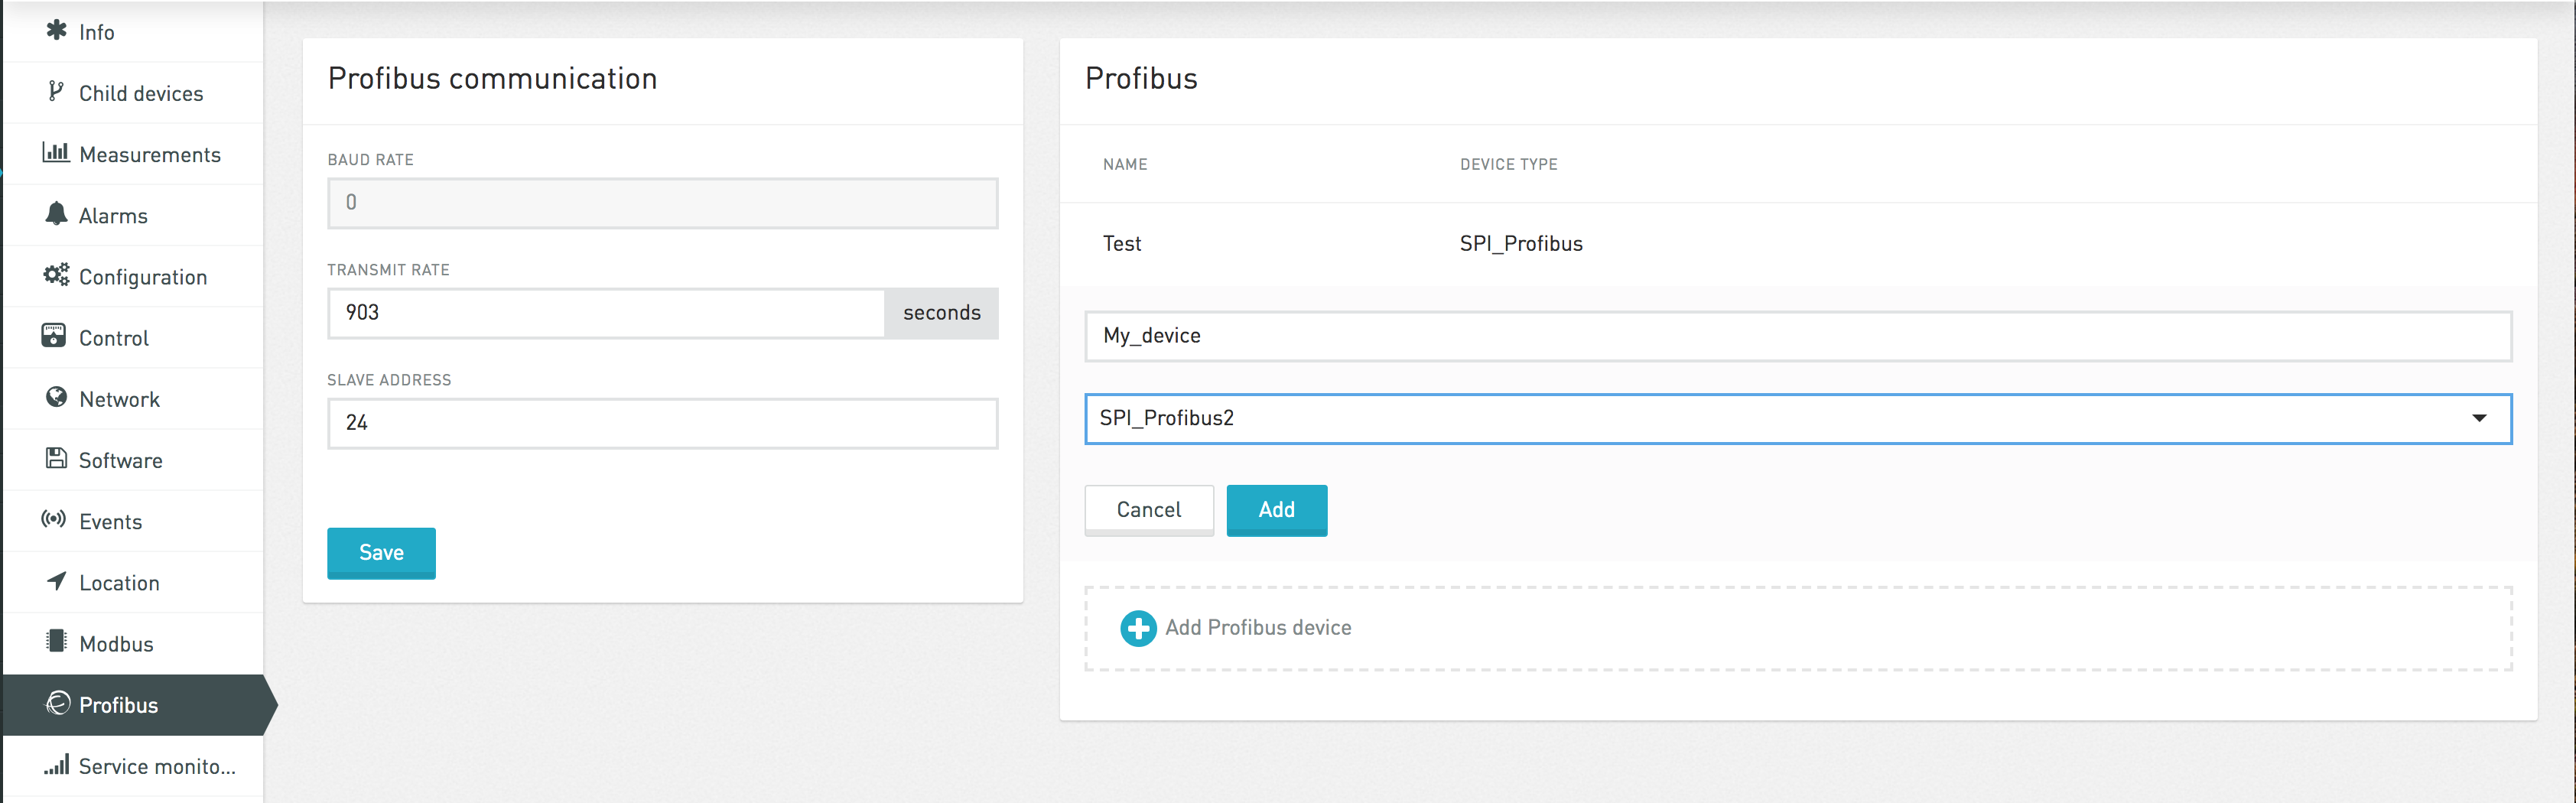
Now A child device will be created containing the data configured in the selected device type.
Cumulocity will notify the gateway to send data for the newly created child device.
Once connected, you can now manage your device. Switch to the Child devices tab of a device to list the connected Fieldbus devices and navigate to a Fieldbus device. Depending on the capabilities of the device and its configuration in Cumulocity, you can:
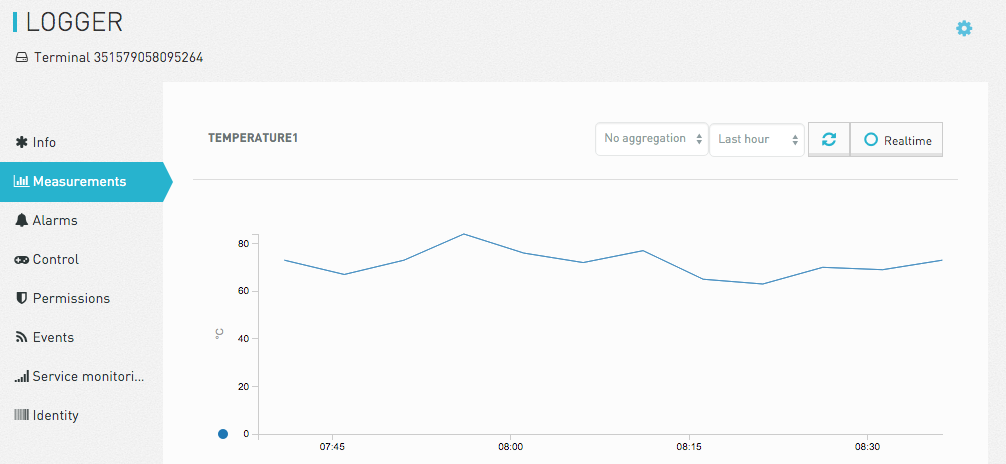
If the device type of the Fieldbus device is configured to collect measurements, these will be visible in the Measurements tab. They will also be available for usage in the Data Explorer and in Dashboard widgets.
Data is collected according to the interval specified in the “transmit rate” property of the terminal as described above. To optimize the data traffic, data that is exactly the same as collected previously may not be sent again.
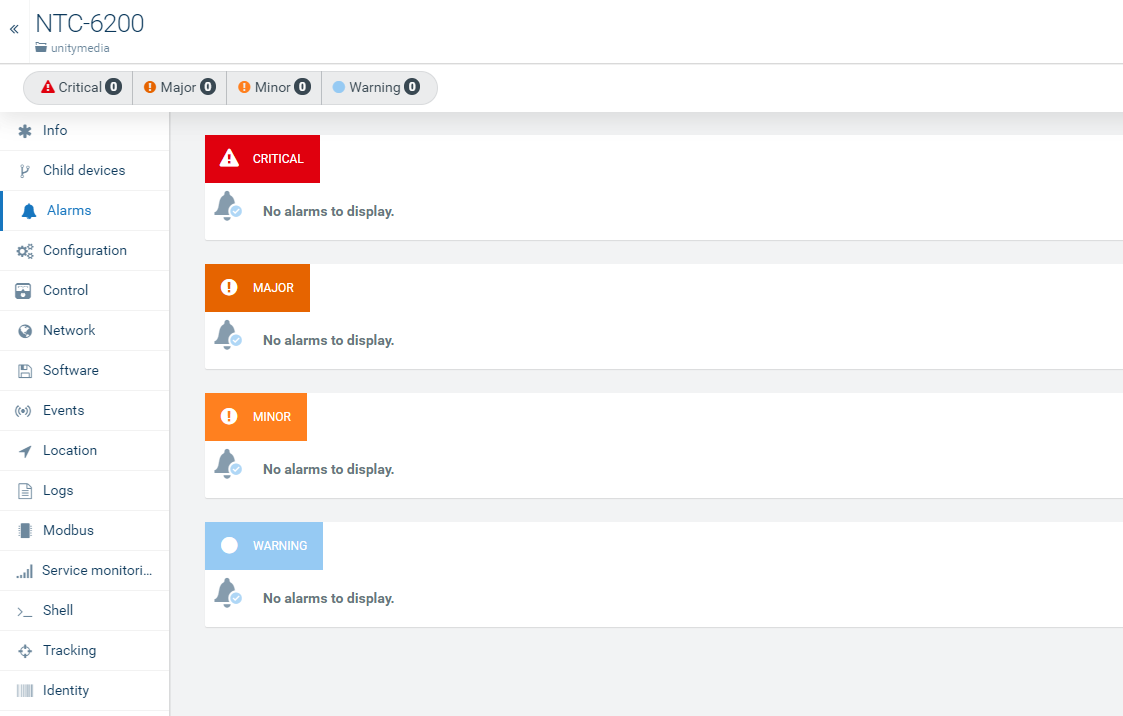
If the device type of the Fieldbus device is configured to send alarms, these will be visible in the Alarms tab and usable in widgets. To determine the alarm status, the Fieldbus devices are monitored for changes according to the “polling rate” setting of the terminal. If a particular coil or register is non-zero, an alarm will be raised. If the value goes back to zero, the alarm will be cleared.
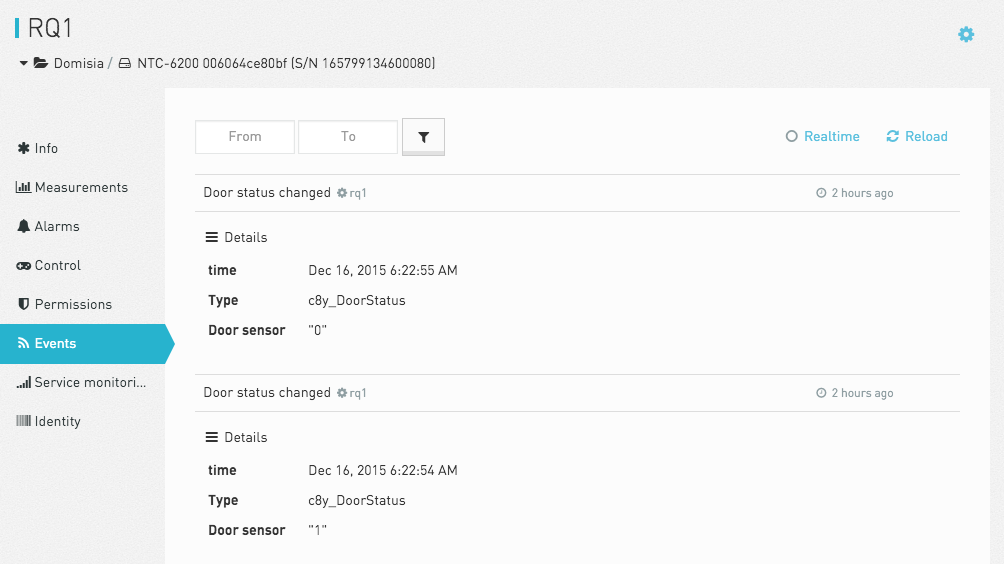
Similar to alarms, changes in Fieldbus devices can be monitored and logged as events. Each time, the value of the monitored coil or register changes, an event is created. You can see the events in the “Events” tab of the device or use them in widgets. You can inspect the new value of the monitored coil or register by clicking on the event and unfolding the event details.
The status of devices can be monitored in real time using dashboard widgets in the Cockpit application. Navigate to the Cockpit application, create a dashboard or report, and add widgets as described in the Cockpit section in the User guide. The Cloud Fieldbus has two new widgets: The “Fieldbus Device” widget and the “SCADA” widget.
The Fieldbus Device widget provides you with a tabular display of the status of a device. The status of the device can also be modified through the widget.
To use the Fieldbus Device widget, follow these steps:
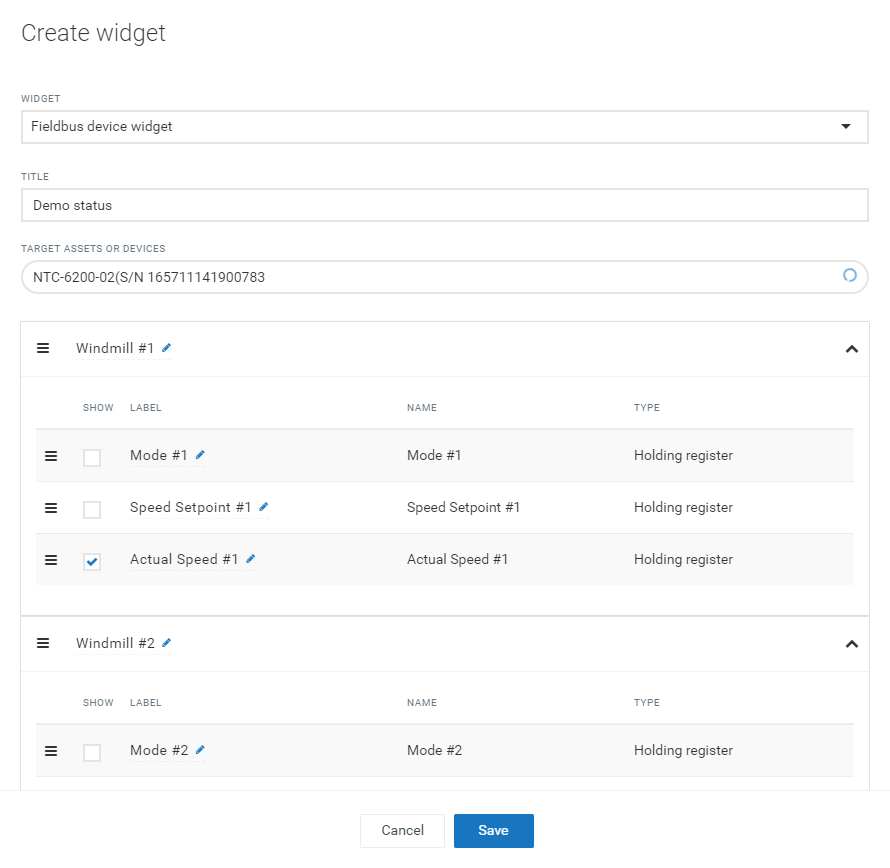
In the widget, the selected coils and registers are grouped into display categories as configured in the device type. The Fieldbus Device Widget updates automatically as soon as there is new data available. You do not need to click on reload.
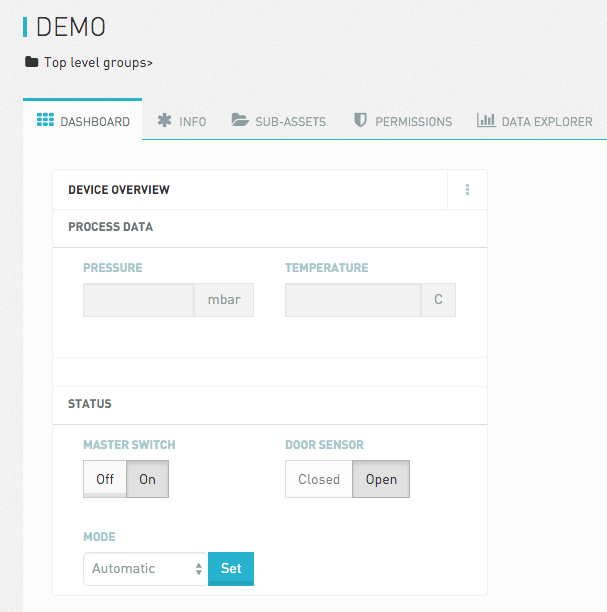
Registers and coils that can be changed are represented by active widgets. For example, in the screenshot above, the “Master switch” coil and the “Mode” register are editable. If you click a switch, an operation to change the corresponding coil or register is sent to the terminal. Similar, if you change a value and click Set, an operation is created. The terminal will then carry out the configuration change on the device, as requested through the operation. While the operation is being processed, a progress indicator is shown.
The SCADA widget provides you with a graphic representation of the status of a device.
To use the SCADA widget, follow these steps:
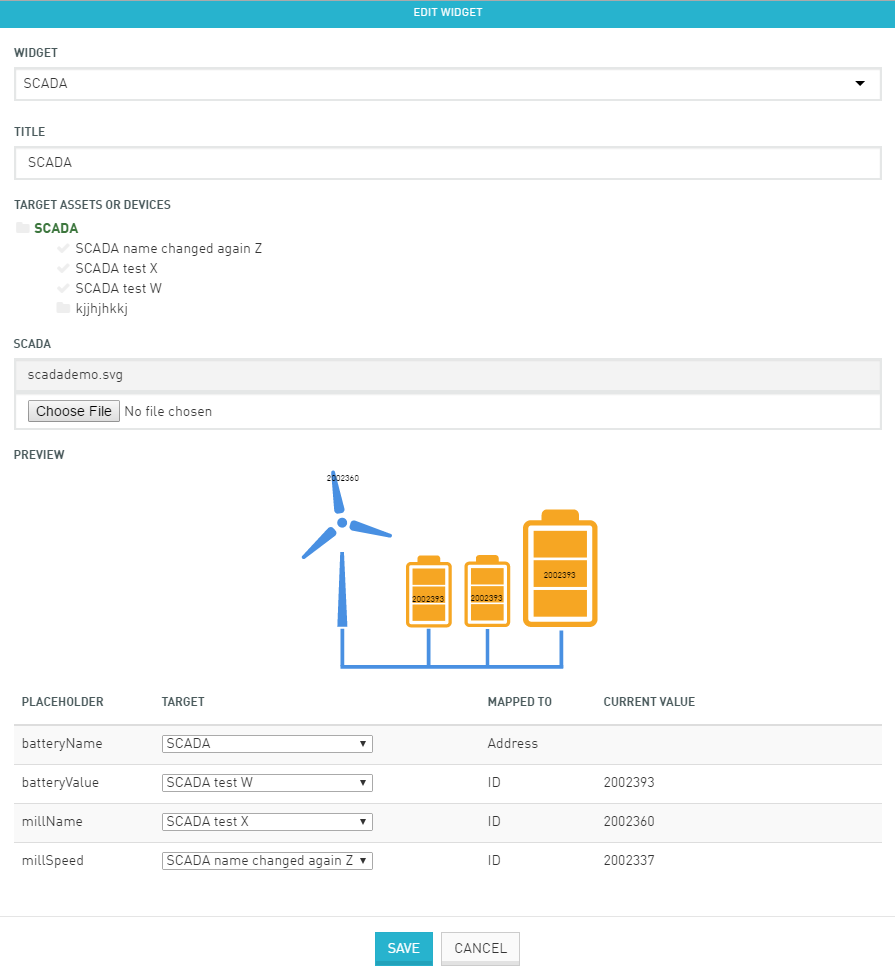
The SCADA widgets inspect uploaded SVG files for placeholders. These placeholders are replaced by actual values from devices. Placeholders have a specific syntax and can be used anywhere in the SVG file. To add a placeholder, enter the name of the placeholder in double curly braces using your design application or a text editor.
When creating svg files, we recommend you to use “https://boxy-svg.com/". It is easy to use, quality chrome extension.
<text class="text" xt-anchor="middle" x="100" y="236.982125" width="200" ...>
    {{batteryValue}}
</text>
New Fieldbus device types can be set up in the Device database page which you open from the Device Types menu in the navigator.
Click New in the top menu bar. In the Device type field, select the protocol of your device and enter a name for it.
Now you can start adding coils and register definitions to the device type, depending on the selected protocol (see the descriptions below).
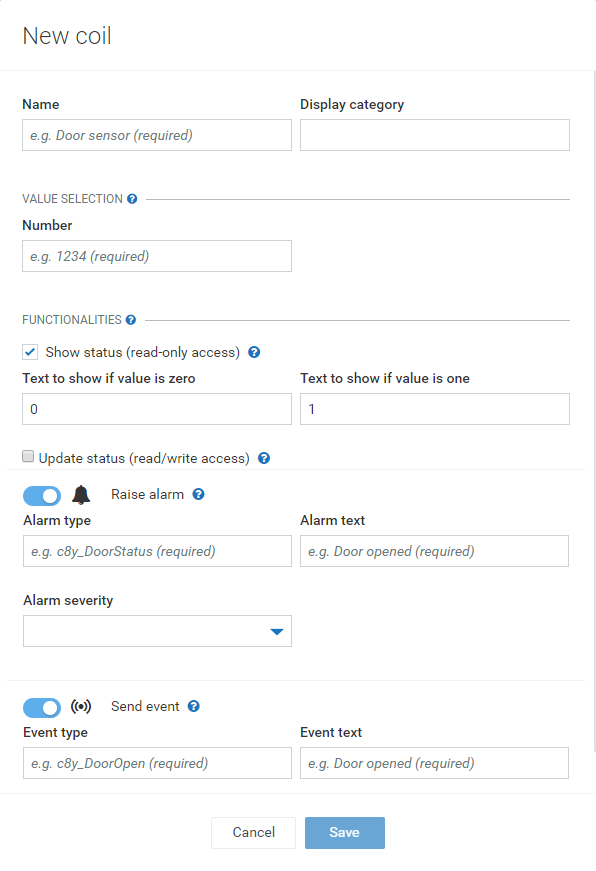
Click Add at the top right of the Coils (discrete inputs) section, to add a coil definition. This will open a dialog to specify the coil. Enter the following information:
The same functions are available for discrete inputs. However, it is not possible to update the status of a discrete input.
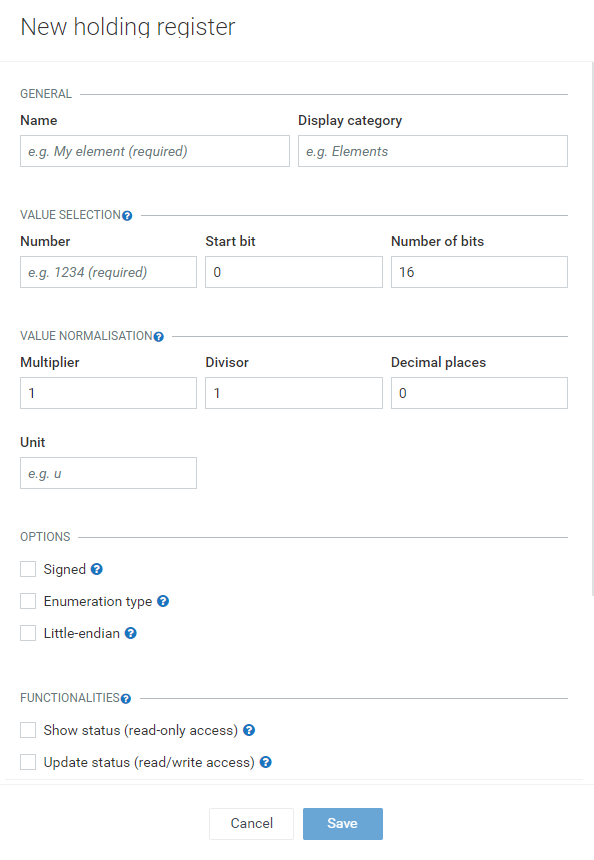
Click Add at the top right of the Holding registers section, to add a register definition. This opens a dialog to enter the details of the register definition:
In the Options section, select the checkbox Use server time to create the time stamps for data on the server instead of on the terminal. If you need to support buffering of data on the terminal, leave this checkbox clear.
Finally, click Save to save your settings.
If you edit a device type that is currently in use, you may need to
CAN device types can be configured in a very similar way as Modbus device types. For more information, see Configuring Modbus data above. The differences are:
OPC UA device types can be configured in a very similar way as Modbus device types. For more information, see Configuring Modbus data above.
The main difference is how data is addressed. OPC UA servers provide a hierarchical object model of connected nodes. The nodes are addressed by the browse path from the root of the object model to the respective node.
To simplify configuration, the browse path is split into two parts in Cloud Fieldbus:
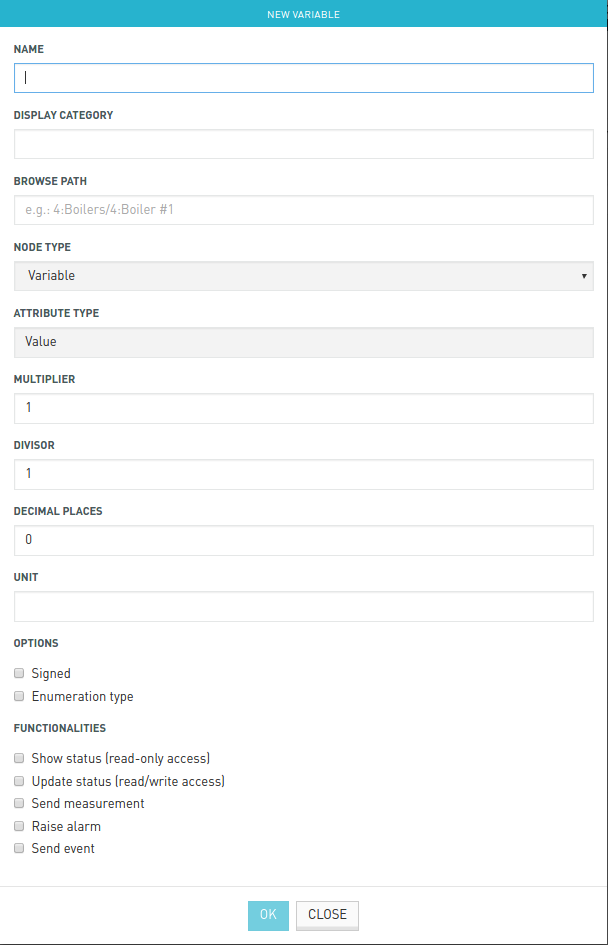
When you click Add, enter the second part of the path into the Browse Path field as shown in the image below. Note that the OPC UA agent currently only supports nodes of type “Variable”. The description of the paths should be either provided with your OPC UA server or with your devices.
To configure a Profibus device type, select “Profibus” as device type from the dropdown list and enter a name for it.
In the Register section, click Add at the right to add one or more register definitions as described exemplarily for Modbus devices in Adding a register definition above.
In the Options section, select the checkbox Use server time to create the time stamps for data on the server instead of on the terminal. If you need to support buffering of data on the terminal, leave this checkbox clear.
Finally, click Save to save your settings.
If you edit a device type that is currently in use, you may need to
There are two ways to create a new device type. Either manually from scratch via the “New” operation or via import of an EDS file for the corresponding device.
Manually creating a new device type from scratch
Navigate to the Device database page and click New. The following window will open:
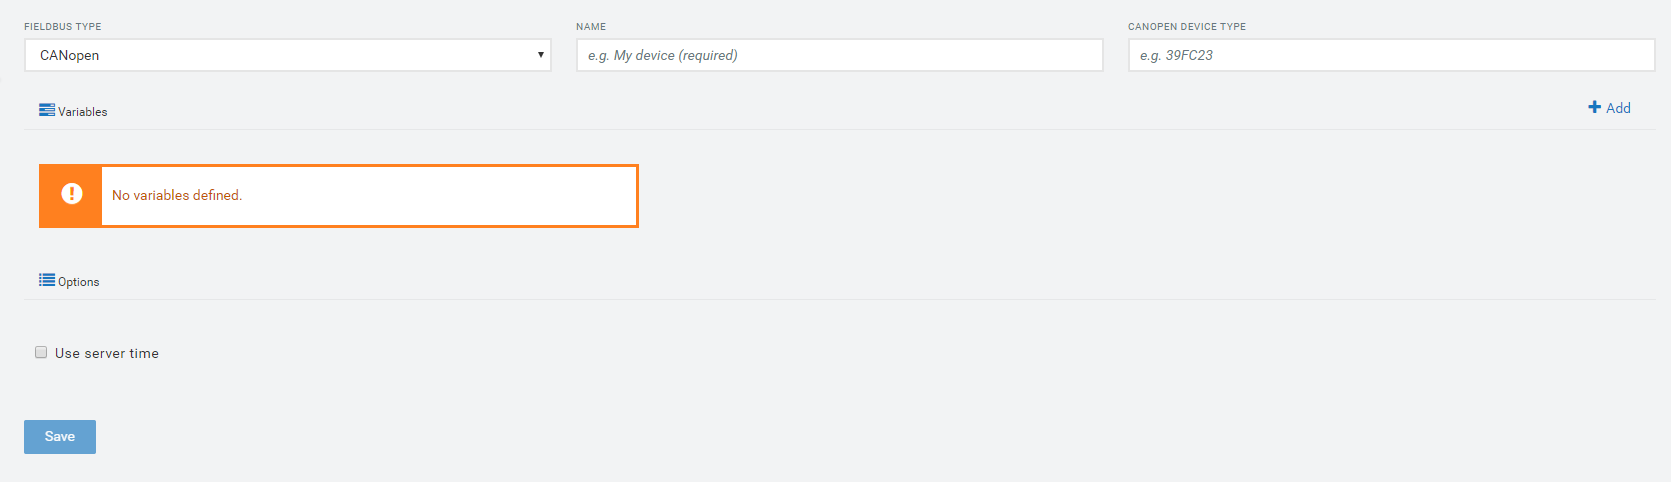
Select “CANopen” as fieldbus type and enter a name for your device type. Specific to CANopen is the CANopen device type field which accepts a hex number.
In the Variables section, you determine the CANopen variables. Variables inside the “Object Dictionary”(OD) of the CANopen device can be accessed later by adding the variables to the device type definition. Via the Add button at the right of the Variables section, new variables can be configured.
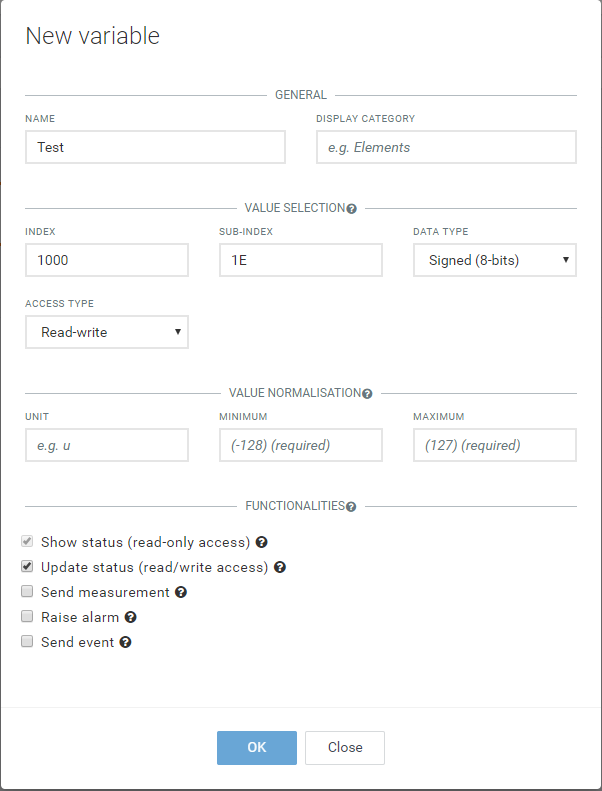
The following fields can be observed:
After adding variables to the new device type, they are listed in the Variables section of the device type. All variables are grouped by the given display category, i.e. variables with same category are grouped together.
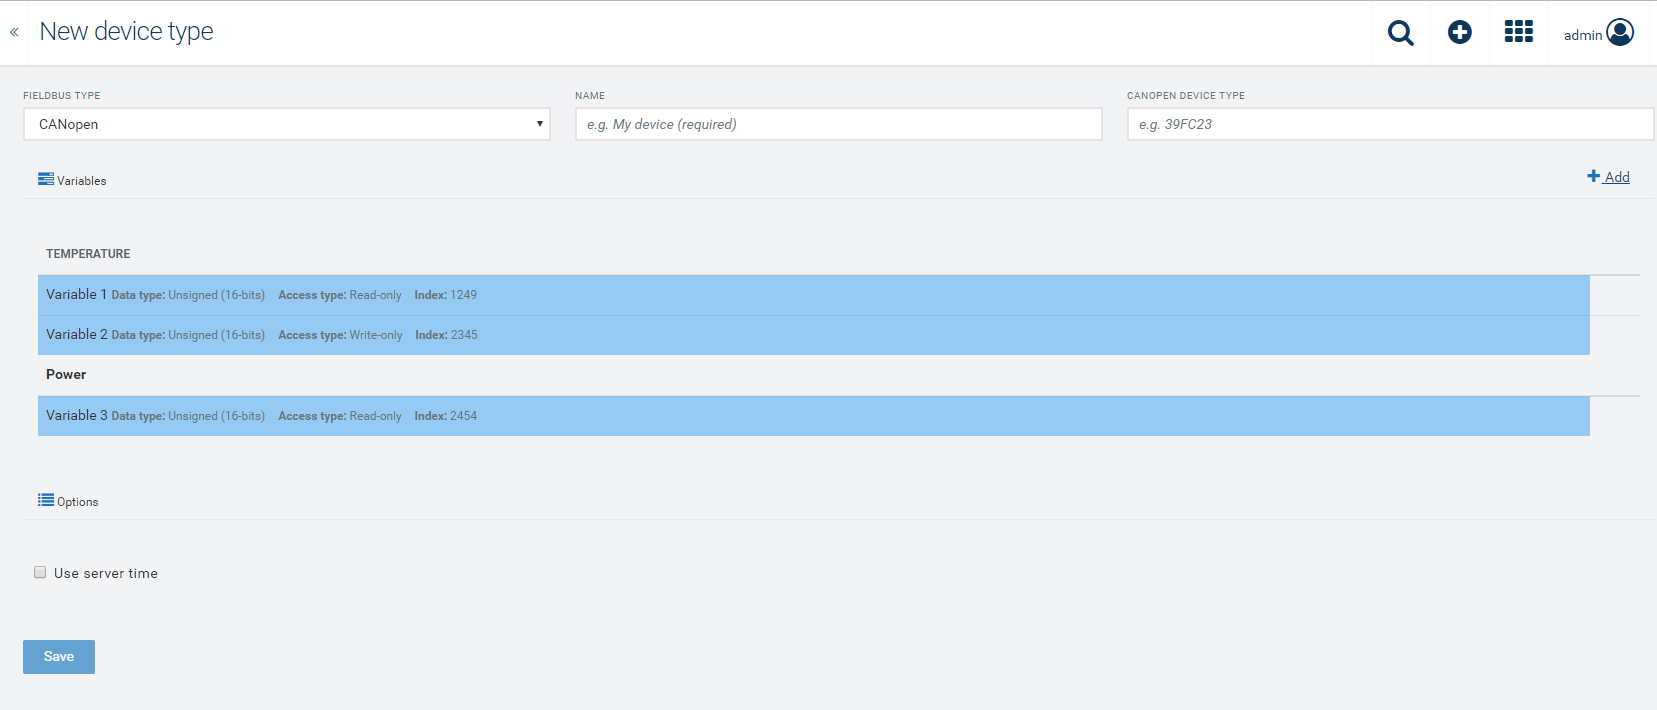
After completing your configuration, click Save to save your settings. The device type can be used now to add CANopen devices to the platform. The device type can be updated after creation.
Importing a device type
To import a new device type, see the Exporting and importing device types section.
After importing the EDS file, all variables defined in the file are listed in the Variables section of the device type. The user can then enrich the imported variable configurations by opening the configuration dialog for each variable (e.g. the missing display category can be set or mappings can be defined).
Configuring CANopen device data
To configure CANopen device data navigate to the desired device and switch to the CANopen tab.
In the CANopen communication section, the following parameters can be configured:
In the CANopen section, up to 127 CANopen devices can be added to the gateway as child devices by giving the following parameters:
The device type and node ID need to match with the real CANopen device, otherwise setting up the communication is not possible or wrong values will be transmitted.
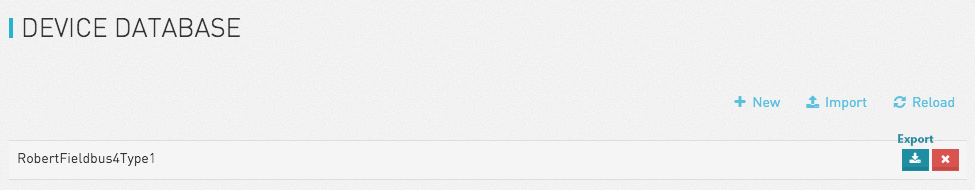
To manage device types more conveniently, you can export device types to a file once they are edited in the user interface. The file can be re-imported to set up other Cumulocity accounts easily or to restore the types from a backup. The import functionality also supports importing ready-made device types provided by device manufacturers.
To export a device type, hover over the device type that you would like to export and click Export. Your browser will download a file named “<device type>.json” with the device type definition.
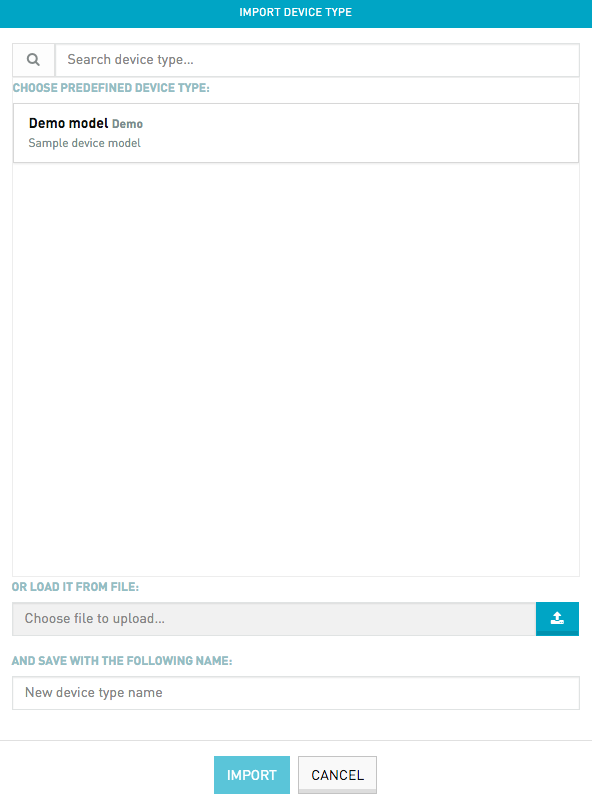
To import a device type, click Import in the top menu bar. This will open a dialog that lets you choose between importing a ready-made device type and uploading a previously exported device type. You can change the name of the device type during import using the New device type name field.
The Cumulocity IoT Cloud Sensor App sends sensor measurements from an Android smartphone, an iOS smartphone or a Texas Instruments (TI) Sensor Tag to Cumulocity to be securely processed and managed. Additionally, all devices can be remote-controlled by Cumulocity.
Info: The TI Sensor Tag is a low energy wireless device manufactured by Texas Instruments © http://www.ti.com/.
To use the Cloud Sensor App for Android you need a smartphone with Android version 5.0 or higher.
To use the Cloud Sensor App for iOS you need a smartphone with iOS version 11.0 (or higher).
Info: The screenshots are exemplarily taken from an Android smartphone. Unless mentioned otherwise the screens look similar in the Cloud Sensor App for iOS.
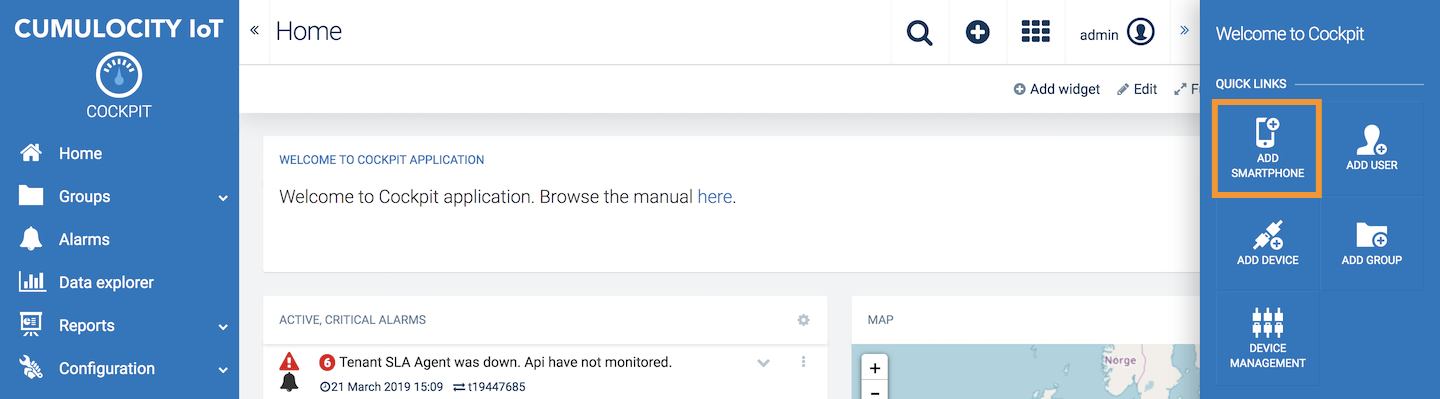
To install the Cloud Sensor App on your Android smartphone, open the Cockpit application in your Cumulocity IoT tenant, expand the right drawer and click Add smartphone from the quick links.
This will start a wizard showing the QR code for downloading the Cloud Sensor App.
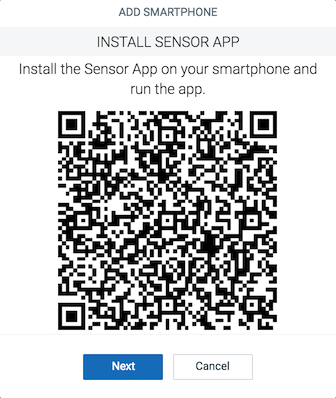
Scan this QR code with any scanning application on your smartphone.
You will then be navigated to the Google Play Store for the installation of the Cloud Sensor App for Android.
To install the Cloud Sensor App on your iOS smartphone, navigate to the App Store, search for Cumulocity IoT Sensor App and install the app on your smartphone.
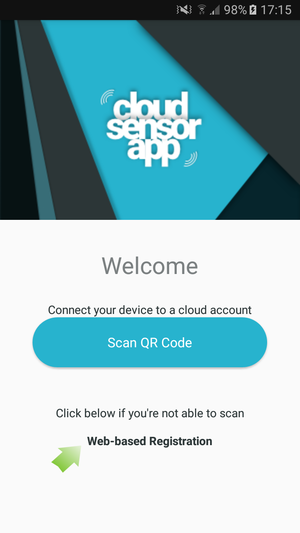
Their are two ways to register your Android smartphone as a new device in your tenant:
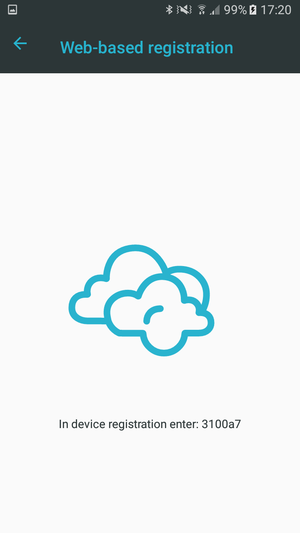
The QR code registration process (option 1) uses credentials derived from the username and password of the user who is currently logged into the IoT tenant while in the web-based registration process (option 2) unique device credentials are used.
Info: Just in case you want to re-register your smartphone, and you change from option 1 to option 2 (or vice versa), you first must delete the smartphone object in Device Management.
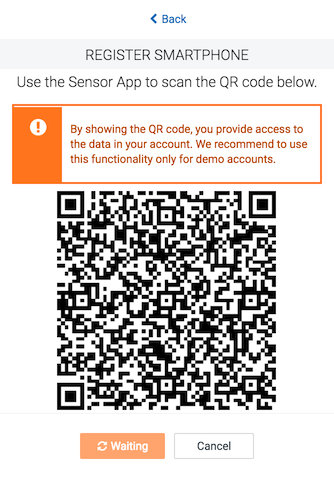
Click Next in the Cockpit wizard to display the QR code with credentials to register your smartphone to your Cumulocity IoT tenant.
Your smartphone will be added to the devices list in the Device Management application, which can be accessed by navigating to All devices in the Devices menu in the navigator.
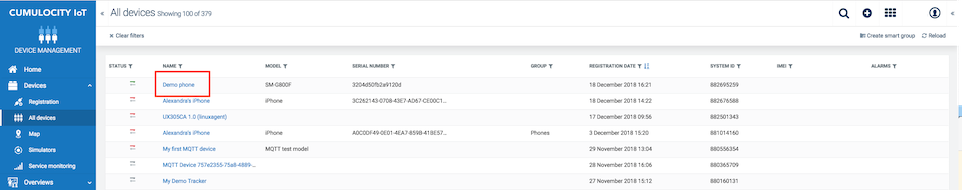
Moreover it will be added to the group “Phones” (which will be created if not available yet). You will find the group in the Group menu in the navigator. This feature is only available in case of QR code registration.
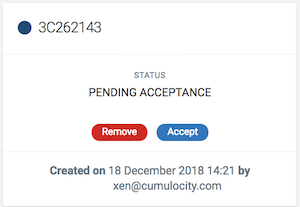
Info: Until you scan the registration credentials QR code, the button will remain in the pending state showing the message “Waiting…”. Scanning the QR code will complete the registration process.
Important: The registration credentials are encrypted. However, we highly recommend to use specific demo user accounts on your tenant for large public presentations. Do not use this method for production tenants or for tenants containing sensitive data.
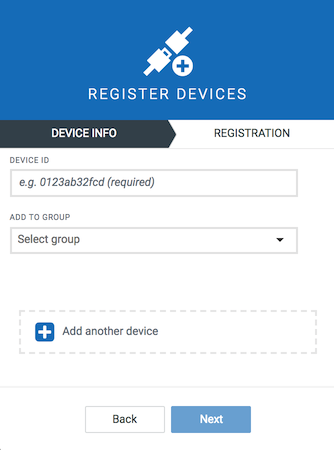
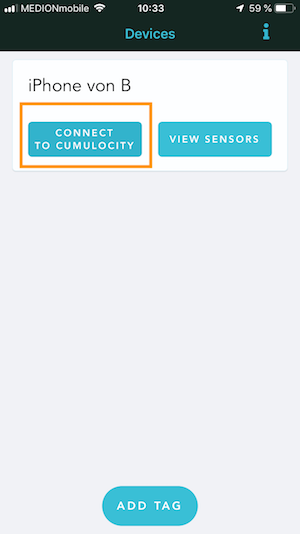
To register your smartphone manually, follow these steps.
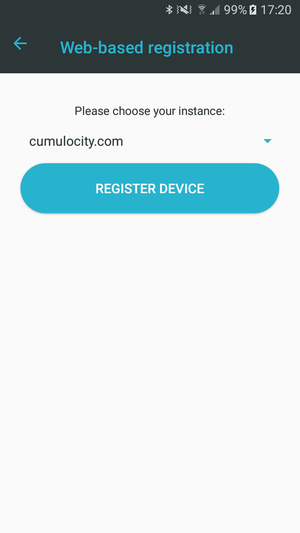
Next, go to your Cumulocity tenant.
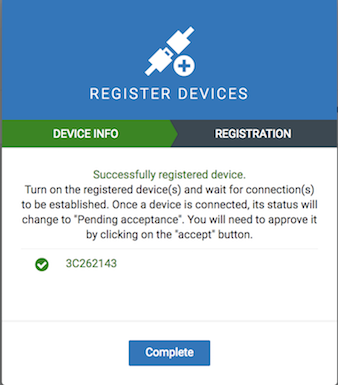
Your smartphone will be registered and added to the devices list in the Device Management application, which can be accessed by navigating to All devices in the Devices menu in the navigator.
For further information about registering a device on the platform manually, refer to Connecting devices in the Device Management section.
Next, you need to accept several permission requests allowing for accessing data (photos, media and files) on your device, make and manage phone calls and access the location (including network information and GPS data) to let the smartphone transfer network and GPS data to the cloud. This requests only show up once.
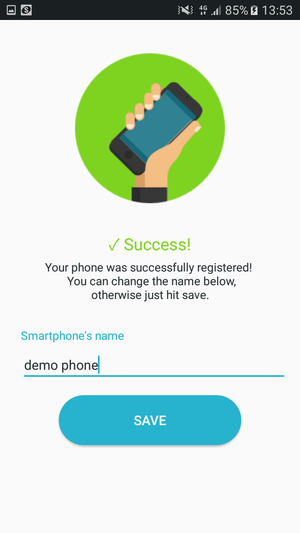
Once your smartphone is registered, the device name, which identifies your smartphone in the platform, is displayed on the screen of the Cloud Sensor App. You may edit this name here.
To register your iOS smartphone as a new device to the Cumulocity platform, process the following steps.
Info: In case of an iOS smartphone, no QR-code-based registration is provided.
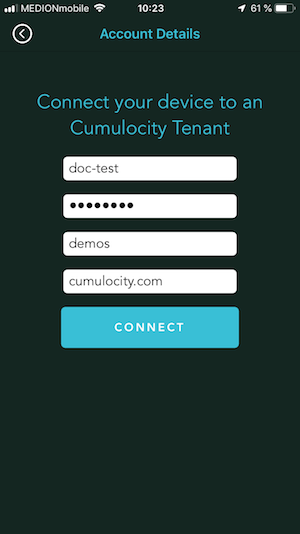
Next, go to your Cumulocity tenant.
Your smartphone will be registered and added to the devices list in the Device Management application, which can be accessed by navigating to All devices in the Devices menu in the navigator.
For further information about registering a device on the platform manually, refer to Connecting devices in the Device Management section.
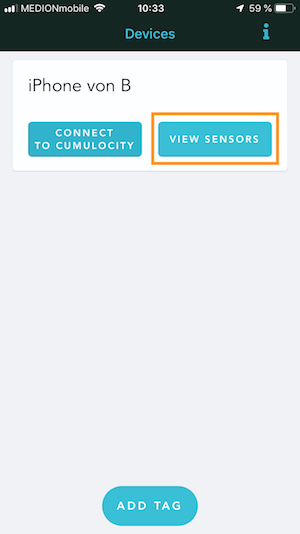
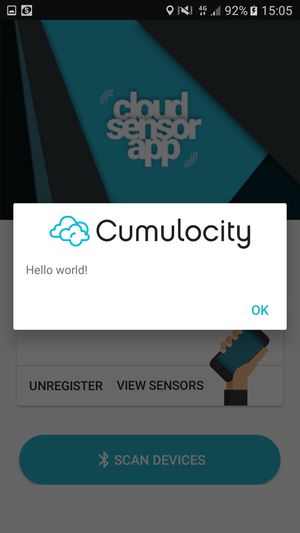
Pressing the “i” symbol in the upper right corner of the start screen of the Cumulocity IoT Sensor App will open the “About” information of the application.
On an Android smartphone
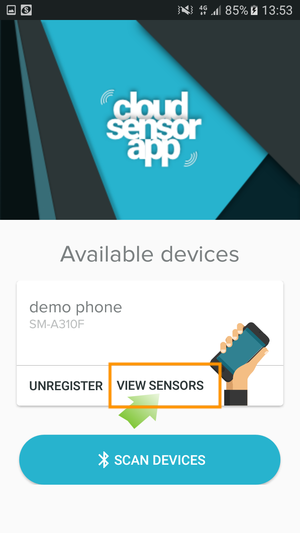
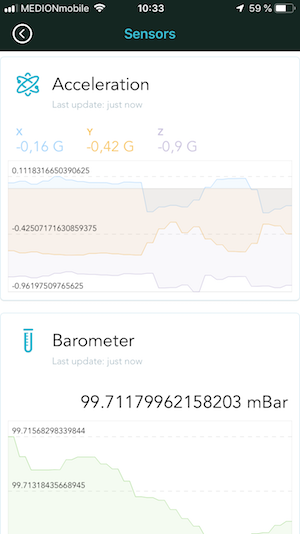
Press View sensors to view the data from sensors on your Android smartphone.
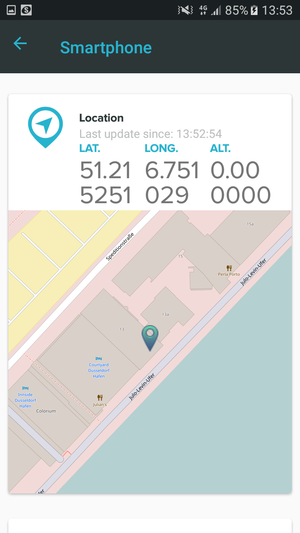
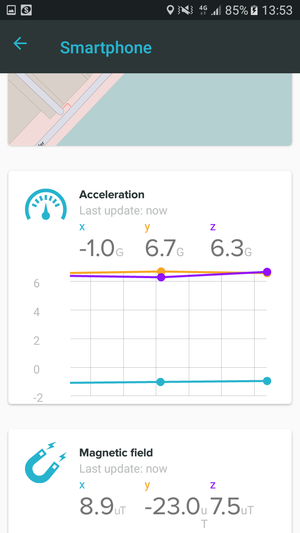
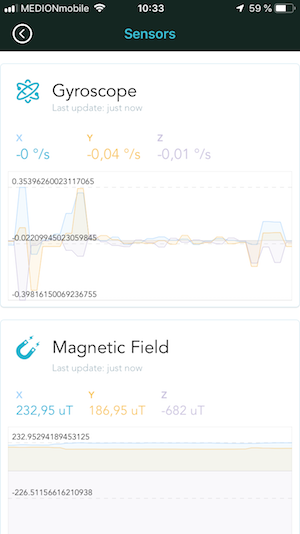
The sensor data (i.e. gyroscope, location, acceleration, magnetic field and barometer data), will be shown on the smartphone.
Example 1
Example 2
On an iOS smartphone
Press View sensors to view the data from sensors on your iOS smartphone.
The sensor data (i.e. gyroscope, location, acceleration, magnetic field and barometer data), will be shown on the smartphone.
Example 1
Example 2
Info: Note, that on on IoS smartphone you can view sensor data without being connected to Cumulocity. However, only on connecting your phone to Cumulocity the sensor data is being sent to the platform.
The measurements from the sensors of your smartphone will automatically start being sent to your Cumulocity tenant when your smartphone is connected to the platform.
The data points will be displayed in the graphs on the Info tab of your smartphone device in the Device Management application.
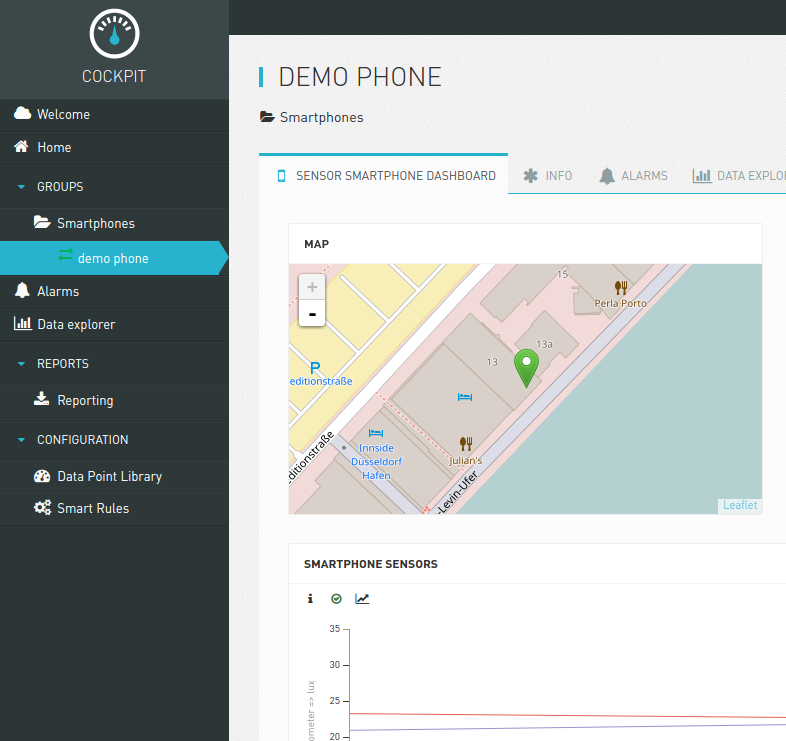
A 3D rotation widget on this dashboard will depict the data from a gyroscope sensor on your smartphone if present.
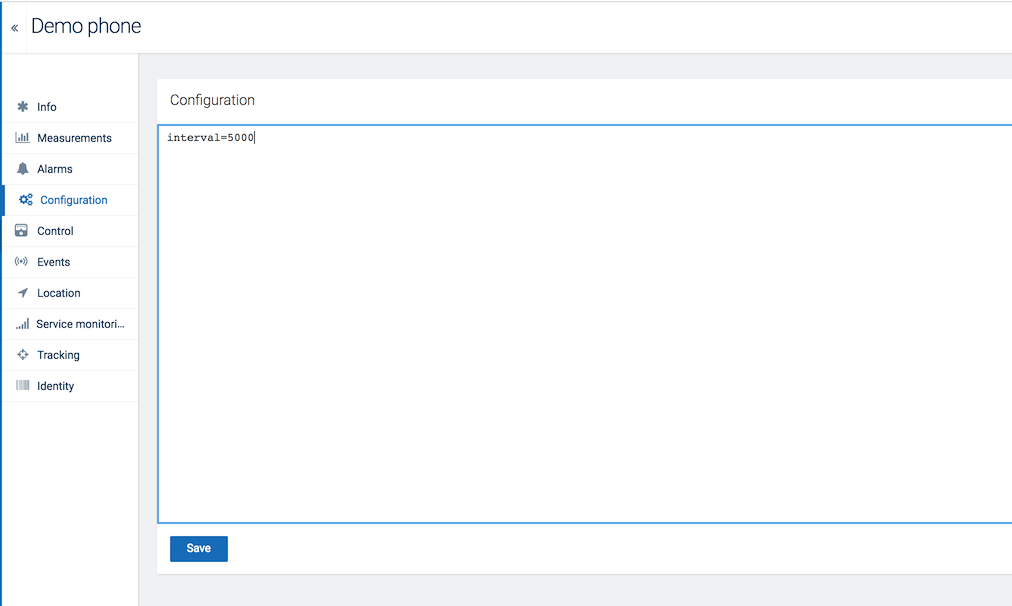
To save battery power, the Cloud Sensor App sends measurements to Cumulocity only when the data change is significant, or every 20 minutes by default. This interval can be changed in the Device Management application.
Switch to the Configuration tab of your device and specify the interval in milliseconds.
The Cloud Sensor App connects to both TI Sensor Tag version 1.20 and 1.30 via bluetooth.
On an Android smartphone
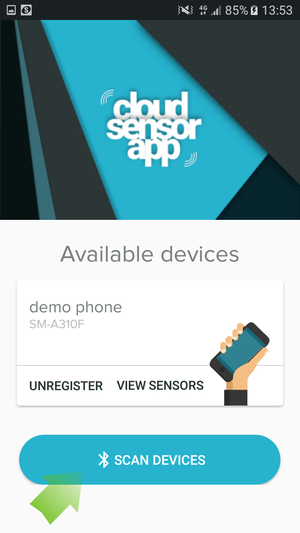
Use the Scan devices button in the Cloud Sensor App to connect a Sensor Tag.
On an iOS smartphone
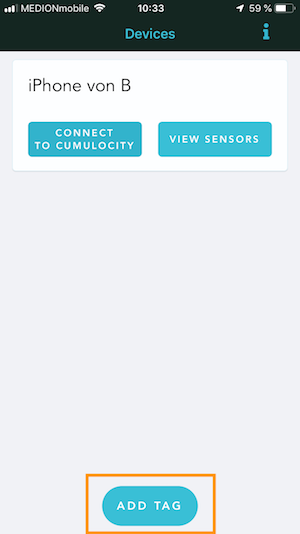
Press the Add Tag button in the Cloud Sensor App to connect a Sensor Tag.
All Sensor Tags which are discoverable are displayed. To make a Sensor Tag discoverable, press the red button next to it. The Sensor Tag will start blinking to show that it is ready to connect. It should immediately appear in the list of visible bluetooth devices in the Cloud Sensor App.
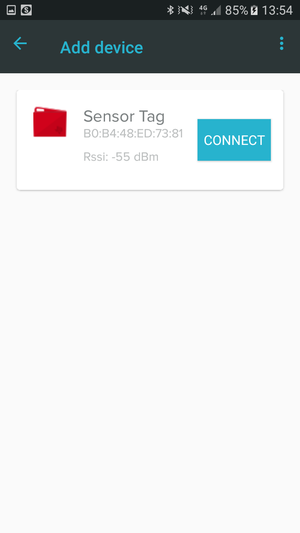
Press Connect next to the Sensor Tag of your choice. The Bluetooth connection between the Sensor Tag and your smartphone will be established. Once the Sensor Tag is paired with your smartphone, you will see it as a record on the Cloud Sensor App’s screen:
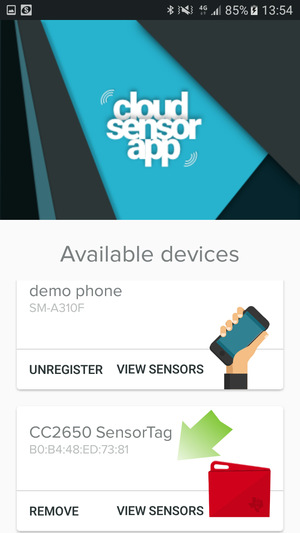
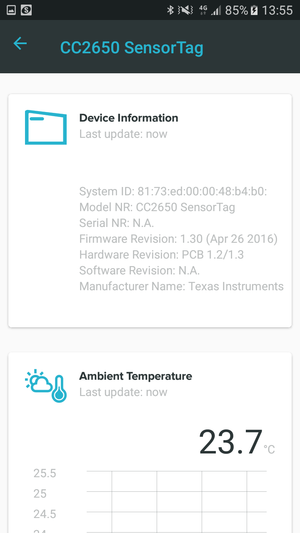
Observing information and sensor data from the TI Sensor Tag is possible by pressing View sensors on its card.
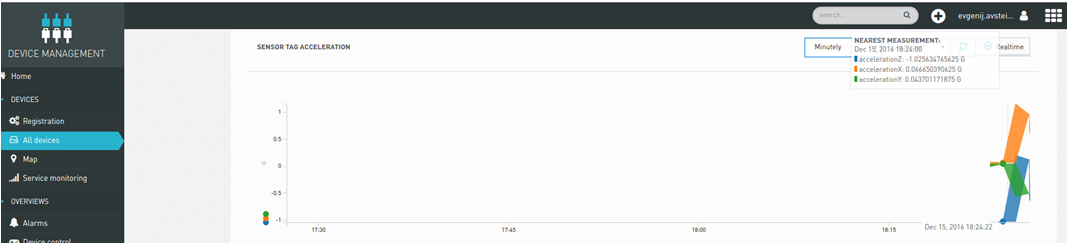
In your Cumulocity tenant, the data points for the Sensor Tag will be displayed on the graphs in the dashboard of your smartphone and as measurements in the Device Management application.
To detach the Sensor Tag from your smartphone, press Remove on its card.
The Cloud Sensor App can receive real-time control commands from Cumulocity.
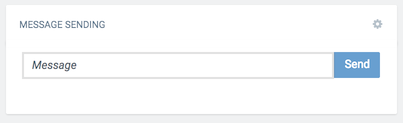
The Messaging widget, for example, can be used to send text notifications to the smartphone. The vibration relay control can be used to turn on/off the vibration motor.
Create a dashboard for your smartphone device as described in Creating a dashboard in the Cockpit section.
Add the Messaging widget to the dashboard, for details see Widgets collection.
To send a message from Cumulocity, enter a text into the Messaging widget and click Send.
The message will appear as a pop-up on the screen of your smartphone.
If the vibration switch is turned on, the smartphone will start vibrating until the switch is turned off again.
Info: The smartphone must remain connected to the platform to receive these commands.
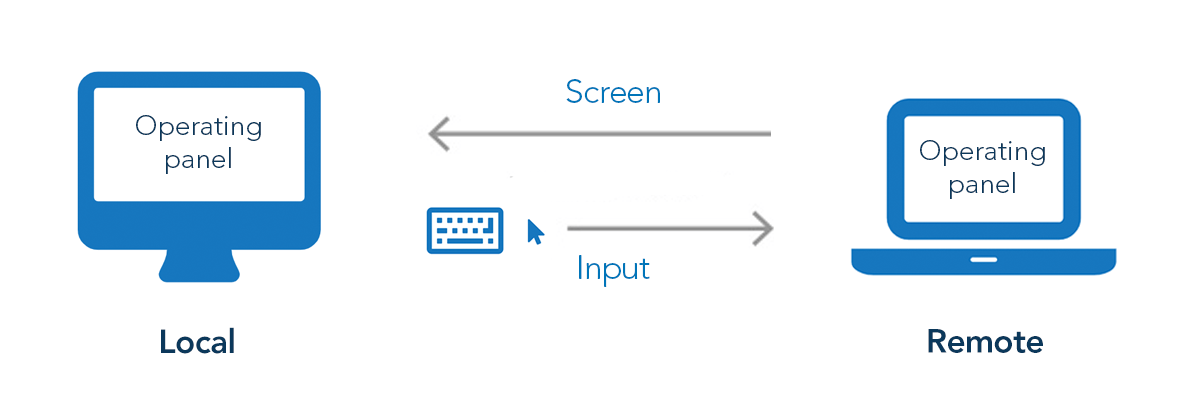
The Cumulocity Cloud Remote Access microservice allows you to remotely access operating panels and other devices via a web browser.
To provide the best level of control, remote devices should be represented as devices in the Device Management of Cumulocity, with the corresponding reporting, remote control and real-time functionality.
In some cases however, it is not possible or not economic to implement every aspect of a machine or remote device in a Cumulocity agent. For example, it might be a legacy device that does not have APIs for accessing certain parts of the functionality, or it may have many very low-level configuration parameters that would be very involved to map to Cumulocity.
In this case, you can use Cloud Remote Access to securely manage remote devices. The benefit is that you manage the device in the same way as if you had it physically close to you.
Important: Be aware that using Cloud Remote Access includes administrative intervention:
- Often, devices have no detailed permission management, so you give a user very fundamental access to the device.
The following protocols are supported:
The following gateways are supported:
Cloud Remote Access is a secure way to directly access remote devices through a web browser.
The following protocols are supported:
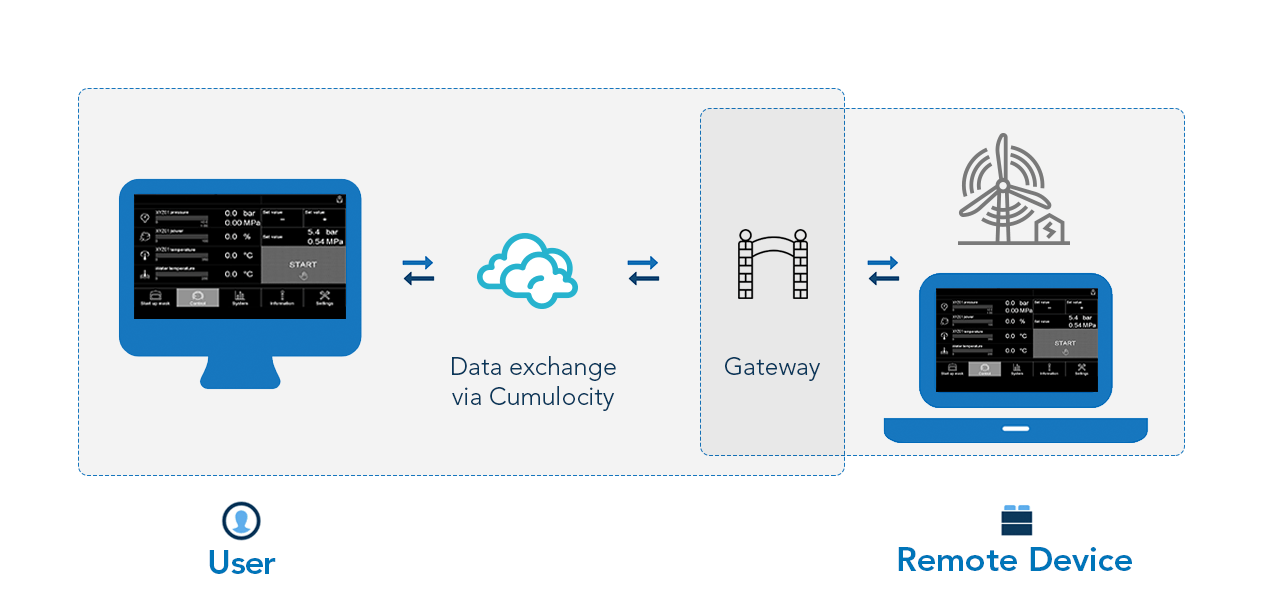
Cloud Remote Access works as in the illustration below. The remotely controlled device runs a VNC, SSH or Telnet server and is connected to a gateway compatible with Cloud Remote Access. This gateway must be registered as a device within the Device Management application in Cumulocity. More information about registering devices and instructions can be found in Device Management > Device Registration in the User guide.
With Cloud Remote Access users can
The connection to remote devices is securely encrypted through TLS technology. Additionally, passwords are encrypted in your Cumulocity account, so that you do not need to manage them elsewhere.
Cloud Remote Access is available in the Device Management application.
To use Cloud Remote Access, the following prerequisites have to be met:
Click All devices and select the desired gateway from the device list.
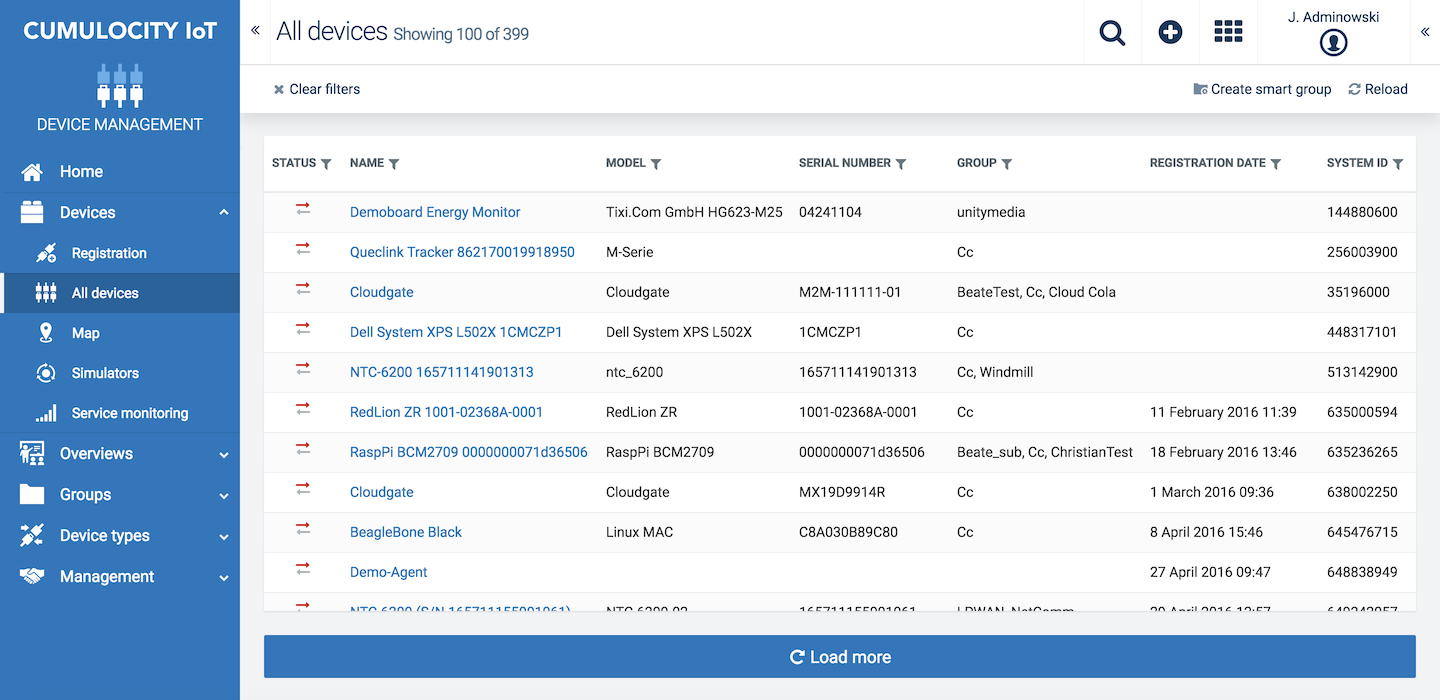
When you open the gateway you will find the Remote access tab in its tab list.
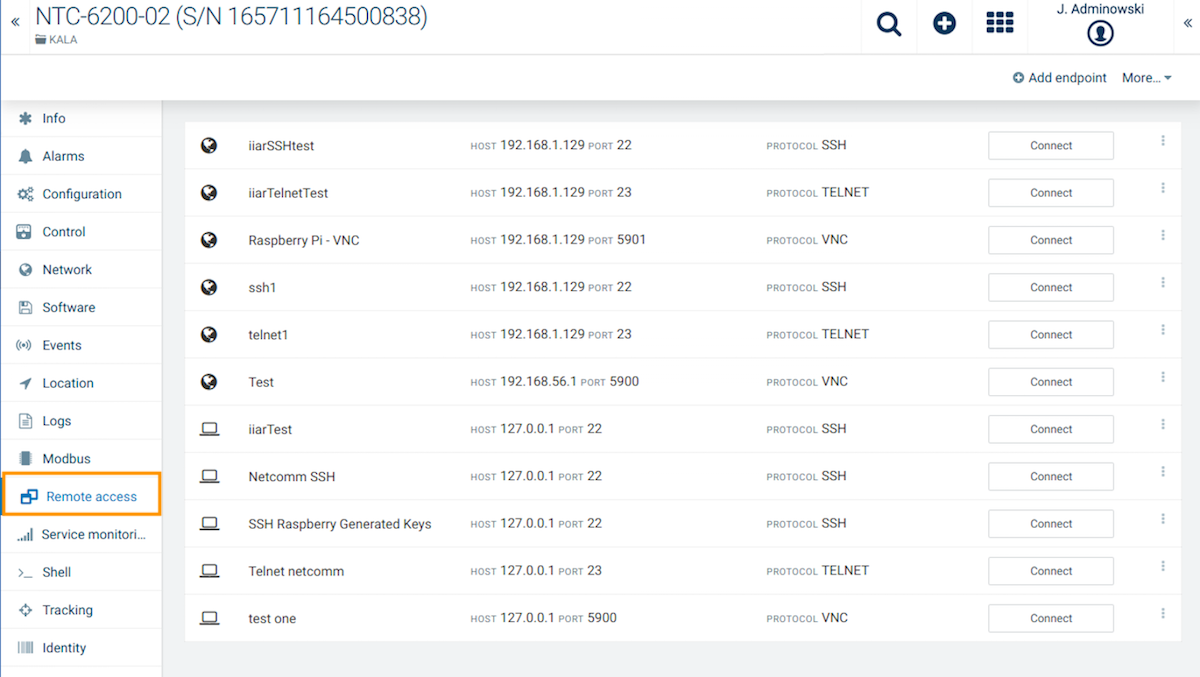
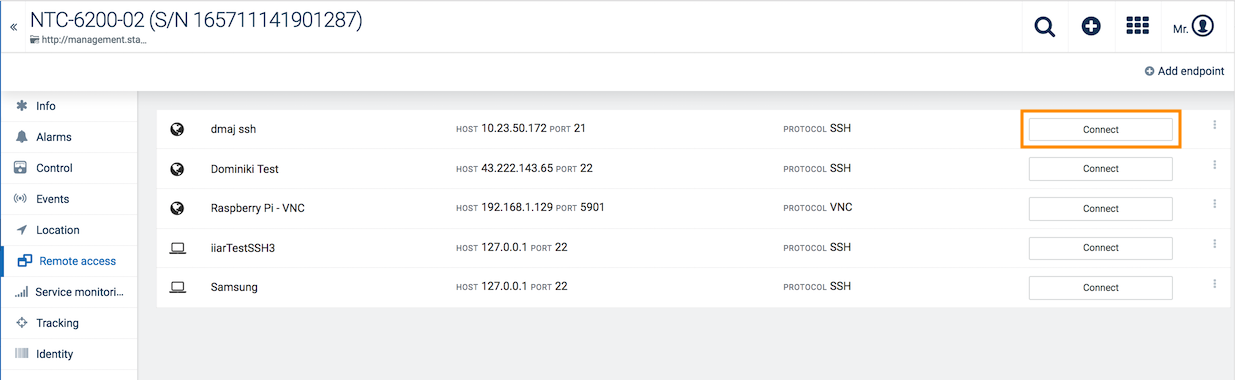
In the Remote Access tab, you can configure devices for remote control, so-called “endpoints”, and connect to remote devices.
Connections can be established to the gateway itself (localhost) or to any device in the local area network reachable by the device.
Info: If the prerequisites are met and you do not see the Remote access tab in the tab list of your gateway, please contact sales@cumulocity.com.
Info: If you are a gateway manufacturer and would like to support Cloud Remote Access on your gateway, please contact us via empower.softwareag.com.
The “endpoint” is the IP address and port of the VNC, SSH or Telnet server running on the remote device. The IP address and port need to be reachable from the gateway.
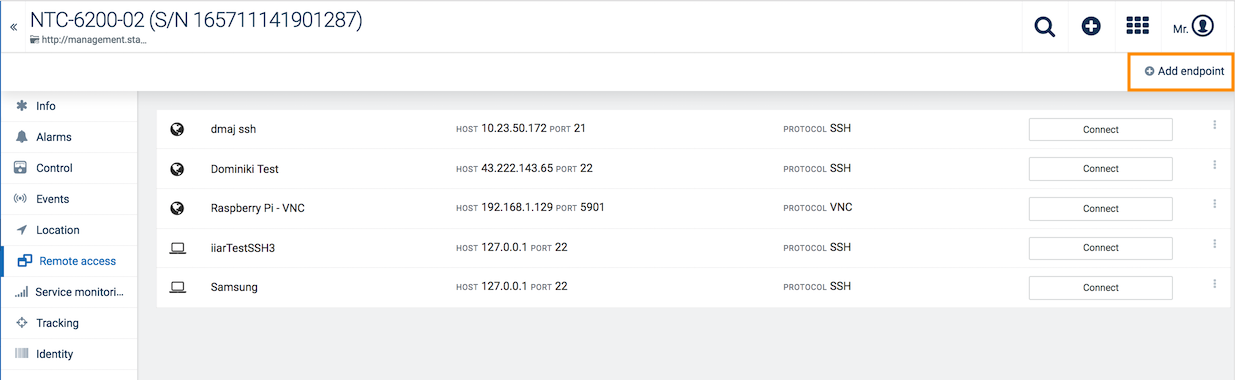
To configure new remote devices, click Add endpoint. Follow the descriptions below for configuring the various types of endpoints.
Info: To be able to configure an endpoint, you need ADMIN permission for “Remote access” and “Device control”. To read data, a READ permission is sufficient. For more information on permissions, refer to Administration > Managing permissions in the User guide.
To configure a remote access endpoint via VNC, enter a description for the remote access endpoint, the IP address and port, and the password of the VNC server. Click Save to add the endpoint to the list.

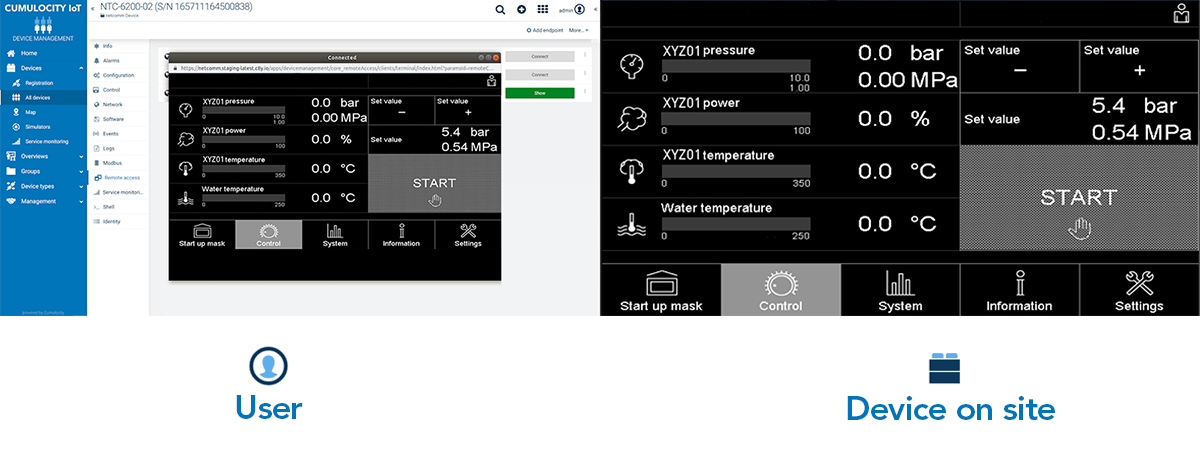
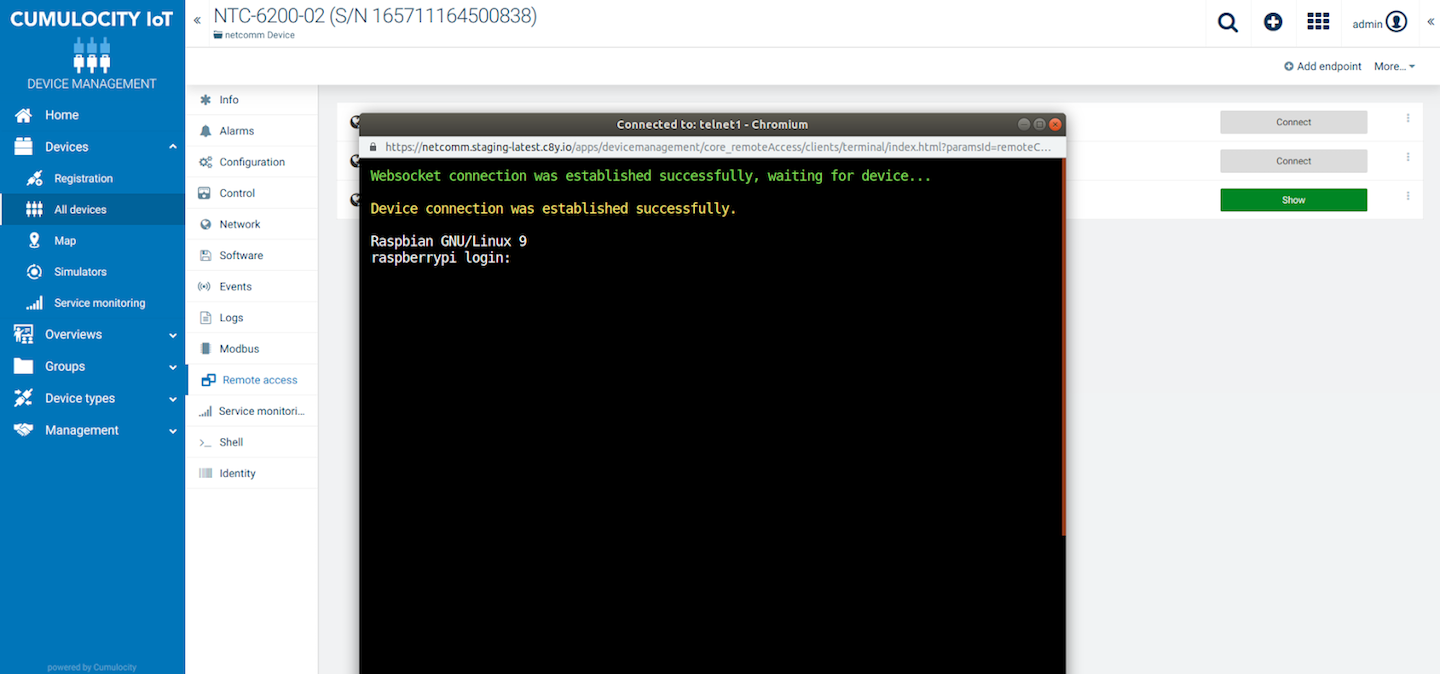
Once the connection is established, a new browser tab will open displaying the front screen or operating panel of the remote device you are connected to. The top bar of the screen will show “starting VNC handshake” when the process is starting.
Enter the name of the endpoint. Select the Telnet protocol from the dropdown menu. Enter the IP address and the port. When ready, click Save.
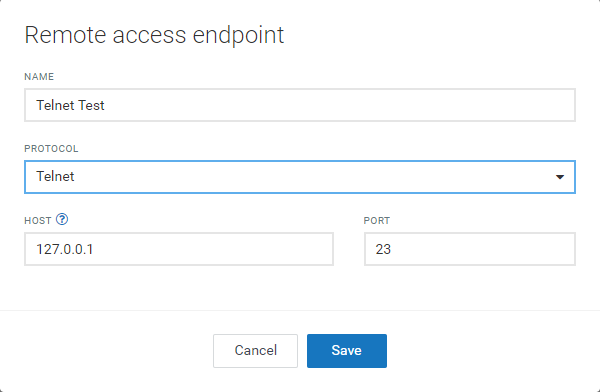
Important: Be aware, that Telnet is considered to be an insecure protocol lacking built-in security measures. For network communication in a production environment we highly recommend to use the SSH protocol instead.
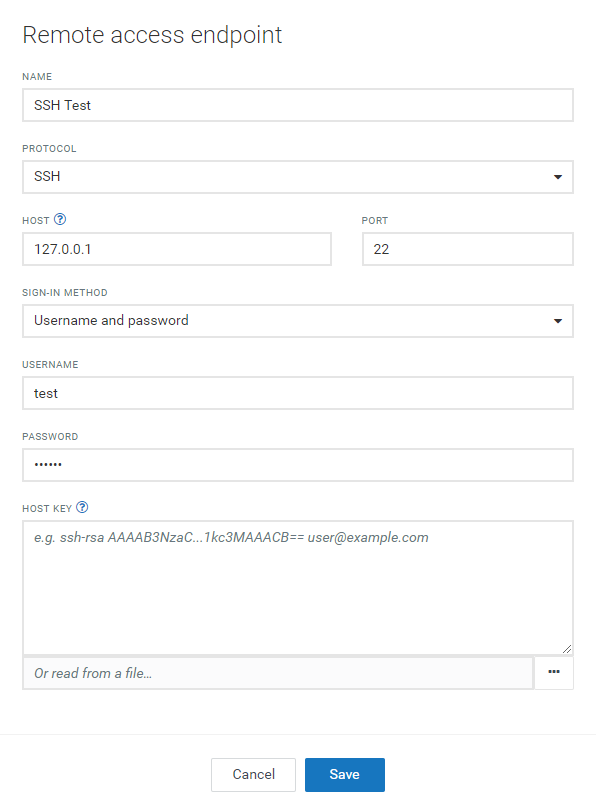
To configure a remote access endpoint via SSH, enter the name of the endpoint, select the “SSH” protocol from the dropdown list, and enter the IP address and the port. There are two Sign-in methods to be selected:
Username and password: If this method is selected, it is mandatory to enter username and password.
Public/private keys: Automatically generate public and private keys or simply paste pre-generated keys. The keys can also be uploaded from a file.
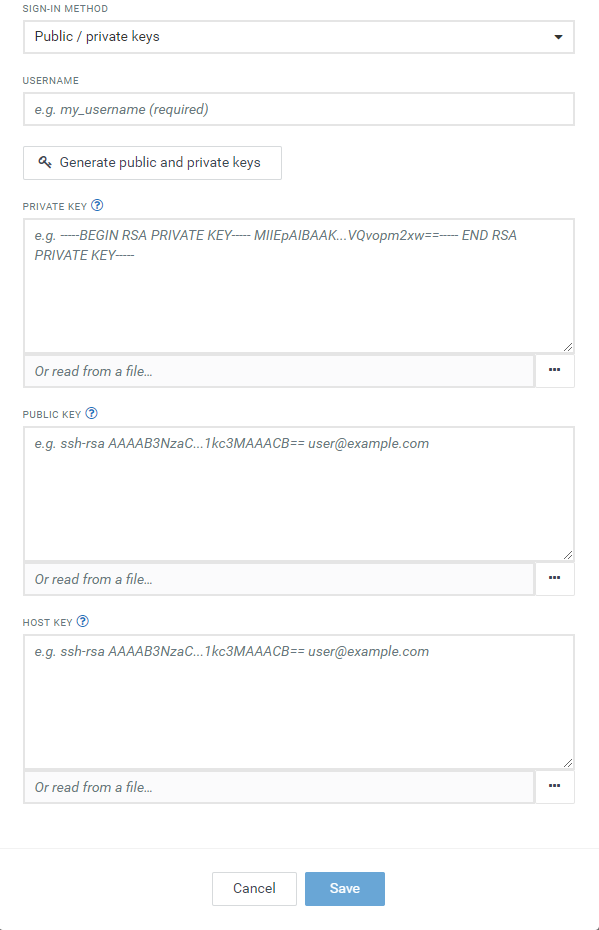
Info: The public key needs to be installed on the remote device as authorized_key.
Optionally, you can also add a host key to ensure connection to the correct device. This key can also be uploaded from a file.
Click Save to save your settings.
The following formats are supported when adding new keys:
The following algorithms are supported when adding new keys:
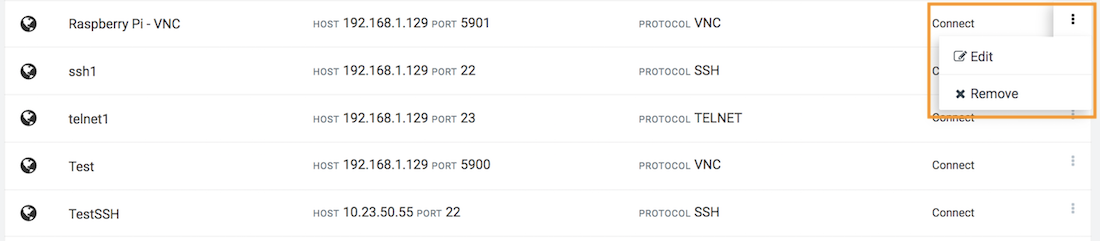
To edit or remove an endpoint, click the menu icon at the right of a row and select Edit or Remove from the context menu.
A host key is a public key of the server which is generated when an SSH server is installed. It is used to verify the identity of the server.
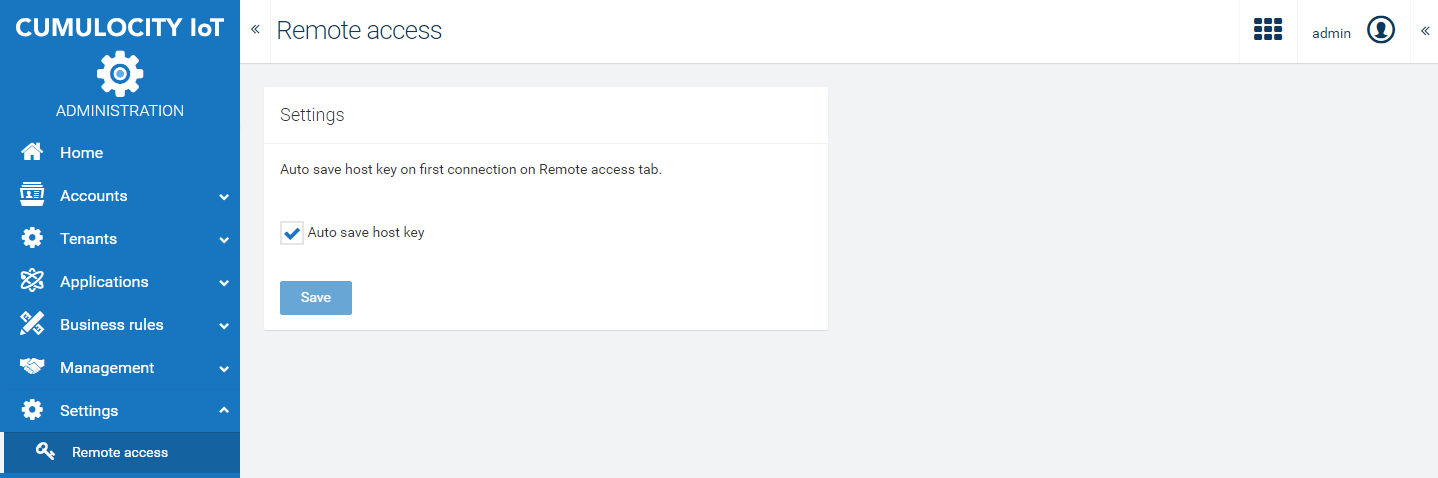
By enabling the auto-saving host key functionality you will no longer need to enter the host key after each connection. Instead, the host key can be automatically saved after the first successfully established connection to a remote access endpoint.
In order to enable the auto-save host key functionality, navigate to the Remote access page under the Settings menu in the Administration application. Activate the checkbox and then click Save.
To connect to configured endpoints, choose an endpoint in the Remote access tab and click Connect.
The connection to the configured remote device is established and the VNC, SSH or Telnet screen is shared in the client area.
To terminate the connection, click Disconnect.
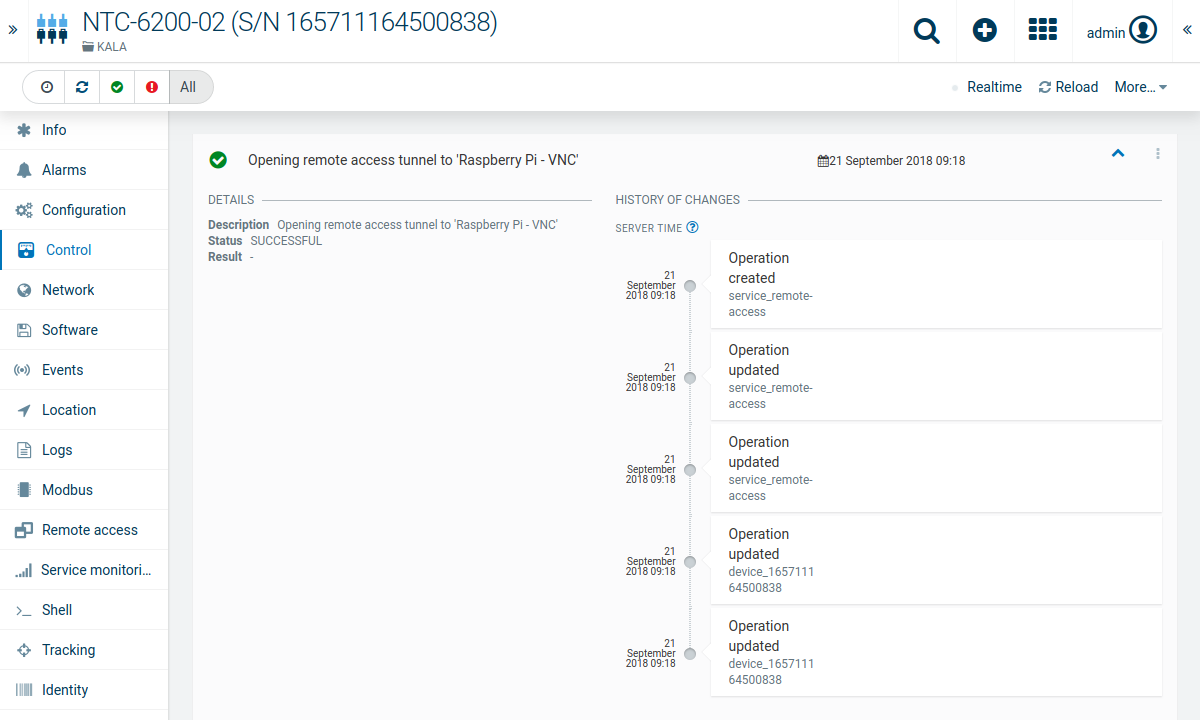
Audit logs are available for each gateway device.
For each connection the Cloud Remote Access microservice creates an operation in scope of the current user. The operation then will be updated by the device to reflect the current status. Finally the operation will be in state SUCCESSFUL or FAILED.
The audit logs can be found in the Control tab of the gateway device.
The following versions of the VNC protocol are currently supported:
The functionality has been tested on the following VNC servers:
The following operating systems/browsers are currently supported:
| Operating system | Browser | Touch | Swipe | Keyboard | Pointer |
|---|---|---|---|---|---|
| Windows 10 | Edge 38 | Yes | Yes | Yes | Minor |
| Windows 10 | Internet Explorer 11.5.6.7 | Yes | Yes | Yes | Minor |
| Windows 10 | Firefox 51 | Yes | Yes | Yes | Yes |
| Ubuntu 16.04 | Chrome 56 | Minor | Yes | Yes | Yes |
| Ubuntu 16.04 | Firefox 51 | Minor | Yes | Yes | Yes |
| MacOS | Safari | Yes | Yes | Yes | Yes |
| iOS 10.2.1 | Safari | Yes | Minor | No | n/a |
| Android 6.0.1 | Chrome | Yes | Minor | No | n/a |
| Android 6.0.1 | Stock browser 5.0 | Yes | Minor | No | n/a |
The following limitations apply to Cloud Remote Access for Telnet:
| Area | Scrolling | Reflow on width change | Bitmap fonts | Vector fonts | Mouse tracking | Application keypad | Tabs | Split screen |
|---|---|---|---|---|---|---|---|---|
| Console | Yes | No | Yes | Yes | Yes | Yes | ? | Yes |
| xterm | Yes | No | Yes | Yes | Yes | Yes | No | No |
For Cloud Remote Access for SSH the same limitations as mentioned for Telnet apply (see above). Also the following additional limitations are known:
Endpoints cannot be set up
If you cannot set up new endpoints, check if you have sufficient permissions.
To set up new endpoints, you need ADMIN permission for “Device control” to be able to register a device and ADMIN permission for “Remote access” to be able to add an endpoint.
To establish a connection to a remote operating panel, a READ permission for “Remote access” is sufficient.
For more information on permissions, refer to Administration > Managing permissions in the User guide.
Connection fails
The connection via a gateway to a remote VNC, SSH or Telnet server can fail because of network problems. In this case you need to contact your network administrator.
Unsupported protocol version
In case of Real VNC, if you get an error message stating that you are using an unsupported protocol version (e.g. 005.00x), try the following workaround:
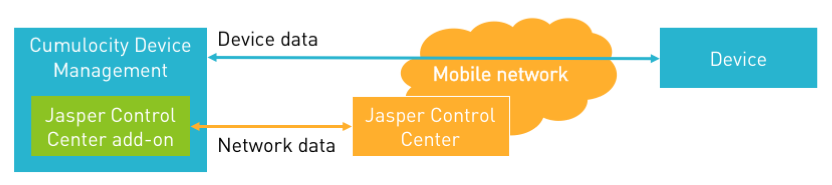
The Connectivity agent, which works from within the Cumulocity Device Management application, provides basic information on mobile devices and additional connectivity details.
Cumulocity integrates with the SIM connectivity management platform Jasper. For the SIM connectivity management platforms Comarch and Ericsson, Cumulocity provides an experimental implementation. For more details, please contact our support team.
The following features are supported by these providers:
| Feature | Jasper | Ericsson | Comarch |
|---|---|---|---|
| Check the status of the SIM card in the device | x | x | x |
| Check the online status of the device as reported by the network | x | x | x |
| Change SIM card status, for example activate or deactivate it | x | x | x |
| Disconnect SIM card from current session | x | ||
| Communicate with the device through text messages, for example, to set APN parameters | x | x | |
| View summary usage of data traffic, text messages and voice calls | x | x | x |
| View usage details of data traffic, text messages and voice calls | x | x | |
| View the history of data sessions and any changes to the SIM card or traffic | x |
As you can see, Jasper currently is the most feature-rich provider.
The following description is primarily based on Jasper, but the same configuration and usage also applies to the other providers. If there are any differences, they will be stated explicitly.
The following sections describe:
The following steps describe how to create a dedicated user in the Jasper Control Center. This user is used for all access from Cumulocity to Jasper Control Center, so the permissions of the user have influence on functionalities available in Cumulocity.
Info: In a similar way, we recommend to set up a dedicated user for Ericsson or Comarch to get the credentials required to connect to Cumulocity. Ask your administrator or our support team for further information.
Besides the user, you also need a so-called API license key (only required for Jasper) and API server URL. To determine your API license key and API server URL, use a Control Center administrator user to log in to your Control Center account and click API integration on the Control Center home page. Your API license key and the API server URL are displayed on the top left.
To create a user in Jasper Control Center perform the following steps:
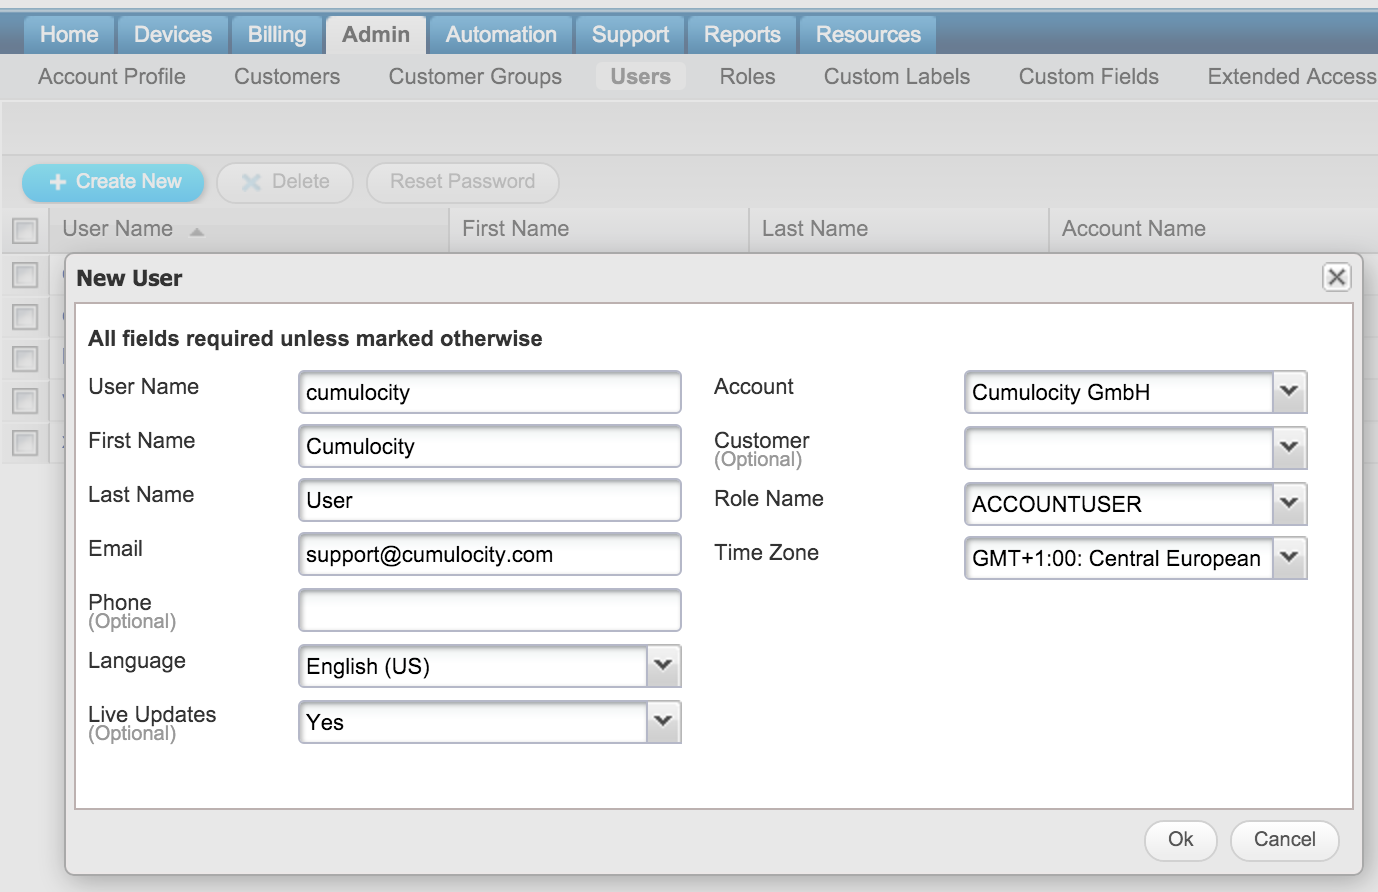
The user is now created but does not have a password yet. Follow the instructions emailed to you by Control Center to set a password.
Process the following step to configure the connectivity in Cumulocity:
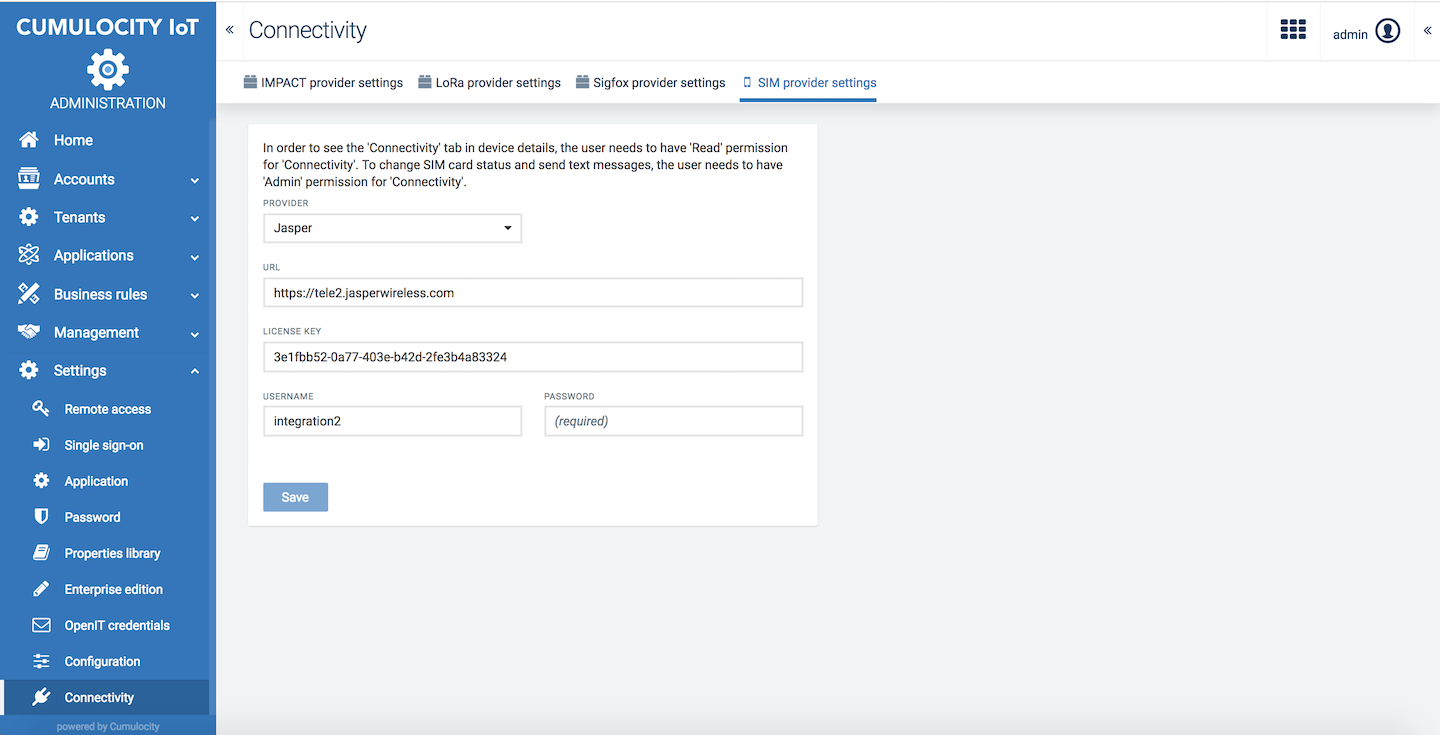
The Connectivity agent is now set up.
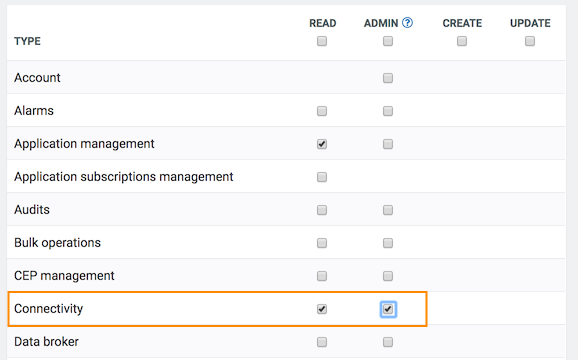
Switch to the Device Management application and navigate to a device that is connected through a SIM card managed by the SIM provider of your choice. The device should have a Connectivity tab. If this tab is not shown,
To assign permissions, navigate to the Administration application and make sure that your user has a role assigned with READ or ADMIN permission for Connectivity.
Jasper and Comarch identify SIM cards through their ICCID (Integrated Circuit Card Identifier). Ericsson is using MSISDN (Mobile Station International Subscriber Directory Number) instead. In most cases, devices will report the ICCID and MSISDN of their SIM card automatically to Cumulocity.
If the ICCID is not shown automatically check the following:
Note that it may take a few seconds until the tab appears for the first time on a device, as Cumulocity checks if the particular SIM card is managed by the SIM provider.
In the Connectivity tab you will find the following sections:
Info: Some sections may not appear or may be empty. For example, if there have been no SMS sent and you do not have permission to send SMS, you will not see the SMS section.
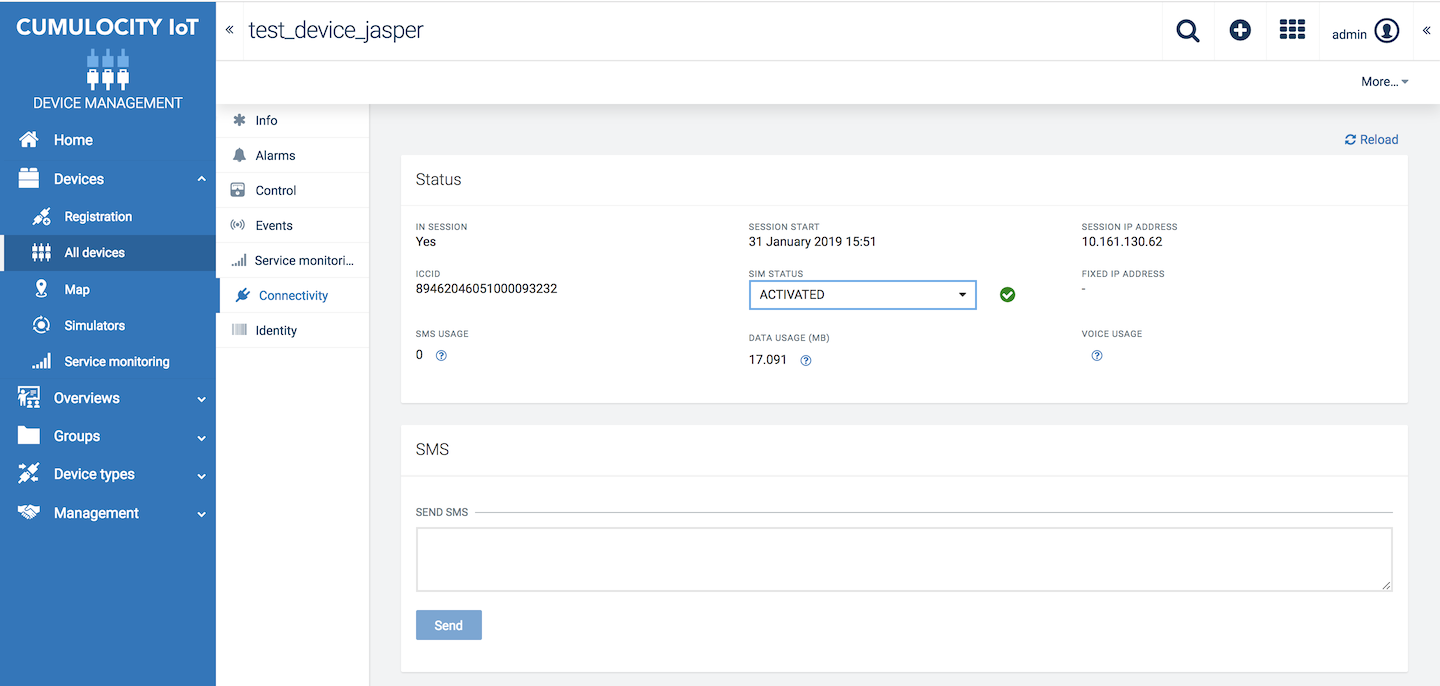
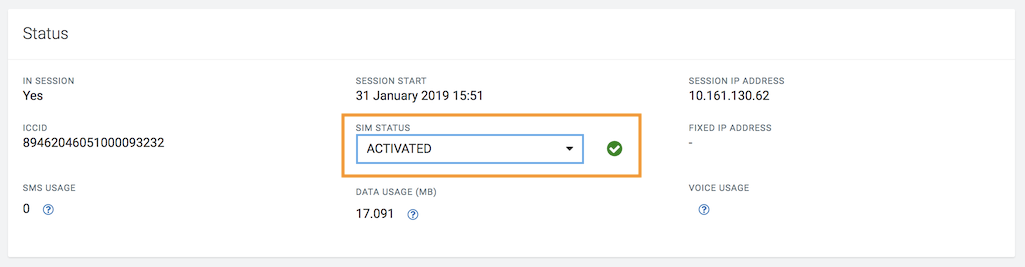
The Status section lists summary information for the SIM card.
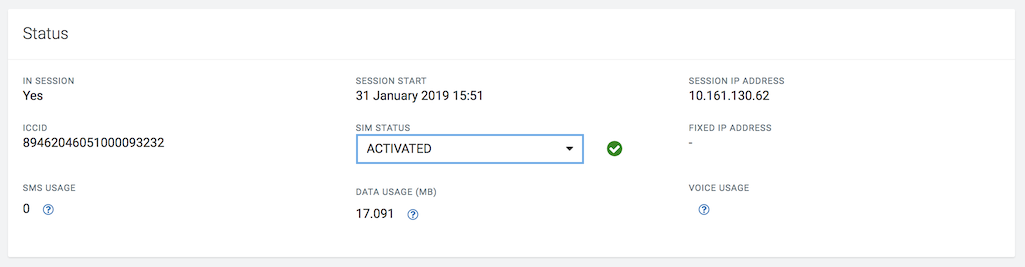
The first row shows if the device is currently running a data session. If it is, the start of the session and the current WAN IP address of the device is displayed.
The second row shows further status information: The ICCID of the SIM card, the activation state of the SIM card and, if set, the fixed IP address assigned to the SIM card. Provided you have ADMIN permission for Connectivity, you can change the activation state by using the drop-down menu.
At the bottom you will find usage information for the current month, i.e. from the first of the month till today. Hovering over the tooltip shows the covered time period, including the usage during the past month.
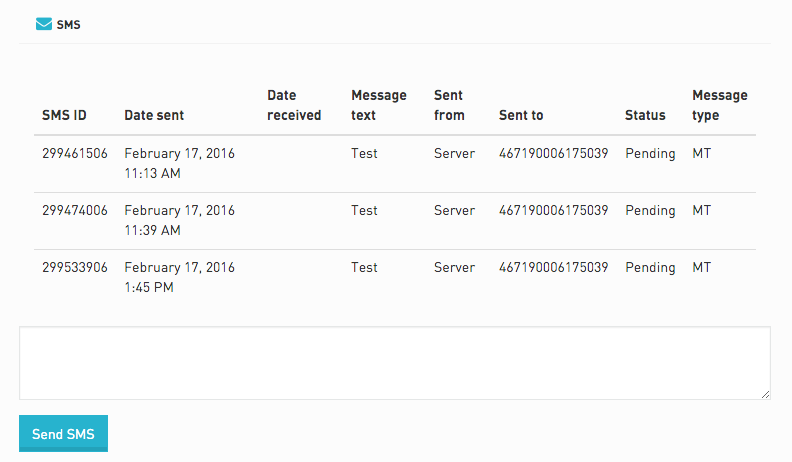
The SMS section shows the text messages sent to the device and received from the device, including information on
Provided you have ADMIN permission for Connectivity, you can also send text messages to the device by entering the text and clicking Send SMS.
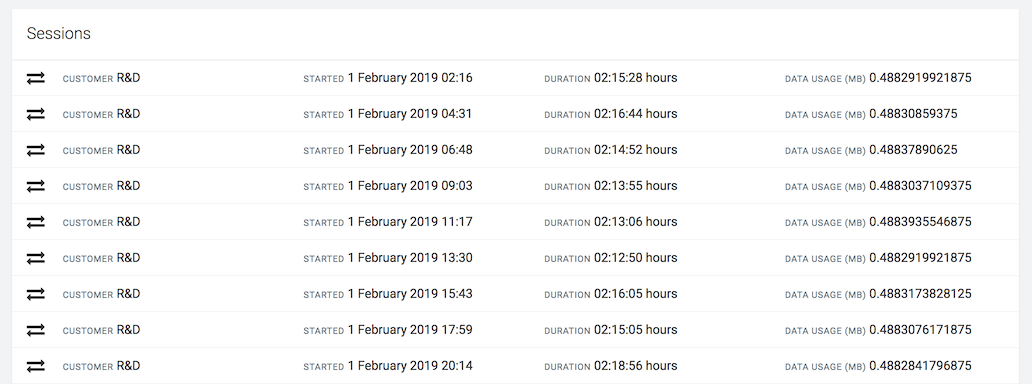
The Sessions section shows the log of data sessions carried out by the device. It lists when the session started, how long it took and how much data traffic was consumed.
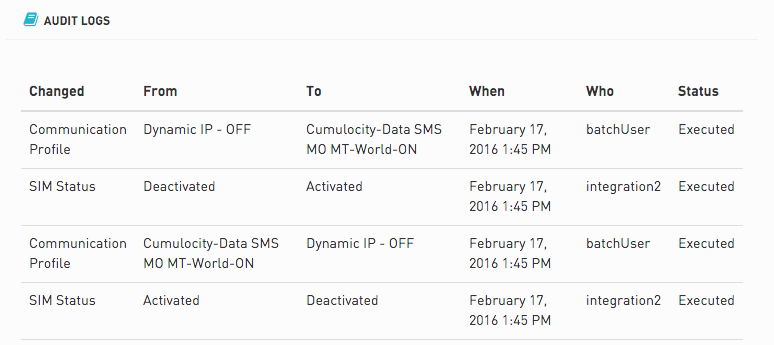
The Audit logs section lists all changes to the SIM card and its tariff. It shows the type of change, old and new values when the change was carried out by whom, and if it was successful.
The Connectivity tab does not update in real-time. To show current data, click the Reload in the top menu bar.
If you suspect that a device is not correctly reporting to Cumulocity, or it is not receiving commands, you can verify the connectivity status of the device.
In the Connectivity tab, check if
Data connectivity can be analyzed in various places:
The SIM details menu item requires you to have a login for Jasper Control Center. This login is independently provided by your administrator.
If the device is still not reporting to Cumulocity, there may be a configuration or software problem on the device.
This document describes
Cumulocity offers an integration with the Nokia IMPACT Data Collector which is designed to collect data from heterogeneous devices. Integrating Cumulocity with IMPACT, enables you to make use of existing Cumulocity features like connectivity monitoring, data visualization or real-time analytics with IMPACT devices.
Info: Currently only the integration of LWM2M devices has been tested.
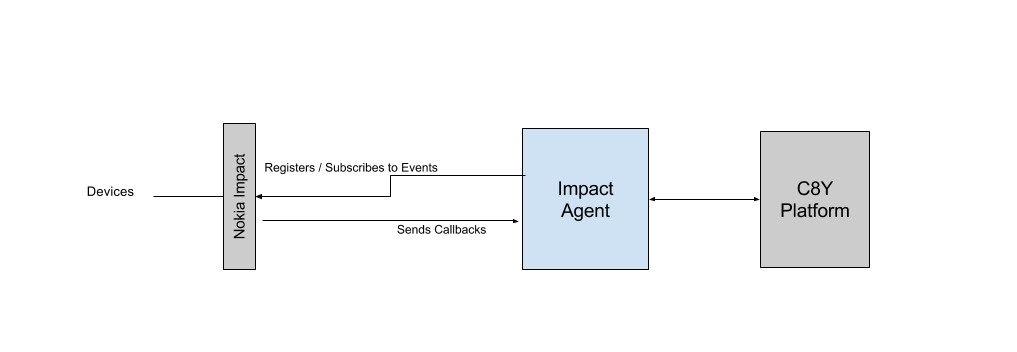
The IMPACT agent in Cumulocity registers itself at the Nokia IMPACT platform. Similarly, it subscribes to events such as devices coming online or reporting data at IMPACT.
The following illustration provides an overview on the Cumulocity IMPACT integration.
Info: Your subscription needs to include the IMPACT feature. If you do not see the functionality described in this document, please contact the Cumulocity support.
To be able to communicate with a device through IMPACT the device must be registered in IMPACT. How to register a device in IMPACT is not in the scope of this document.
IMPACT devices do not need to be registered again in Cumulocity. Cumulocity’s device lifecycle integration automatically handles the following events:
| Event type | Description | Actions triggered in IMPACT agent |
|---|---|---|
| Registration | A new device has been registered at IMPACT. | Create device in Cumulocity. Obtain list of resources provided by device (either from request or by querying device). Subscribe to all resources that are mapped as “Auto-Observe” in the corresponding object mapping. |
| Deregistration | A device has been deleted in IMPACT. | At IMPACT, unsubscribe from all resources for this device. |
| Expiration | A device registration in IMPACT has expired. | Mark device in Cumulocity as disabled. |
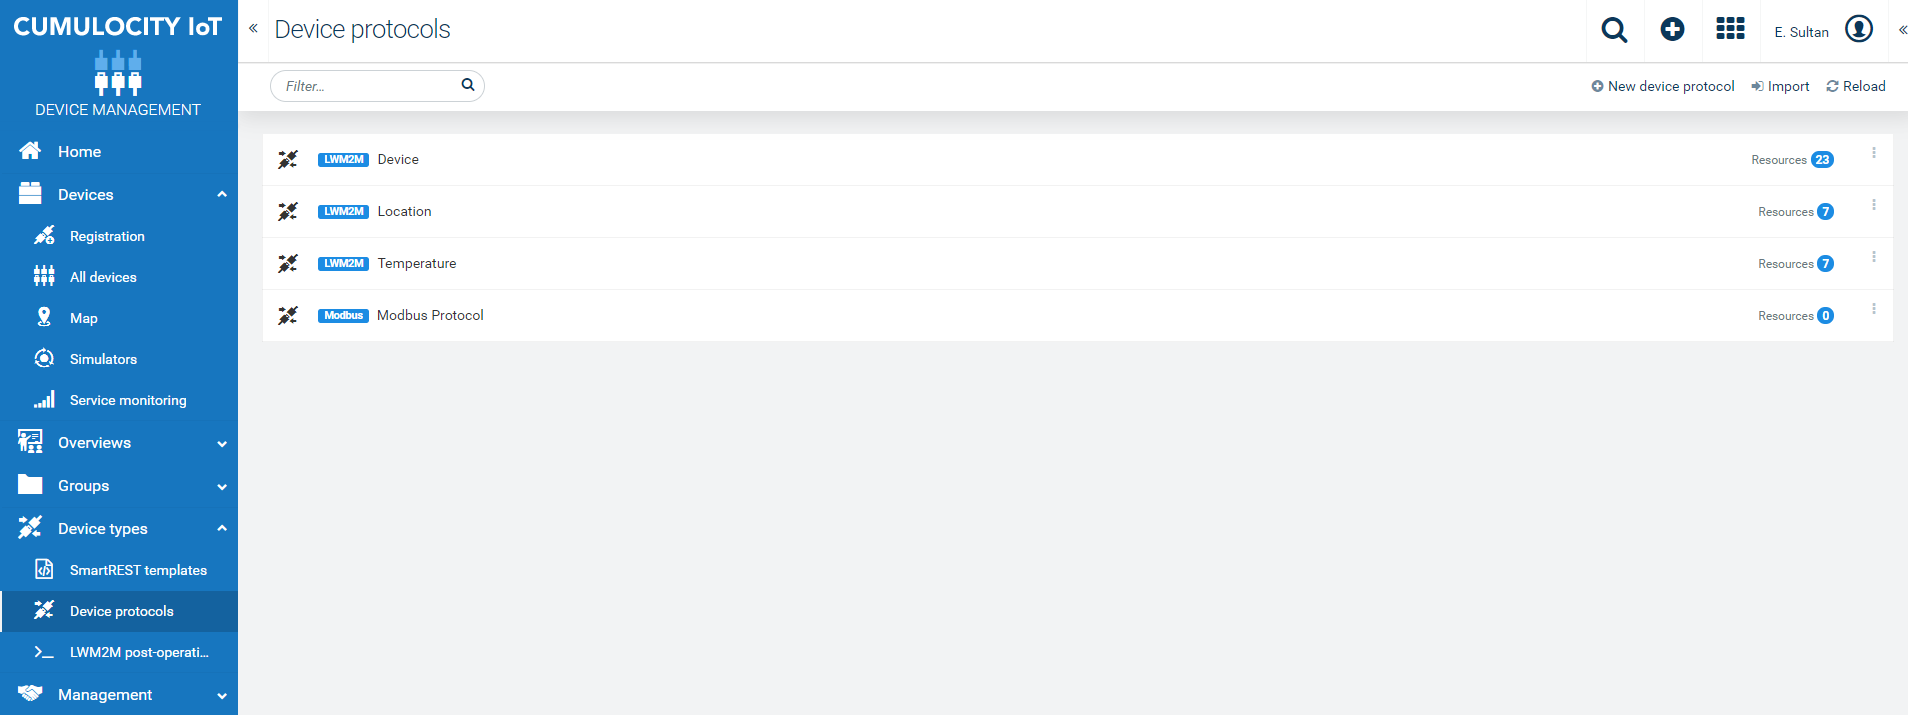
To process data from IMPACT devices, Cumulocity uses device protocols. Through device protocols you can observe your resources and perform other actions like creating alarms.
Device protocols are accessible through the Devices types menu in the Device Management application. For details on the general usage see Device protocols.
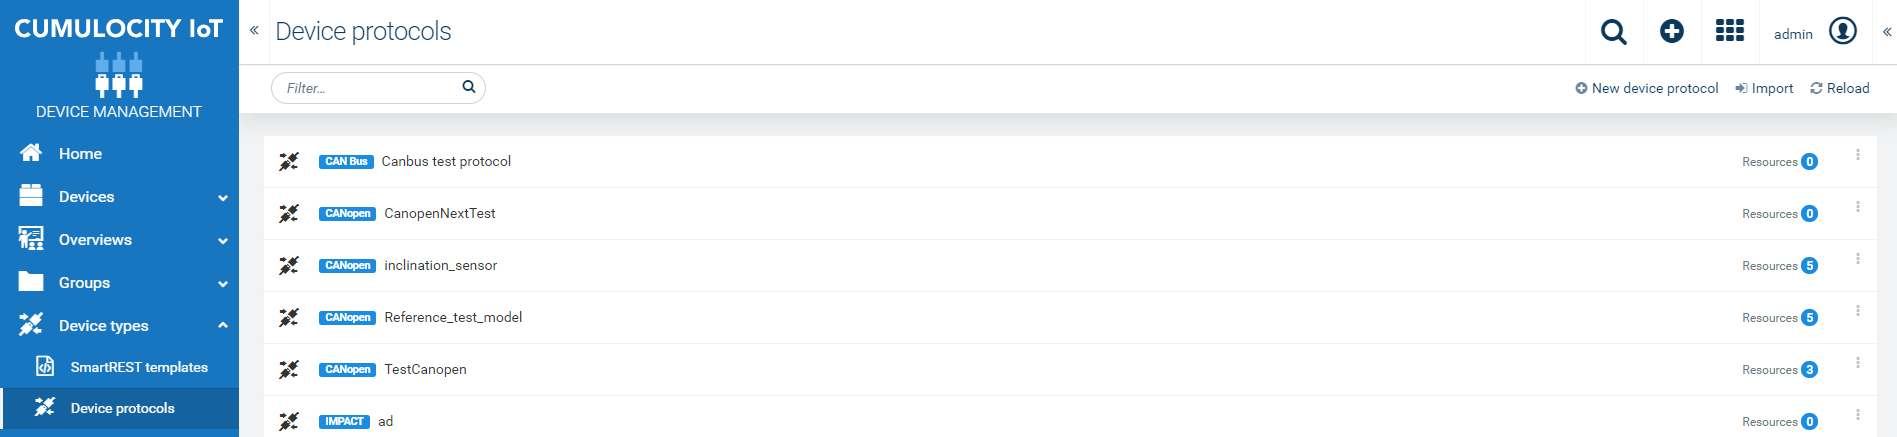
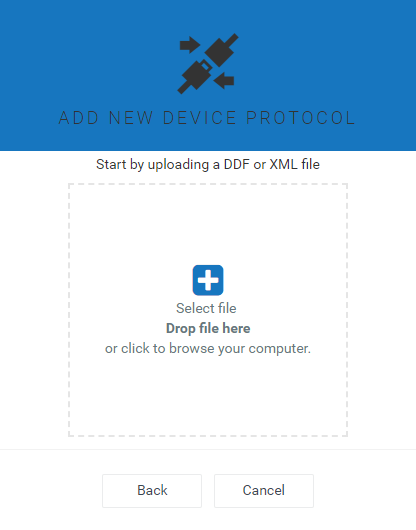
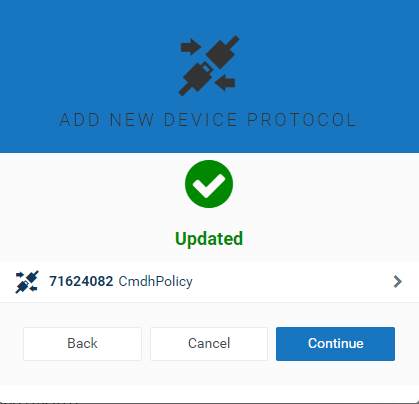
To add a new IMPACT device protocol follow these steps:
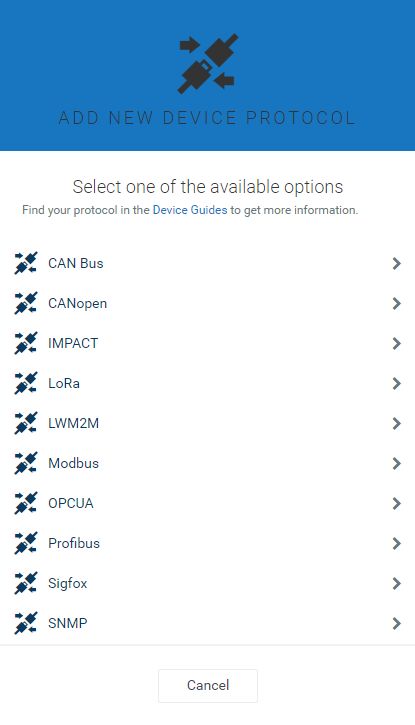
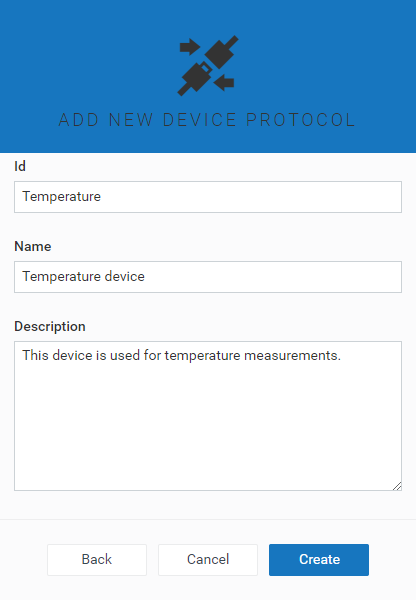
The device protocol will open in a new page.
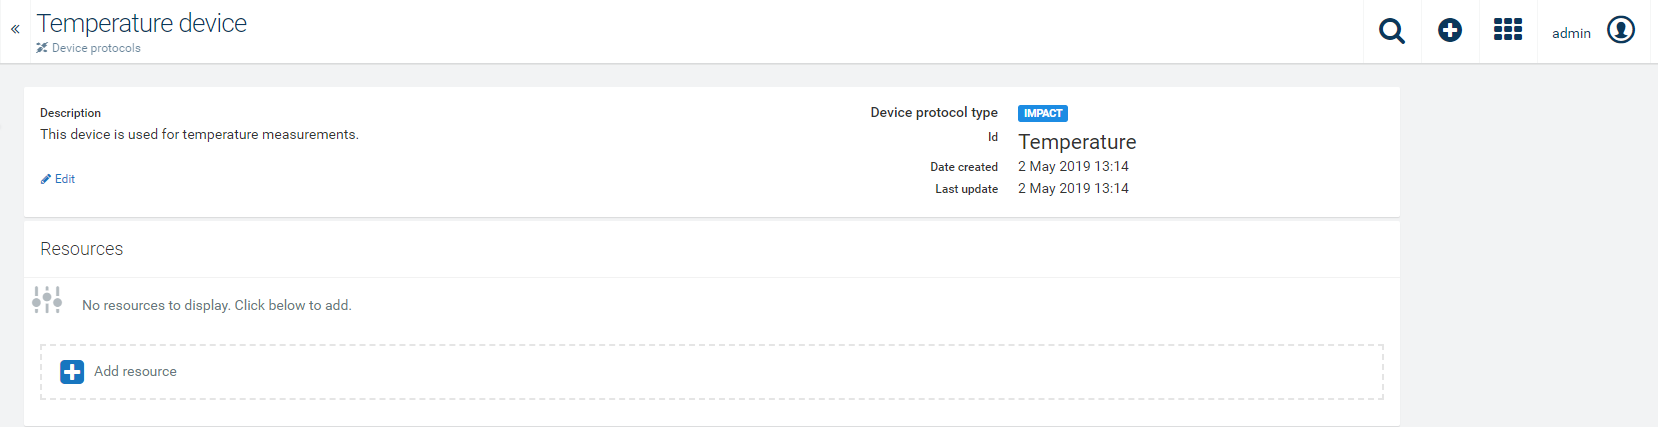
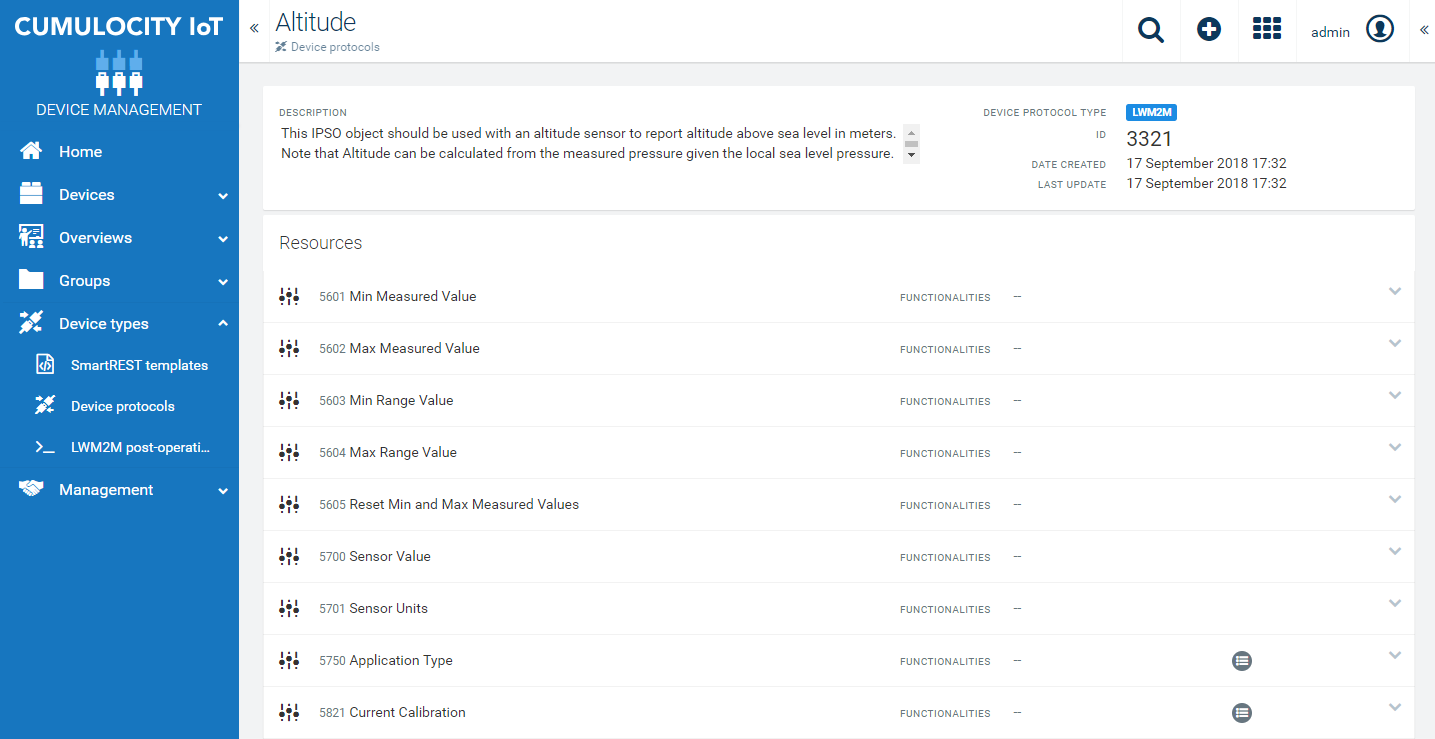
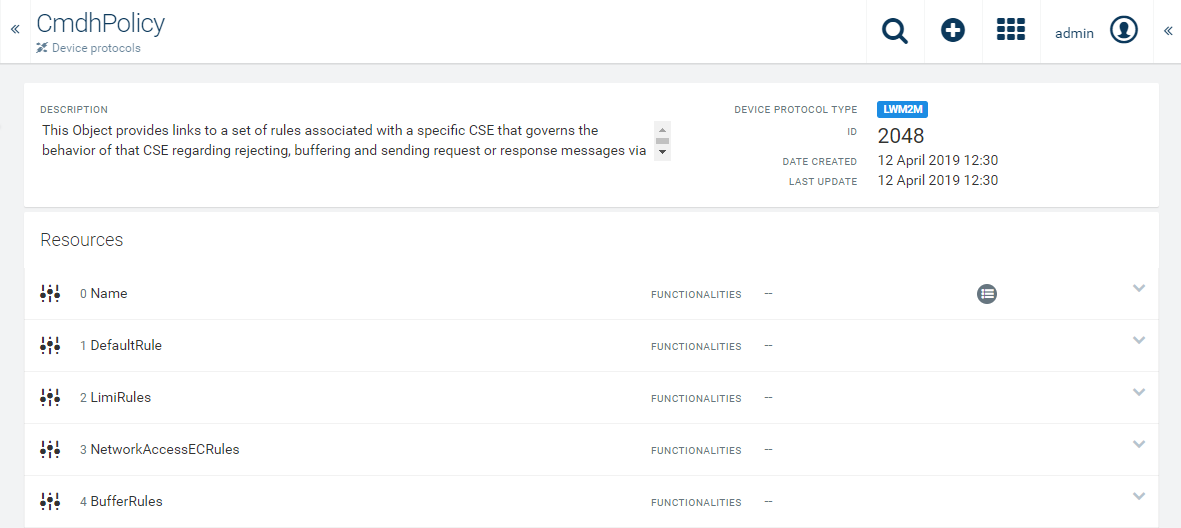
In the Device protocol page you will see the description at the top left and the ID, the creation date and date of the last update at the top right.
Below a list of resources configured for the device will be listed (which is empty when creating a new protocol), showing the ID, name and potentially configured functionalities for each resource.
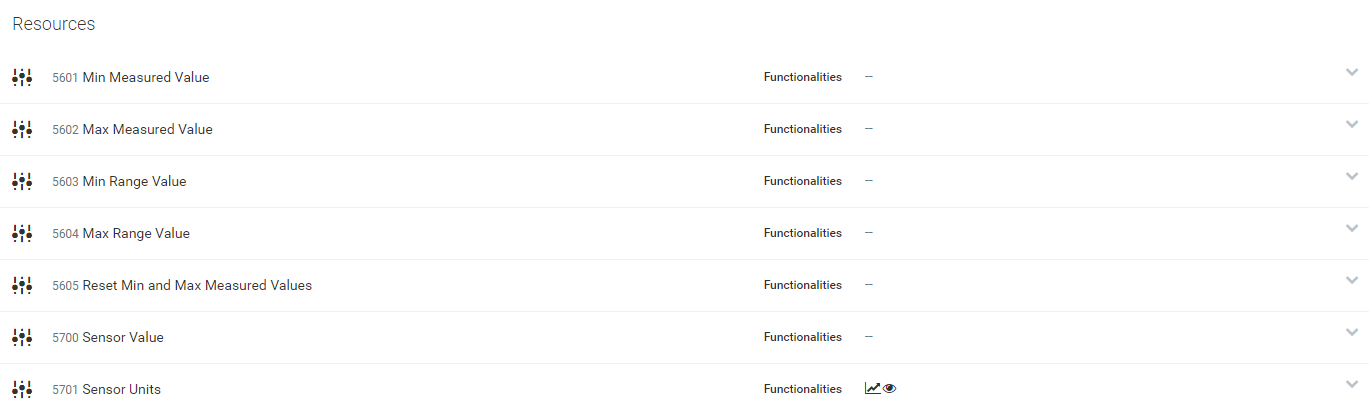
Example: Resource list for the device protocol “Temperature Measurement”:
Click Add resource at the bottom of the resource list to add a new resource to your device.
For each resource you may specify the following parameters:
| Field | Description | Required |
|---|---|---|
| ID | The ID of the resource. Must be unique within one protocol object. | Mandatory |
| Name | Name for the resource. | Mandatory |
| Type | The parameter type. May be one of BOOLEAN, STRING, INTEGER or FLOAT. | Mandatory |
| Unit | The parameter unit, e.g. Celsius, meter. | Optional |
| Instance Type | The instance type for the parameter. May be one of “Single” or “Multiple”. The default value is “Single”. | Optional |
| Description | A more detailed description of the resource. | Optional |
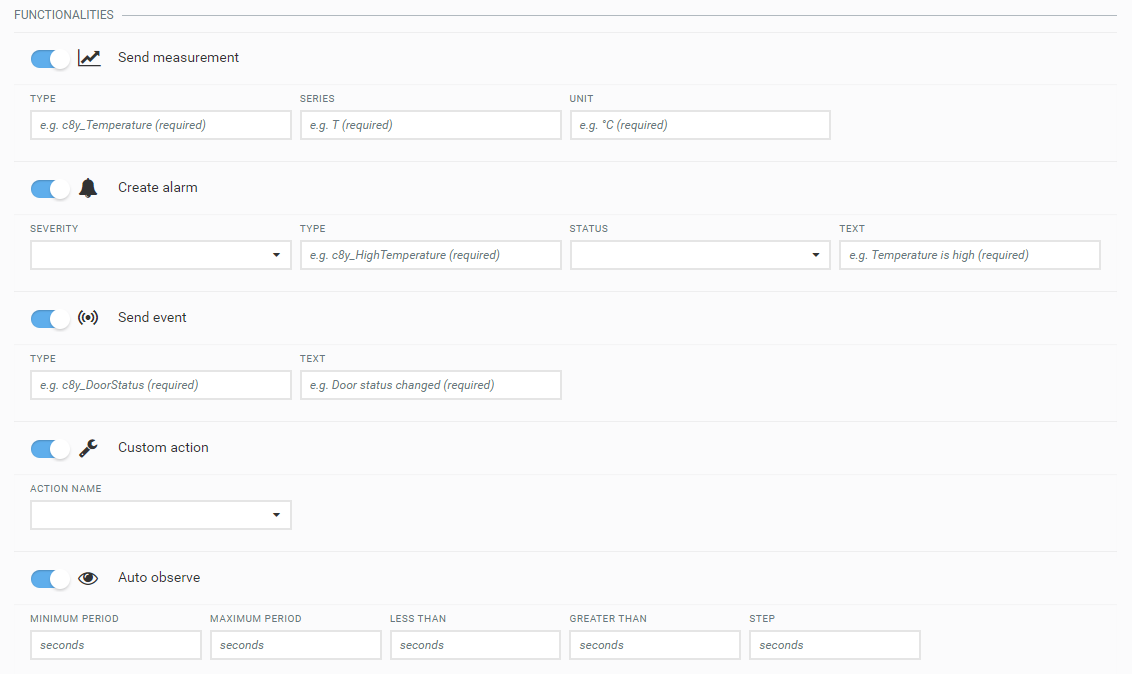
Optionally, you may turn on several functionalities for the resource:
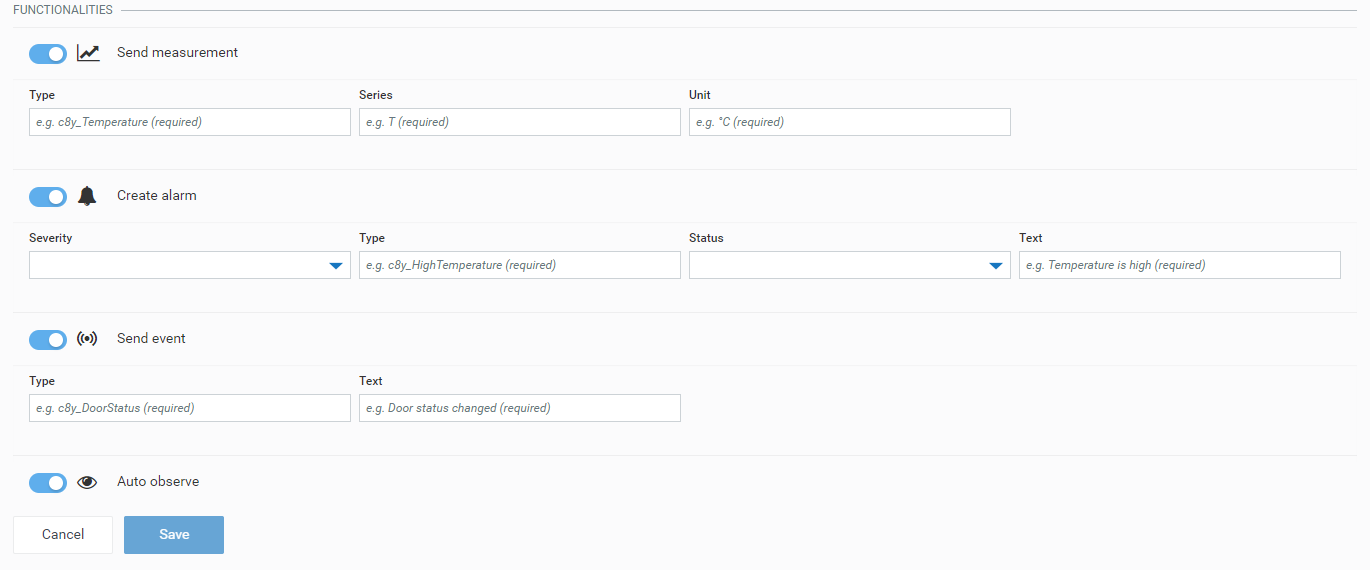
Send measurements
Turn on Send measurements to specify a measurement.
Create alarm
Turn on Create alarm if you want to create an alarm out of the resource. Specify the following parameters (all mandatory):
Send event
Turn on Send event to send an event each time a certain condition has been triggered. Specify the following parameters:
Auto observe
Enabling Auto observe for a resource means, that each time the device with this particular resource appears, Cumulocity will automatically receive all values. It is not necessary, to subscribe to it manually.
Info: At least one functionality must be set to enable Auto observe.
Finally, click Save to create the resource. The resource will be added to the resource list.
In the resources list you can see if functionalities have been turned on for a resource. Active functionalities are indicated by the related icons. In the example below, Send measurements and Auto observe are turned on.

Cumulocity can interface with LoRa devices through Actility’s ThingPark Wireless. You can:
The following illustration gives an overview of the Cumulocity LoRa Actility integration.
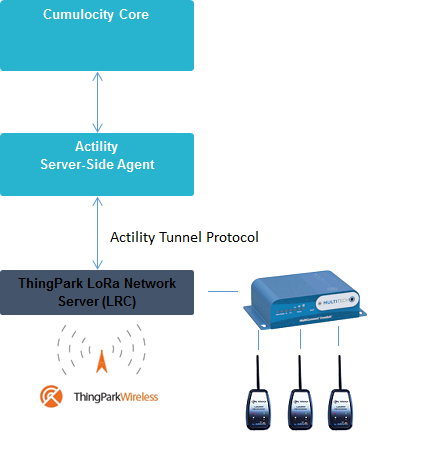
The following sections describe how to:
Note that your subscription needs to include this feature. If you do not see the functionality described in this document, please contact support.
Before using LoRa devices with Cumulocity, you need to configure your ThingPark account details in the Administration application. In order to create new credentials or replace existing ones, go to the Administration application and select Connectivity in the Settings menu in the navigator.
If you go to Connectivity for the first time, you will be asked to provide credentials and application EUI which is used for LoRa device provisioning.
Enter the following information:
Do not use the same ThingPark login (username and password) for other tenants. The profile ID, username and password are used to retrieve an access token to send further requests to the ThingPark platform. It is possible to renew the access token by replacing the account credentials.
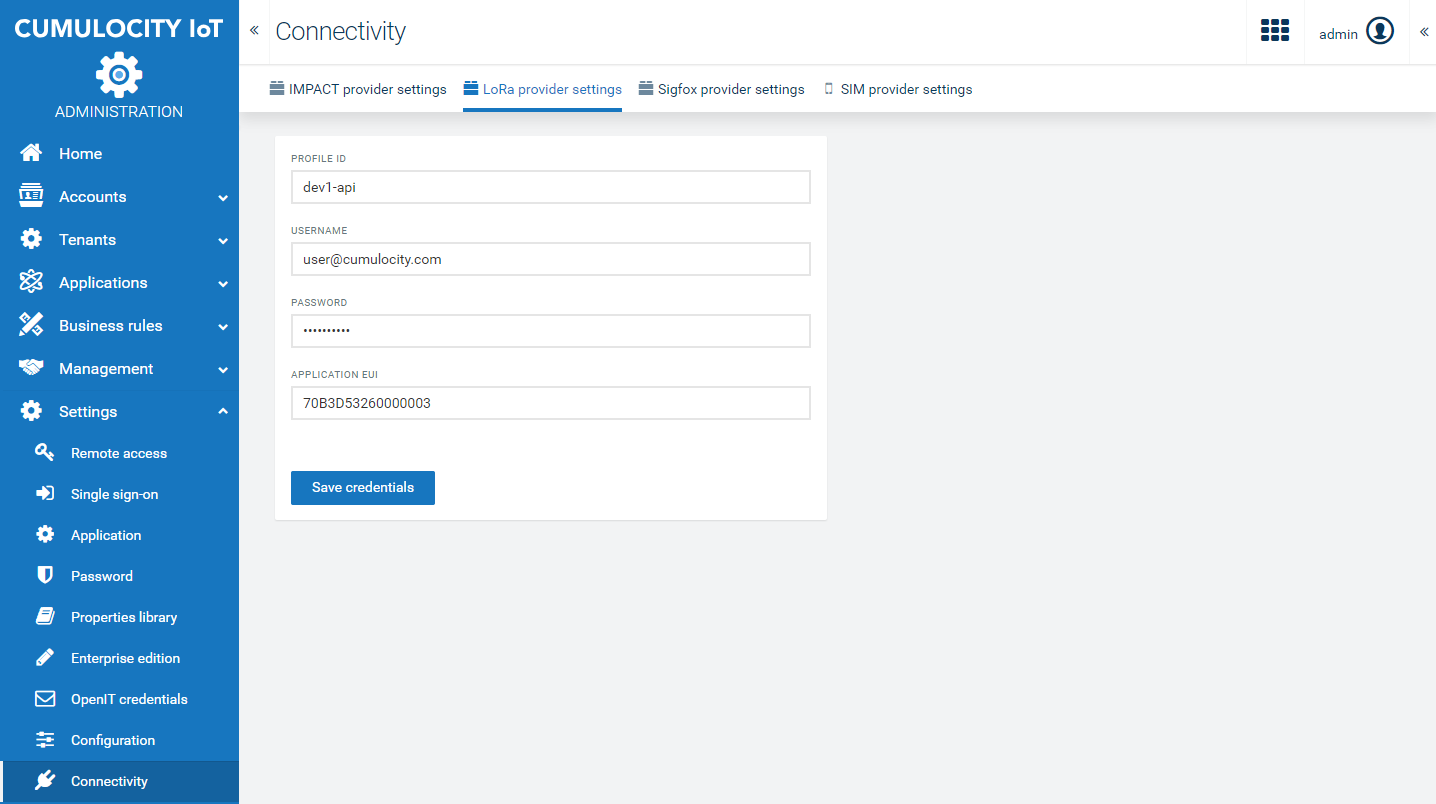
Click Save. If everything is okay, there will be a message “Credentials successfully saved”.
In order to replace your credentials, click Replace credentials.
Enter your profile ID, username, password and application EUI (for details on profile ID and application EUI see Creating new account credentials.
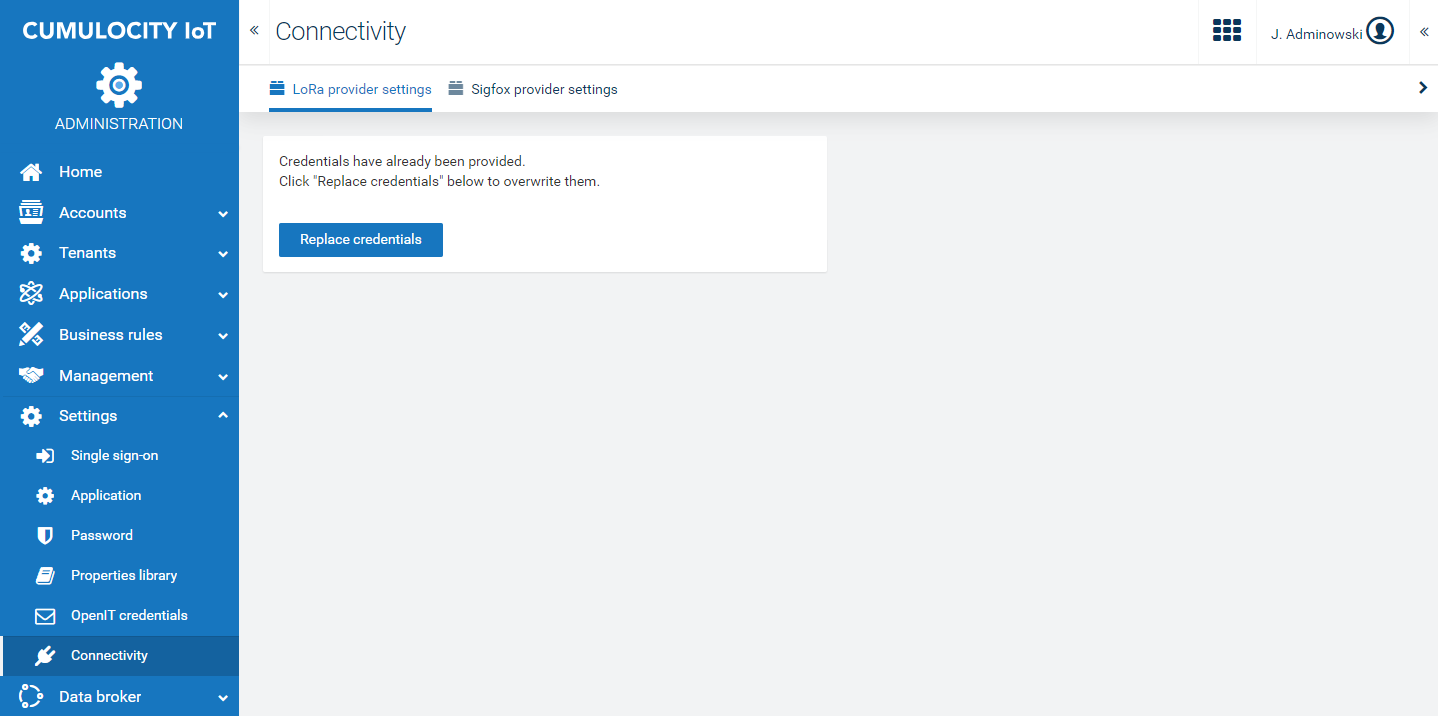
Click Save. Your old credentials will now be replaced with the new ones.
To process data from LoRa devices, Cumulocity needs to understand the payload format of the devices. Mapping a payload data to Cumulocity data can be done by creating a LoRa device protocol.
During the device registration, you can associate this device protocol. The received uplink callbacks for this device with a hexadecimal payload will then be mapped to the ones you have configured in your device protocol. If a device protocol has been changed after being associated to a device, the reflection of the change can take up to 10 minutes because of the refresh mechanism of the Actility Server Side Agent.
Info: Device protocol mapping only supports decoding for fixed byte positions based on the message type.
In order to create a device protocol, navigate to the Device Management application and select Device protocols in the Device types menu in the navigator. You can either import an existing device protocol or create a new one.
In the Device protocols page, click Import.
Select the predefined device type, for example “LoRaWAN Demonstrator” or upload from a file. Click Import.
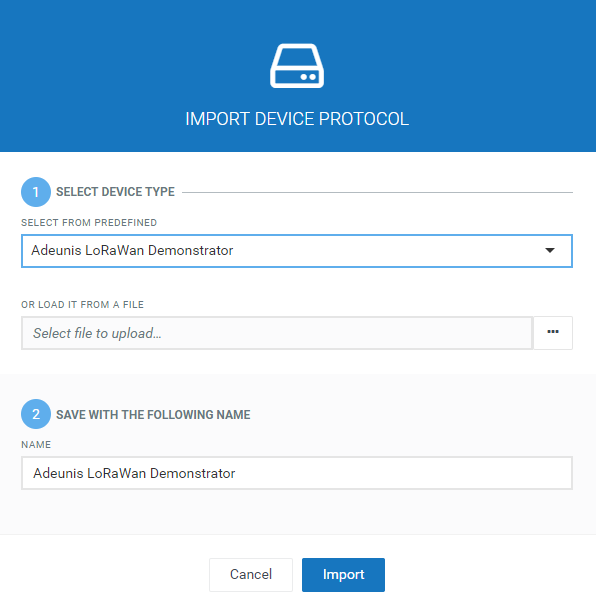
Alternatively, you may also load the device protocol from a file and import it.
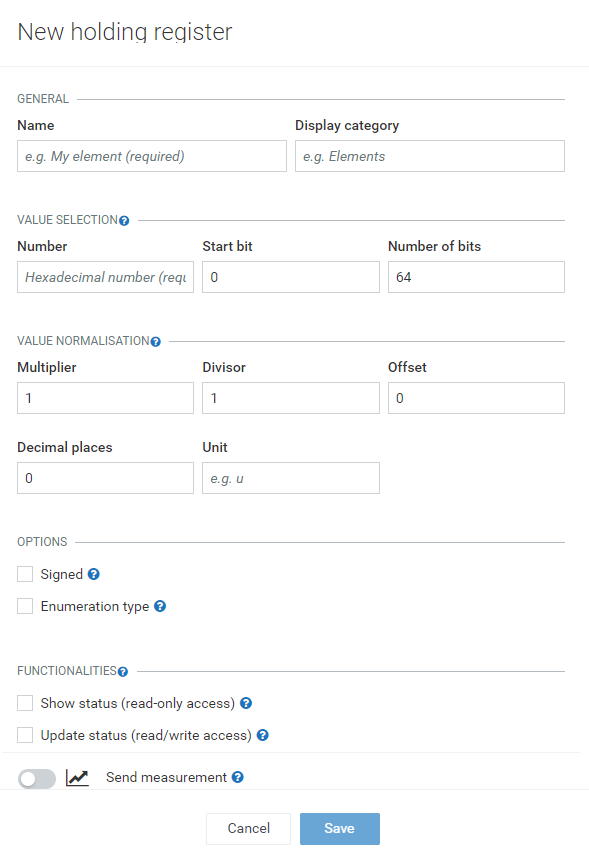
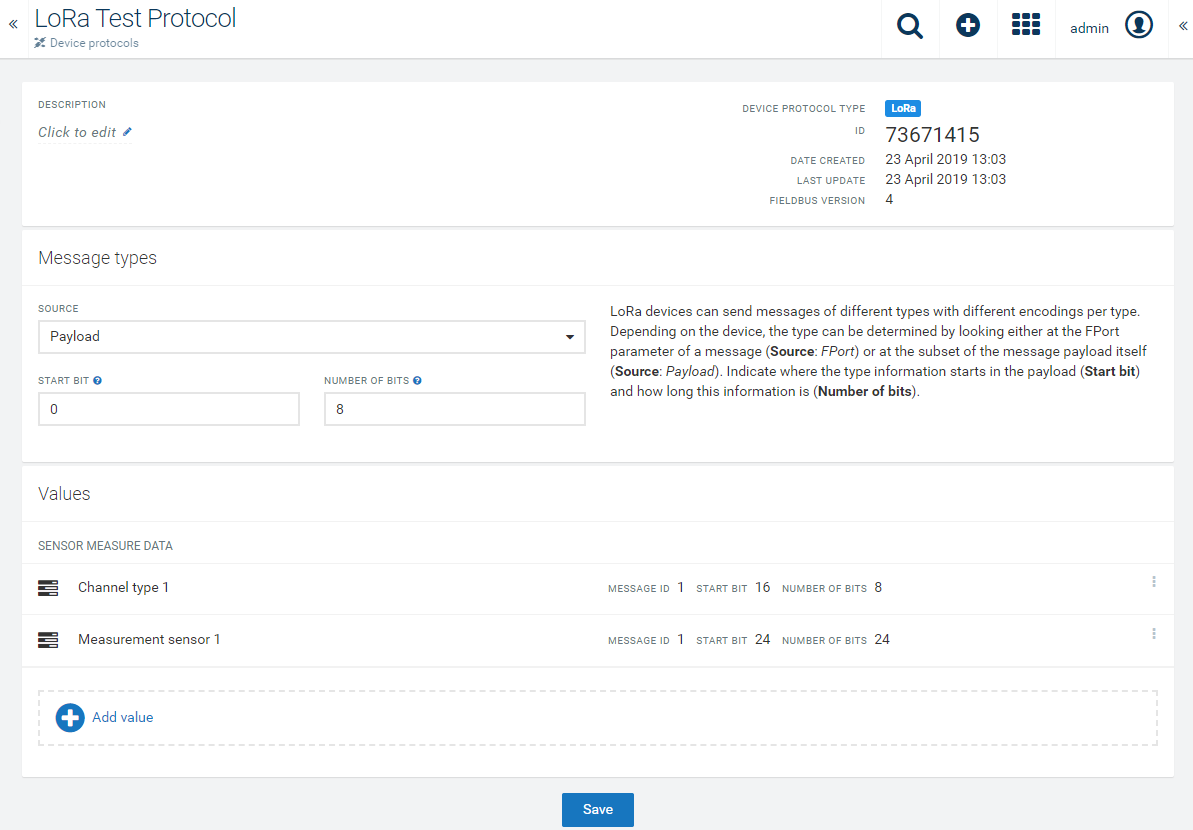
In the Device protocols page, click New device protocol in the top menu bar. The following window will open:

Select LoRa as the device protocol type, provide a name for it and click Create.
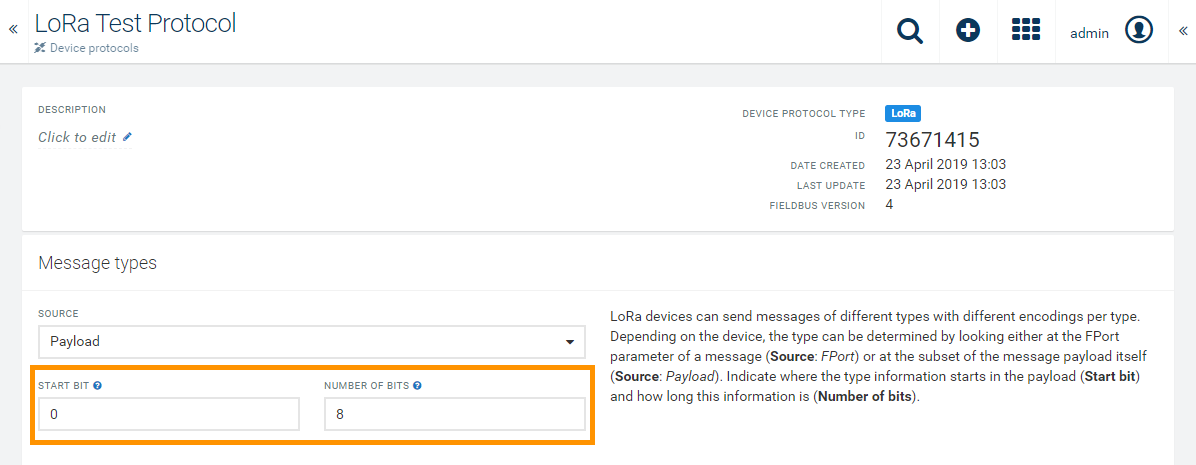
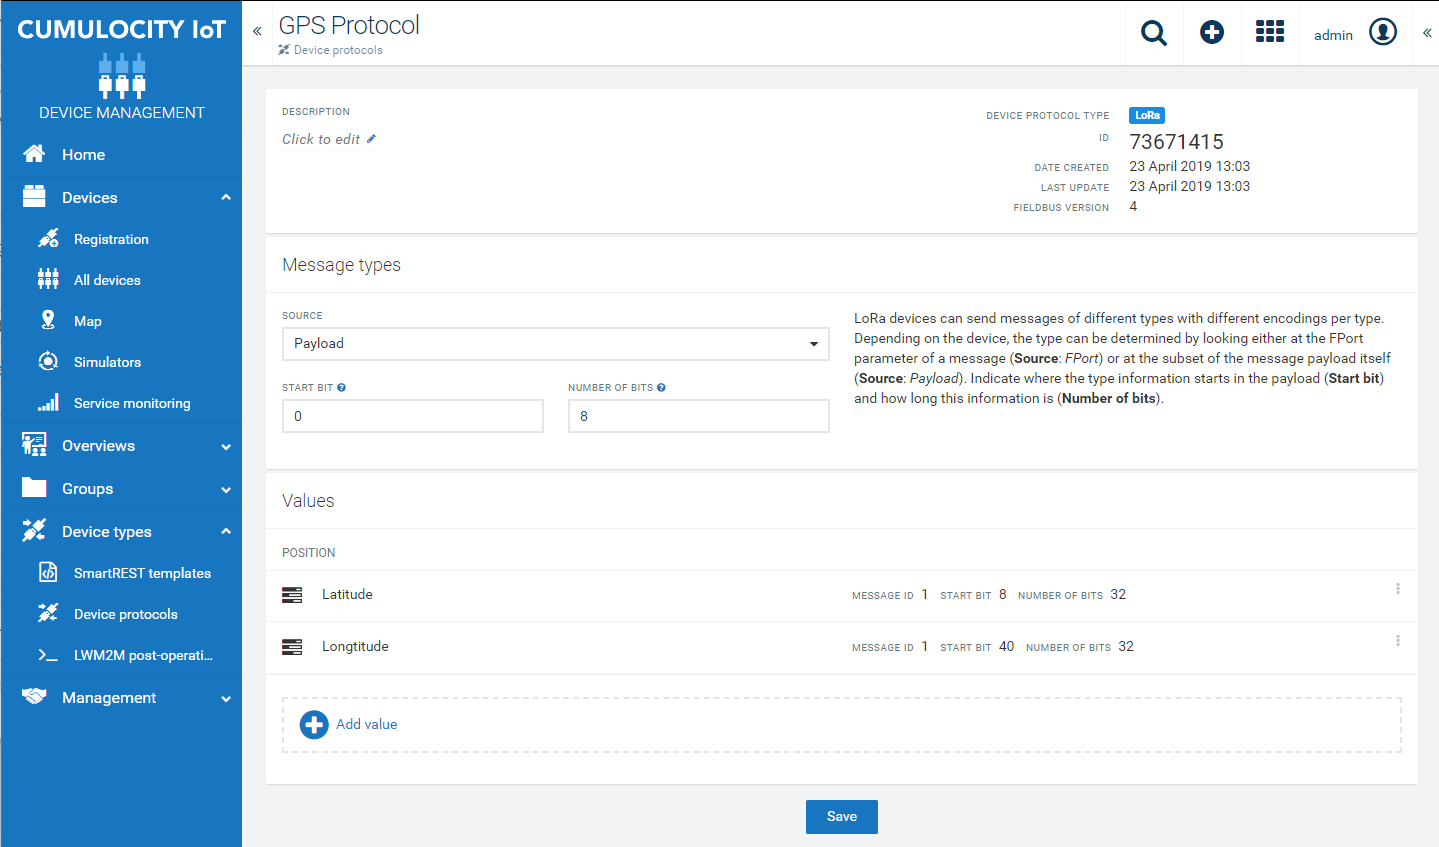
Under Message types, specify the message types. LoRa devices can send messages of different types with different encodings per type.
Select the way the message type is encoded in the Source dropdown box:
In the following example payload structure, the first byte indicates the message type source (as highlighted).
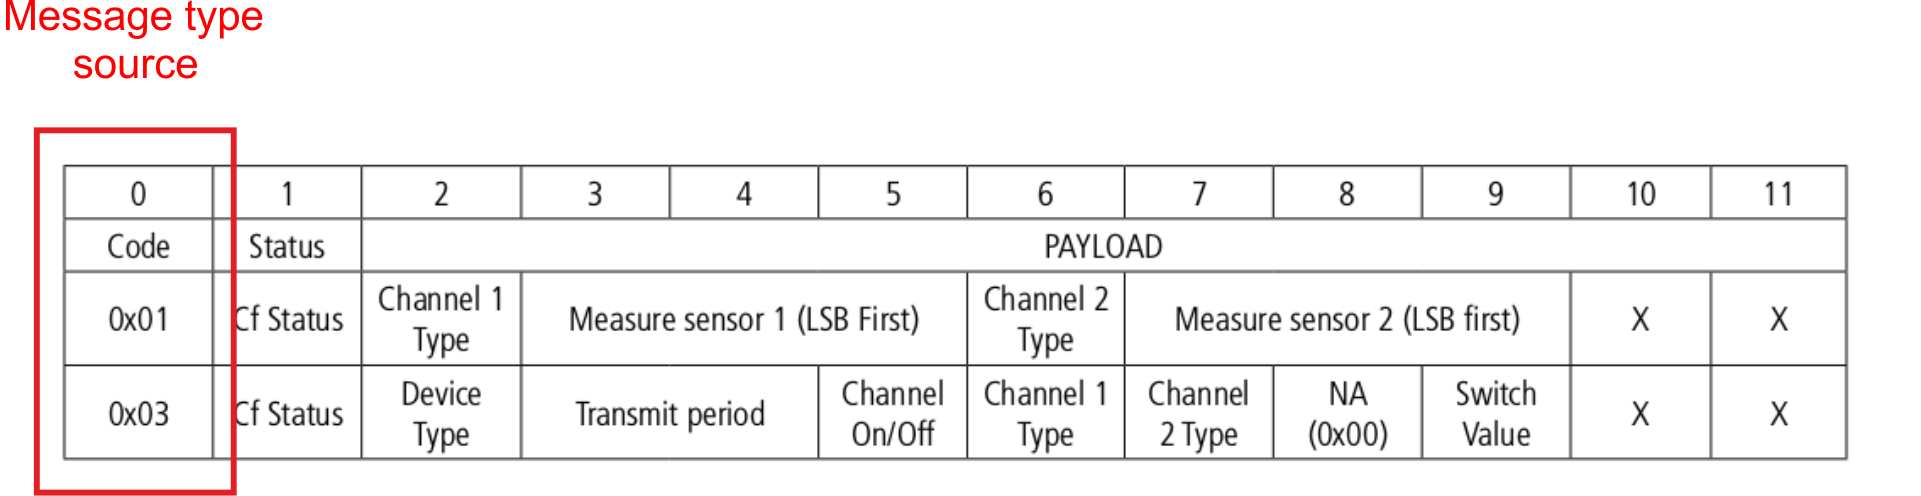
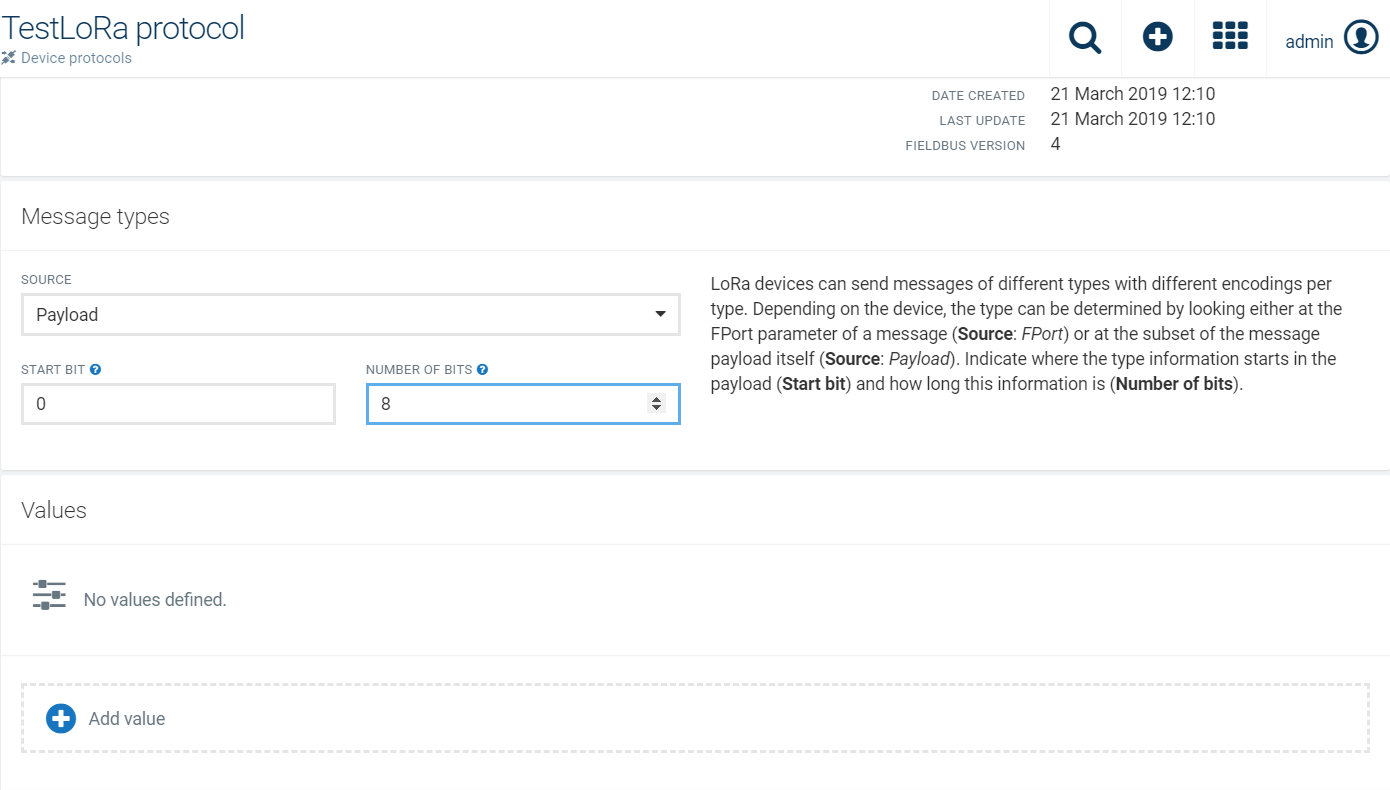
In the user interface you can enter this type of message type source information as follows: In the Start bit field, indicate where the message type information starts in the payload and in the Number of bits field, indicate how long this information is, for example start bit = “0” and number of bits = “8”.
Click Add value to create the value configuration.
In the upcoming window, configure the relevant values as shown in this example.
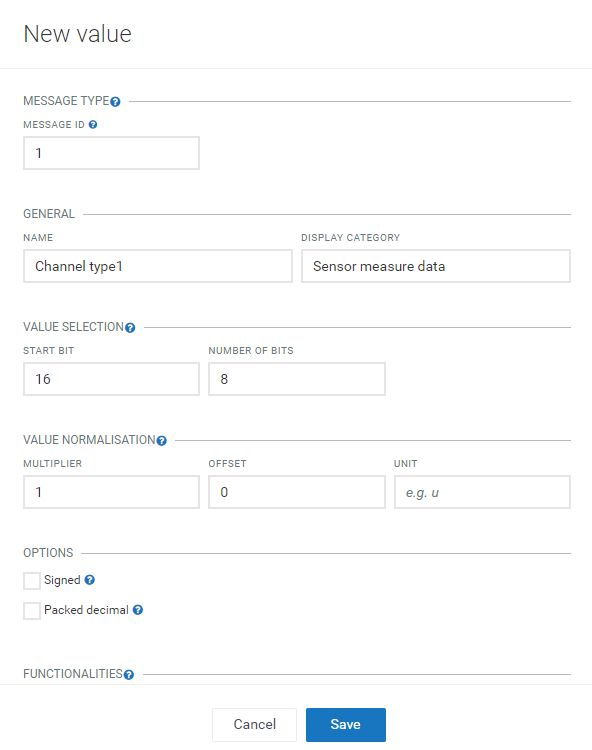
The value configuration maps the value in the payload of a message type to the Cumulocity data.
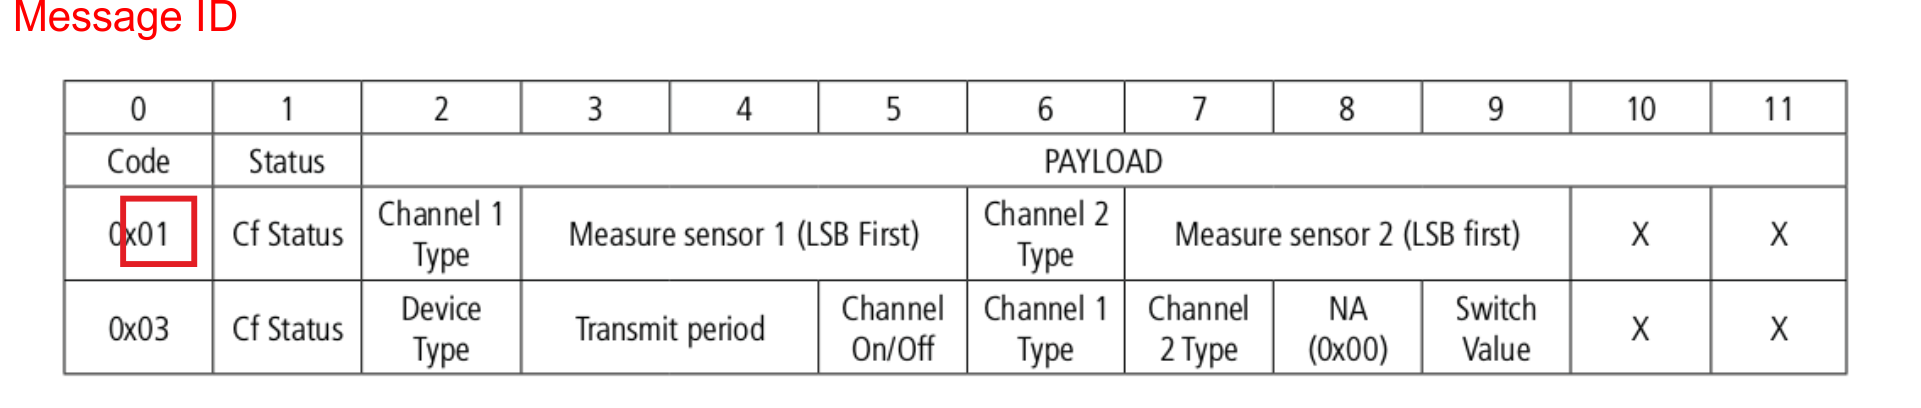
Under Message type, configure the Message ID according to your device message specification and map it to the Cumulocity data. The message ID is the numeric value identifying the message type. It will be matched with the message ID found in the source specified on the device protocol main page (i.e. Payload or FPort). The message ID needs to be entered in decimal numbers (not hex).
In this example payload structure the message ID is “1”.
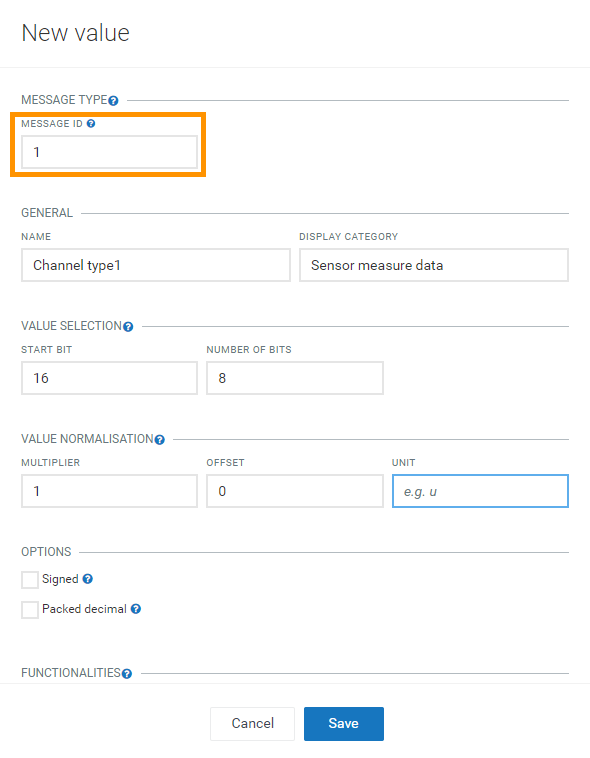
Under General, specify a name for the value and the category under which it will be displayed in the values list. The associated name for this value will be displayed under the Display category given.
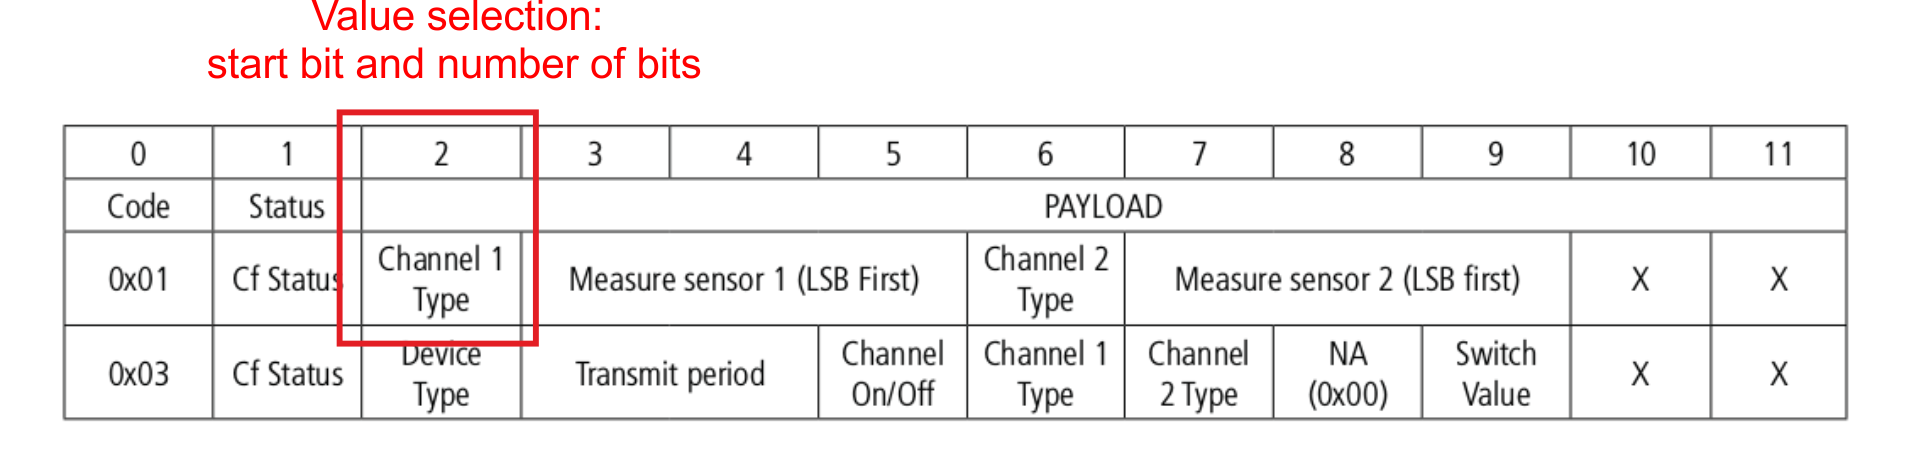
Under Value selection, define from where the value should be extracted. In order to do so, indicate where the value information starts in the Start bit field and how long this information is in the Number of bits field.
In this example the “Channel 1 Type” information starts in byte 2 (i.e. start bit = “16”) and is 1 byte long (i.e. number of bits = “8”).
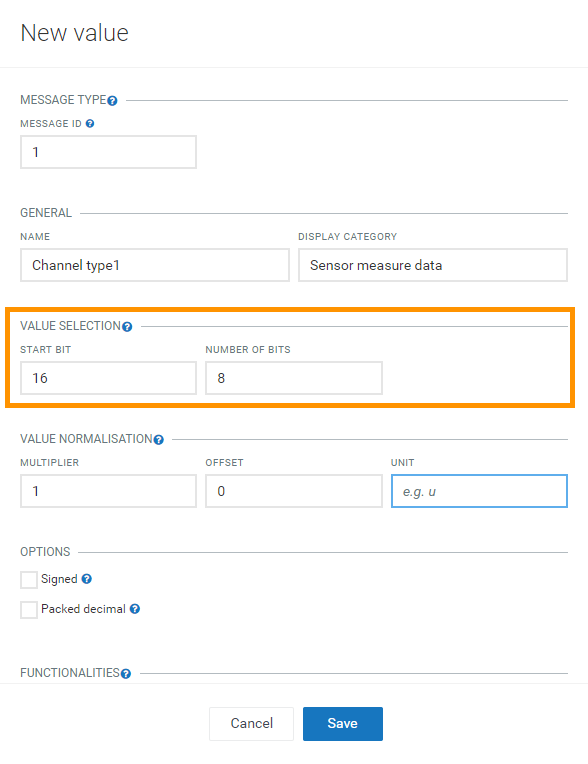
The hexadecimal value is converted to a decimal number and afterwards a “value normalisation” is applied.
Under Value normalisation define how the raw value should be transformed before being stored in the platform and enter the appropriate values for:
For detailed information on how to decode the payload, refer to the documentation of the device.
Info: “Little endian” support to decode the payload has been added.
Under Options, select on of the following options, if required:
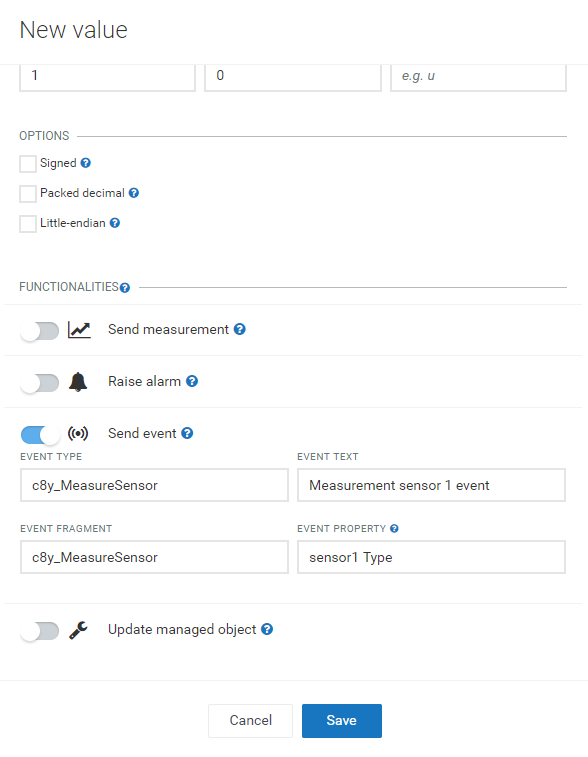
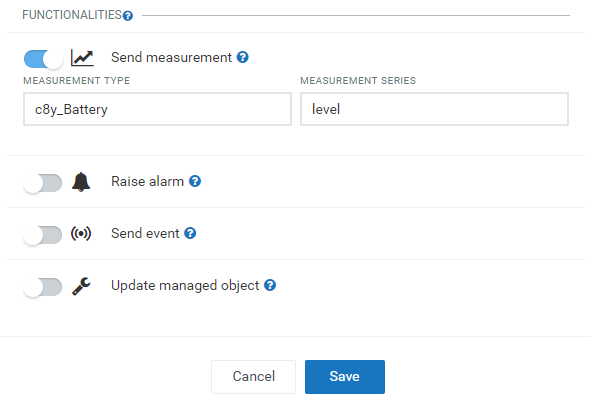
Under Functionalities, specify how this device protocol should behave:
You can also have a nested structure with several values within a measurement, event or managed object fragment. In case of a measurement all the properties of the same type will be merged to create a nested structure. In case of an event or a managed object all the properties with the same fragment are merged to create a nested structure. Also refer to the example of a nested structure for a “Position” device protocol below.
Click OK to add the values to your device protocol.
After clicking Save, your device protocol is created with the values you defined.
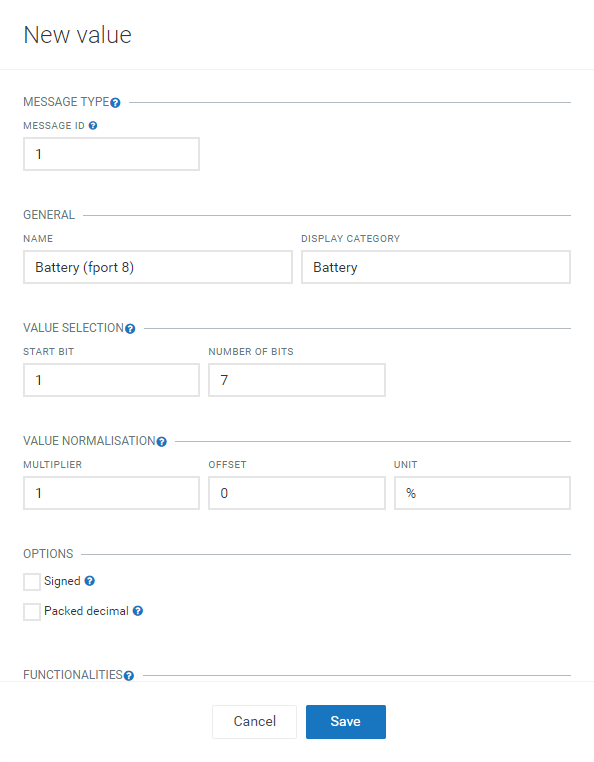
Example with single property
The following image shows an example for a message which sends a measurement when the battery level changes.
The following image shows an example of a nested structure for a device protocol reporting the current position of a GPS device. The display category is named “Position” and contains values for longitude and latitude.
The message ID should be the same for all the values. Enter the rest of the parameters according to the instructions above. Enter “c8y_Position” in the Managed object fragment field and create a new value for each: longitude and latitude.
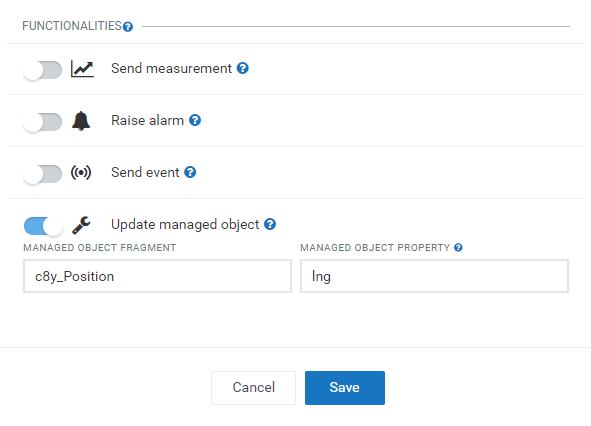
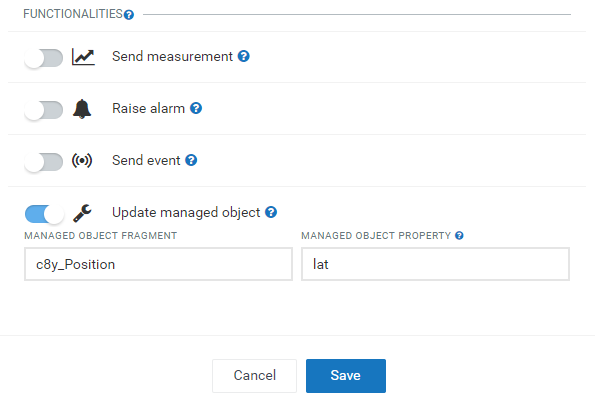
This will be the result:
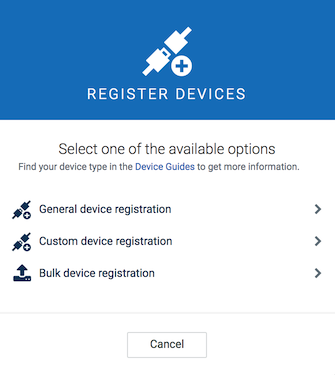
To register a LoRa device, navigate to the Device Management application and click Registration in the Devices menu in the navigator. Click Register device.
In the upcoming window, click Custom device registration and select LoRa:

Cumulocity fully supports the LoRa device provisioning with Over-the-Air Activation (OTAA) which is the preferred and most secure way to connect with the LoRa network. If Activation by Personalization (ABP) is required to be used, refer to the LoRa device registration with ABP section.
In the next window fill in the required information:
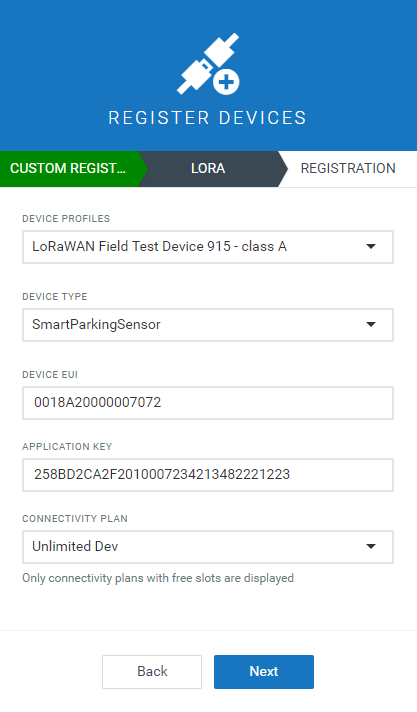
Click Next to submit the device registration request and create the device.
You can verify that the device is really connected by checking that events are actually coming in. You can do so by clicking on a device and opening the Events tab. All events related to this device are listed here.
The provision status is shown under Device data in the Info tab of the device.
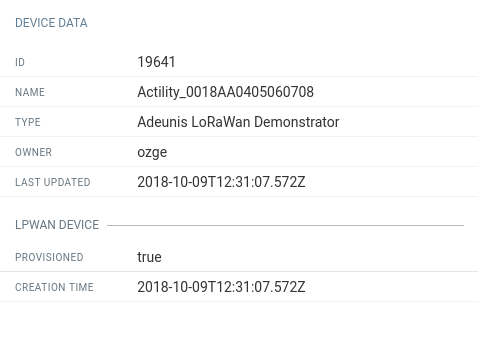
For more information on viewing and managing your connected devices, also refer to Device Management.
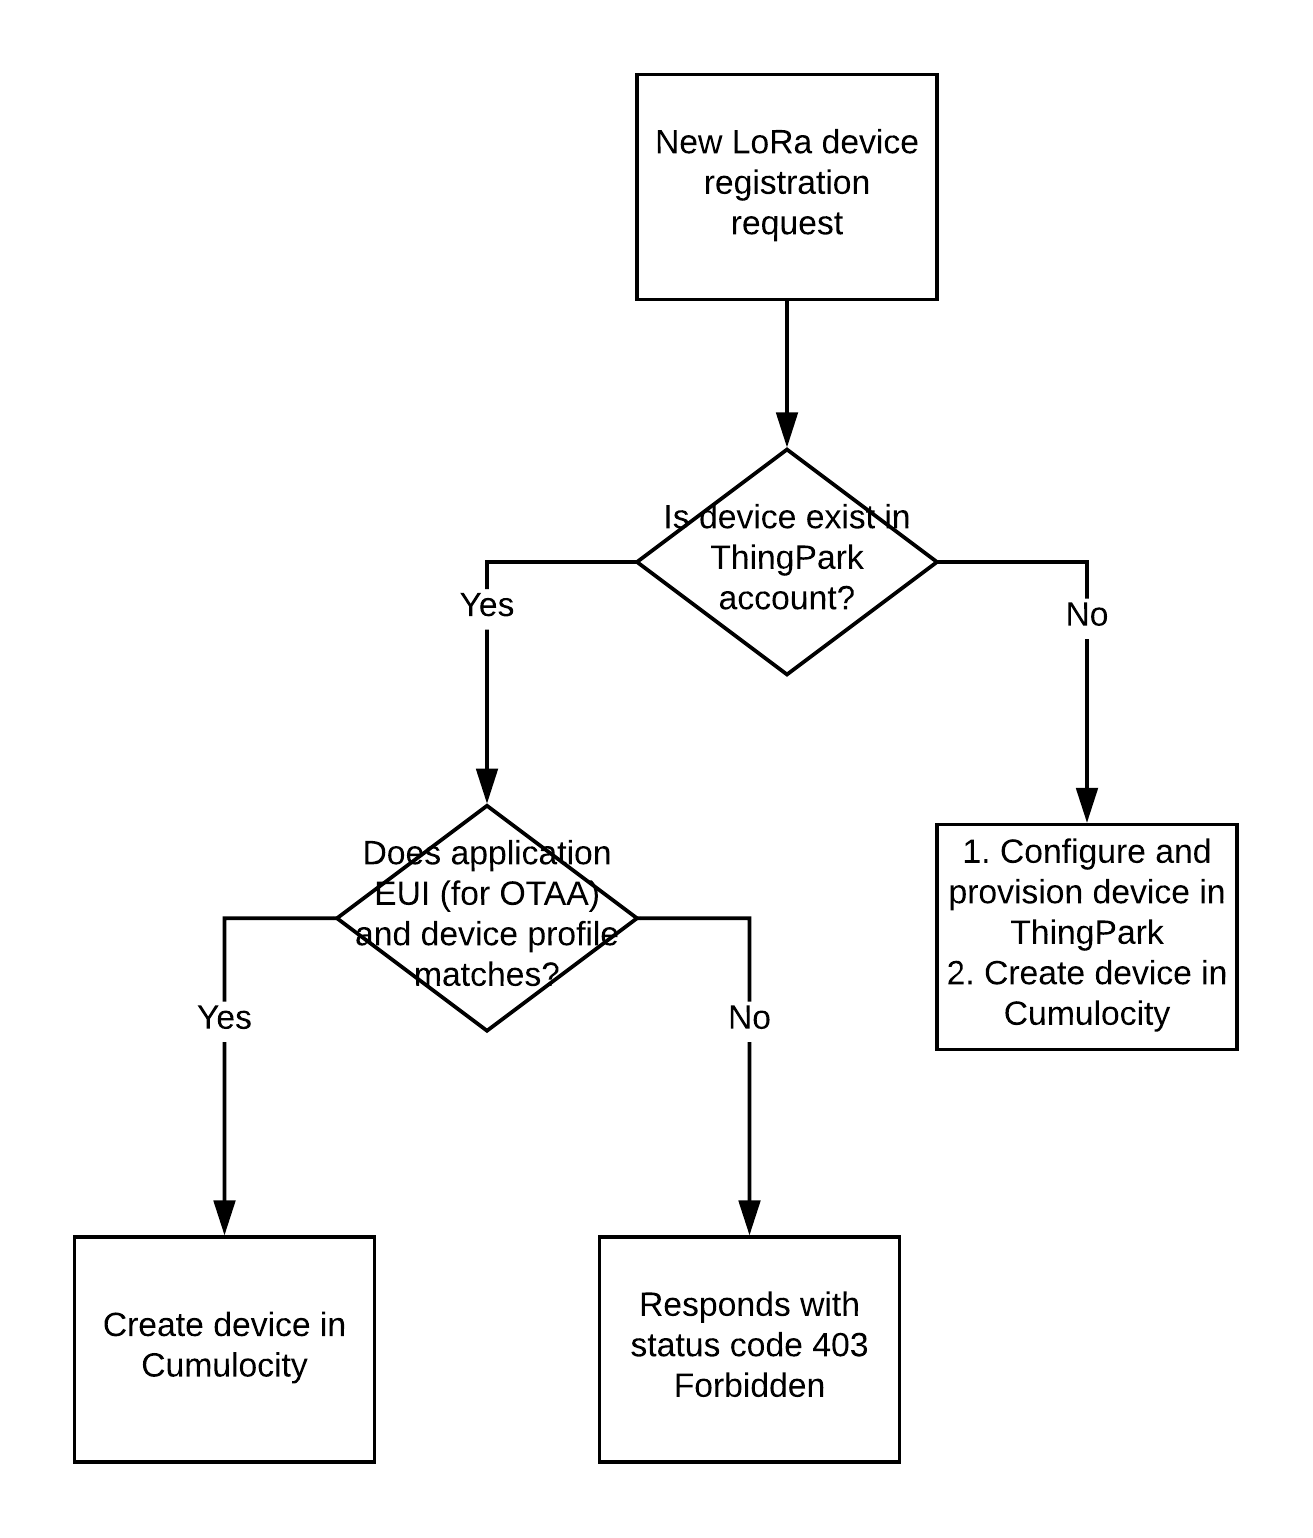
A device is created based on the above workflow.
First it is checked, if the device already exists. If no device exists with the same device EUI in the ThingPark account, the device is first provisioned on the ThingPark platform and then created on the Cumulocity platform with a link to the device in the ThingPark platform. If the device exists in the ThingPark account, a validation will be applied to compare these devices based on application EUI (for OTAA activation) and device profile. If the validation is successful, the device is created only in Cumulocity with a link to the device in the ThingPark platform. If the validation fails, a failure message will be shown (see troubleshooting section for device registration) and the device is not created in Cumulocity.
Activating the device by personalization is not recommended and not fully supported in Cumulocity LoRa device registration.
However, if you would like to create a device with this activation type in Cumulocity and use the LoRa features - such as sending operations to a device, deprovisioning a device and setting LoRa device protocol type with custom device protocol configuration - you must first provision the device in the ThingPark platform. Moreover you have to create “AS Routing Profile” for Cumulocity using destination http://actility-server.cumulocity.com as a “Third Party AS (HTTP)” and assign it to your devices manually. Afterwards, you can register this device using LoRa device registration. In this case, the Application key field in the LoRa device registration is invalid.
The general device registration for LoRa devices is no longer supported.
Existing LoRa devices that have been created in Cumulocity with the general device registration process have limitations. For those devices, it is not possible to send operations to the device, deprovision the device and set the LoRa device protocol type with custom device protocol configuration.
It is recommended to delete and re-register these devices using LoRa device registration to fully use the LoRa feature.
You can deprovision a LoRa device in the ThingPark platform. This means that the device will no longer be connected to the network. Its history data will still be available in Cumulocity, but the device will be deleted in ThingPark.
To deprovision a device, navigate to the respective device in the Device Management application under All devices. Click More in the top right and select Deprovision device.
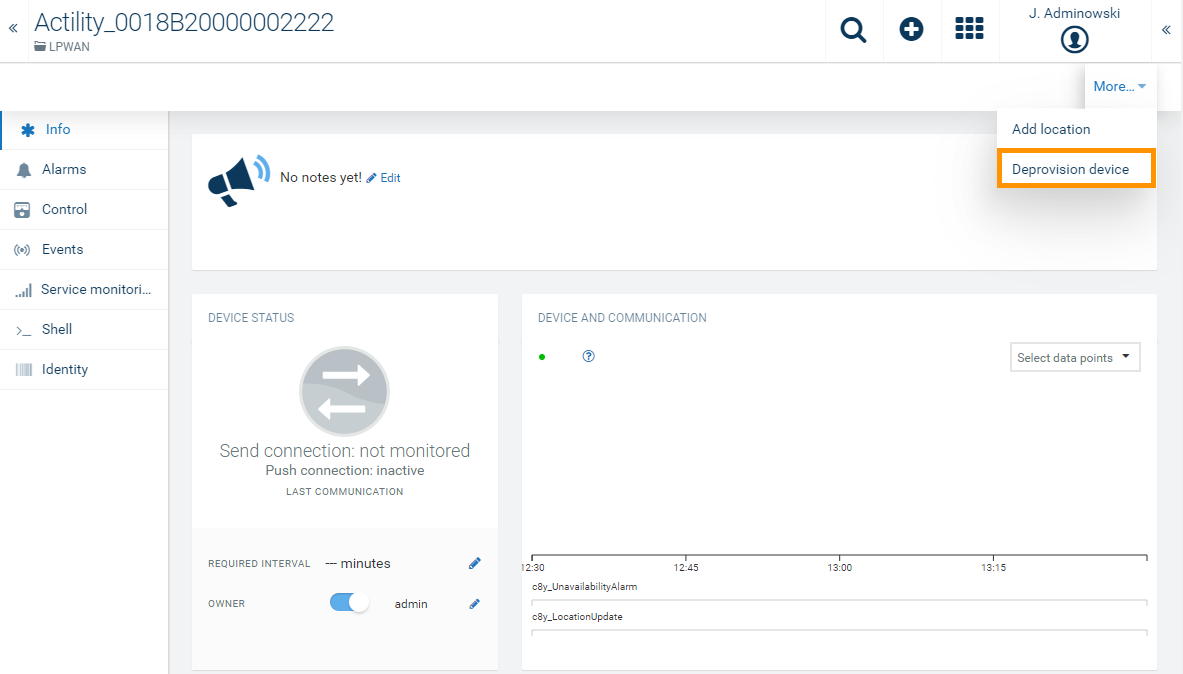
After confirming the deprovisioning, the device will be deprovisioned in ThingPark.
To provision the device again, the device should be deleted and re-registered using LoRa device registration.
If a LoRa device supports receiving hexadecimal commands, you can send them using shell operations. Notice that these commands are not serial monitor commands. In order to send an operation, navigate to the device you want to send an operation to in the Device Management application under All devices. Switch to the Shell tab.
In the following screenshot you can find some examples of a device protocol’s predefined commands and their format.
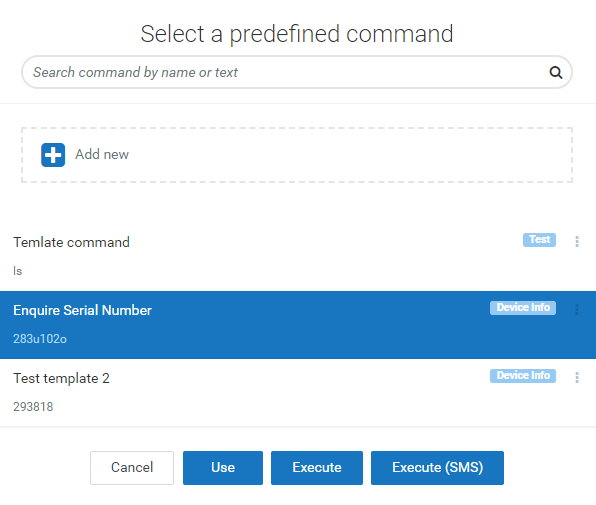
Enter the shell command or view/edit the predefined command in the >_Command field.
If you enter the command without defining a port, it will be sent to the default target port (i.e. 1) of the device. If you enter the command and define a port (format “command:port”), it will be sent to the specified target port instead of the default port.
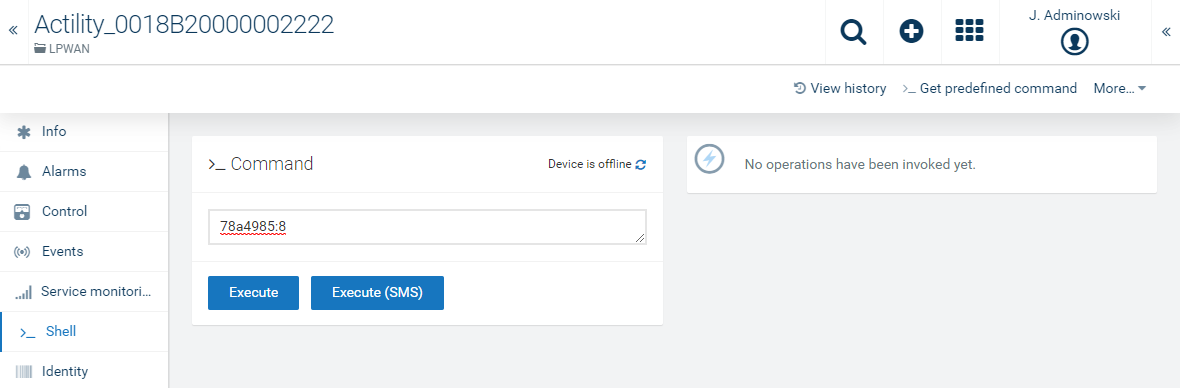
Click Execute. The operation will be sent to the device. The timing depends on Actility ThingPark.
The status of the operation is set to SUCCESSFUL when the operation has successfully been sent to the ThingPark platform. The status of the operation is set to FAILED when a problem occurred with the validation of the command or after the operation has been sent to the Thingpark platform.
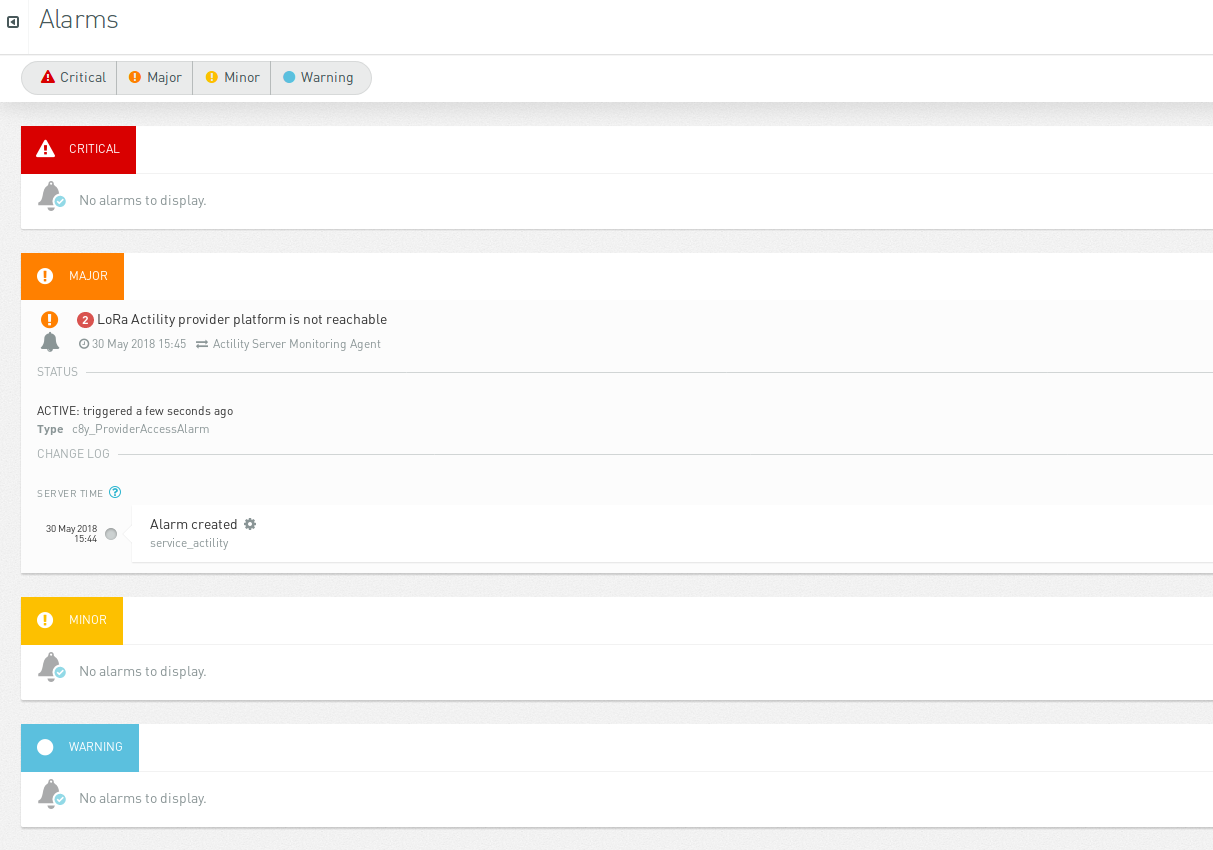
The ThingPark API is monitored and if it is not reachable, an alarm is created to notify all subscribed tenants using this feature. The alarm is cleared right after the ThingPark API is reachable again.
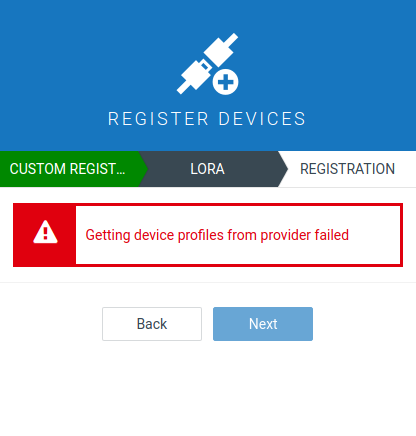
This warning message shows up if a provided profile ID, username or password is invalid.
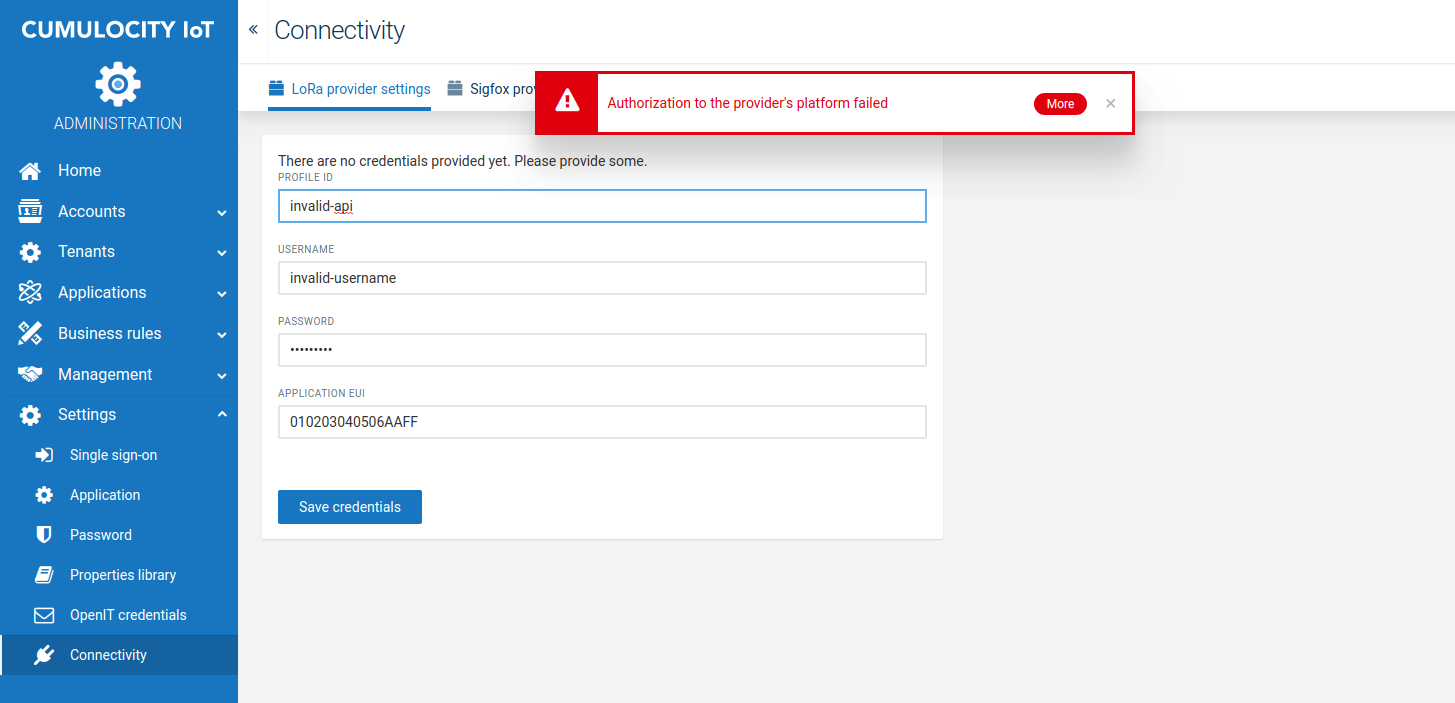
To resolve this, provide correct credentials and try again.
This warning message shows up when there already exists a provisioned device in ThingPark with the same device EUI used for device registration and the validation comparing those devices based on application EUI (for OTAA activation) and device profile has failed.
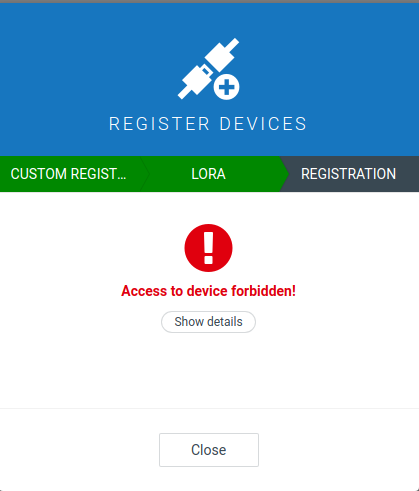
To resolve this, provide the correct application EUI from Connectivity application and device profile and try again.
This warning message shows up when there are no credentials set up for the ThingPark account.

To resolve this, refer to Configure ThingPark credentials.
This warning message shows up when the tenant’s access token to Thingpark becomes invalid. Invalidation of the token might happen when the same ThingPark credentials are used for another tenant.
This issue can be solved by reconfiguring the ThingPark credentials to renew the access token. Refer to configure ThingPark credentials for reconfiguration of the credentials.
This warning message shows up when no LoRa device protocol exists to be used for device registration.
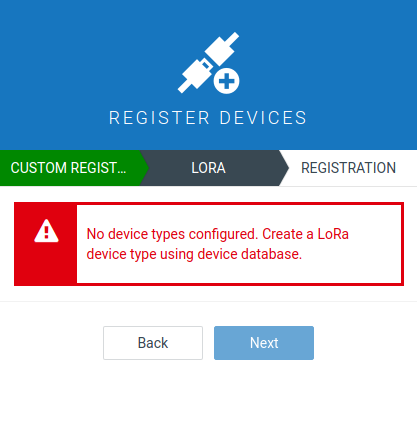
To resolve this, configure at least one device protocol using Device database.
This warning message shows up when the connectivity plan in ThingPark has reached the limit for the device count.
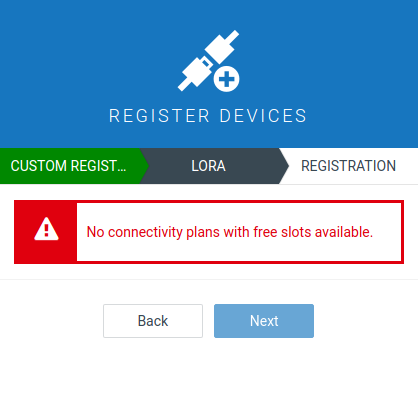
To resolve this, either contact ThingPark on the device quota limits for your connectivity plans or remove unused devices from ThingPark and retry registering the device in Cumulocity.
Lightweight M2M (LWM2M) is a traffic and resource-optimized protocol to remotely manage IoT devices. The protocol is standardized by the Open Mobile Alliance. For more information, see http://openmobilealliance.org/iot/lightweight-m2m-lwm2m.
You can connect any device supporting LWM2M to Cumulocity without programming. Instead, you configure how LWM2M devices are mapped to Cumulocity using device protocols.
To connect LWM2M devices, you need to upload a CSV file with registration data. This data is required to enable LWM2M communication. The CSV holds all information for factory bootstrap and client-initiated bootstrap. In the factory bootstrap mode, the LWM2M client has been configured with the necessary bootstrap information prior to the deployment of the device. The client initiated bootstrap mode requires a LWM2M bootstrap-server account pre-loaded in the LWM2M client. Below, you can see two CSV examples:

In the first CSV example you can see the following fields:
| Field | Description |
|---|---|
| ID | Unique ID of the device. For example, the ID could be an IMEI, serial number, etc. |
| IDTYPE | The type of the device. |
| CREDENTIALS | The content of this field is not used by LWM2M. |
| NAME | The name of the device. In this case the name of the device is the same as the device ID. |
| TYPE | This field needs to have the value "c8y_lwm2m”. |
| SHELL | To enable “Shell”, the value of this field must be “1”. If you want to disable “Shell” the value must be “0”. For more info about the shell commands, see Shell commands. |
| com_cumulocity_model_Agent | This field needs to have the value "1". |
| endpoint id | Indicates the LWM2M client’s “Endpoint ID” in order to allow the LwM2M bootstrap to provision the bootstrap information for the LWM2M client. |
| lwm2m server url | The URL the server is using for bootstrap. The LWM2M bootstrap server is used to provision the LWM2M client with the information required to contact the LWM2M servers. If you are using the Cumulocity service the hostname of the LWM2M server is "lwm2m.cumulocity.com". The bootstrap server port is "5683" and the LWM2M port is "5783". Note, that these values can be different for other services. |
| securityMode | In this example the value of the security mode is “NO_SEC” which means that there is no security. It is highly recommended to always protect the LWM2M protocol. However, there are scenarios in which the LWM2M protocol is deployed in environments where the lower layer security mechanisms are provided. Currently Cumulocity supports only “NO_SEC” and “PSK”. With “PSK”, the client and server have a common secret symmetric cryptography. In the next example you will see how the CSV file should look when the security mode value is “NO_SEC”. |
The table below reflects the full set of possible fields that can be added:
| Field | Type | Description | Mandatory |
|---|---|---|---|
| endpoint id | String | The name of the LWM2M endpoint. | Yes |
| lwm2m server url | String | The URL of the LWM2M server to be sent to the devices during bootstrap. If you are using the Cumulocity service the hostname of the LWM2M server is "lwm2m.cumulocity.com". The bootstrap server port is "5683" and the LWM2M port is "5783". Note, that these values can be different for other services. | Yes, for LWM2M bootstrap |
| securityMode | String, “NO_SEC” or “PSK | The LWM2M security mode to be used. Possible values are PSK and NO_SEC. | Yes |
| serverPublicKey | String | The public key of the server. | Optional |
| generateBootstrapServerConfig | Boolean | Toggles if Cumulocity generates a server config for the LWM2M bootstrap server and writes that back during bootstrap. Default is false. | Optional |
| securityInstanceOffset | Integer | The first instance to be used during bootstrap to which entries are written. Default is "0". If set e.g. to "3", the first instance will be three. | Optional | bootstrapShortServerId | Integer | The short server ID to be used for the bootstrap server. Default is "0". | Optional |
| lwm2mShortServerId | Integer | The short server ID to be used for LWM2M server. Default is "1". | Optional |
| registrationLifetime | Integer | The registration lifetime that is sent to the device during bootstrap. Overrides global agent configuration. | Optional |
| defaultMinimumPeriod | Integer | The default minimum period to configure during bootstrap. See LWM2M Spec for explanation. | Optional |
| defaultMaximumPeriod | Integer | The default max period to configure during bootstrap. See LWM2M Spec for explanation. | Optional |
| bindingMode | String | The LWM2M binding mode to be reported to the device. Supported are “UQ” (default, queuing) and “U” (unqueued). Note, that Cumulocity will always queue operations. | Optional |
| notificationIfDisabled (true/false) | Boolean | See LWM2M spec. Default: Not configured. | Optional, defaults to Leshan default behavior. |
| disableTimeout (true/false) | Boolean | See LWM2M spec. Default: Not configured. | Optional, defaults to Leshan default behavior. |

In this CSV example, the security mode value is “PSK”. With “PSK” enabled, additional mandatory fields must be filled. All fields, available to “PSK”, can be observed in the table below:
| Field | Type | Description | Mandatory |
|---|---|---|---|
| lwm2m psk_key | String | For security mode PSK: The key used by the device for LWM2M in PSK mode. Will be delivered to the device during bootstrap. | Mandatory for PSK. Should not be set for NO_SEC. |
| lwm2m psk_id | String | For security mode PSK: The ID used by the device for LWM2M in PSK mode. Will be delivered to the device during bootstrap. Mostly the same as the endpoint name. | Mandatory for PSK. Should not be set for NO_SEC. |
| bootstrap psk_id | String | For security mode PSK: The ID used by the device for bootstrapping in PSK mode. | Yes for PSK |
| bootstrap psk_key | String | For security mode PSK: The key used by the device for bootstrapping in PSK mode. | Yes for PSK |
| external-c8y_BootstrapPskId | String | The ID being used to find a device during bootstrap. | Optional |
Info: Firmware updates are also supported. For more information, see Device Management > Managing device data in the User guide.
After creation, the bootstrap parameters can be viewed and changed in the LWM2M bootstrap parameters tab in the Device details page, see LWM2M bootstrap parameters.
To process data from LWM2M devices, Cumulocity uses device protocols. Device protocols are accessible through the Devices Types menu in the Device Management application. For details on the general usage, see Device Management > Managing device types.
Once you have registered a device with the proper CSV file, you can manage LWM2M device protocols. Each piece of information available by the LWM2M client is a resource. The resources are further logically organized into objects. The LWM2M client can have any number of resources, each of which belongs to an object. In the device protocols you can observe your resources. Furthermore, you can choose whether to create measurements, events or alarms out of those resources.
To add a new LWM2M device protocol follow these steps:

The device protocol will open in a new page.
In the device protocol page, you will see the description at the top left and the ID, the creation date and date of the last update at the top right.
Below, a list of resources configured for the device will be listed (which is empty when creating a new protocol), showing the ID, name and potentially configured functionalities for each resource.
Info: LWM2M protocol resources cannot be edited.
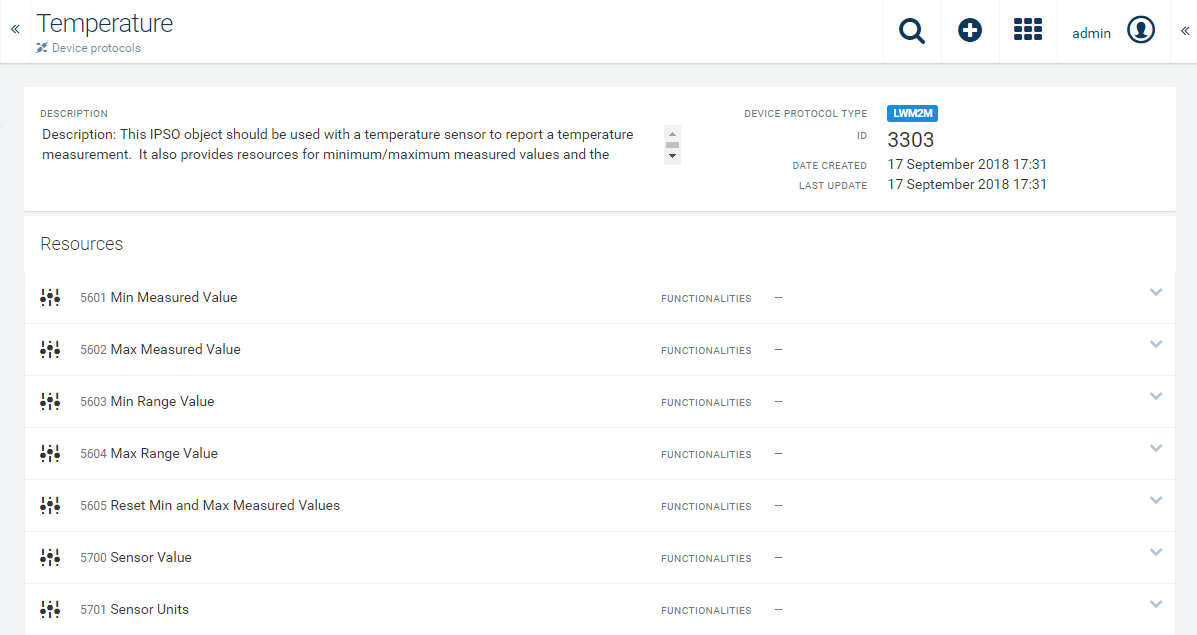
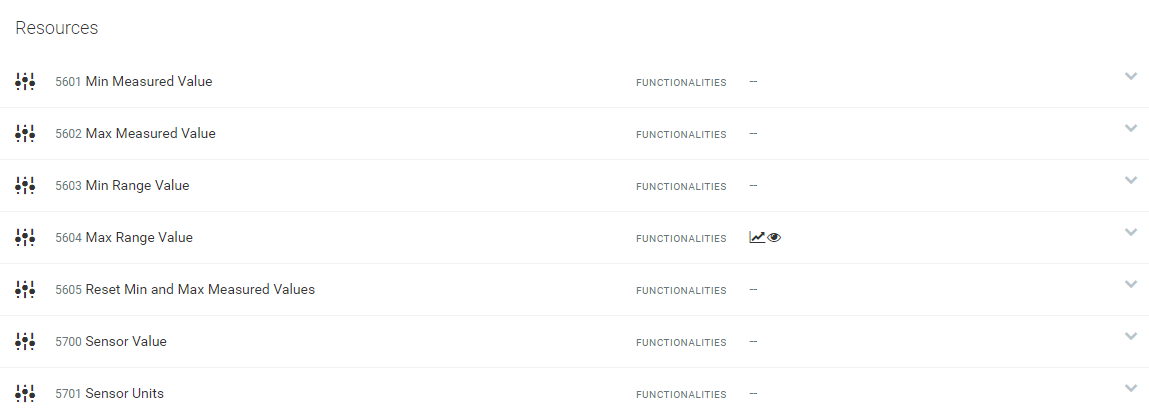
Example: In the following screenshot you can see an example device protocol. This object should be used with a temperature sensor to report a temperature measurement. It also provides resources for minimum/maximum measured values and the minimum/maximum range that can be measured by the temperature sensor. An example measurement unit is “degrees Celsius”.
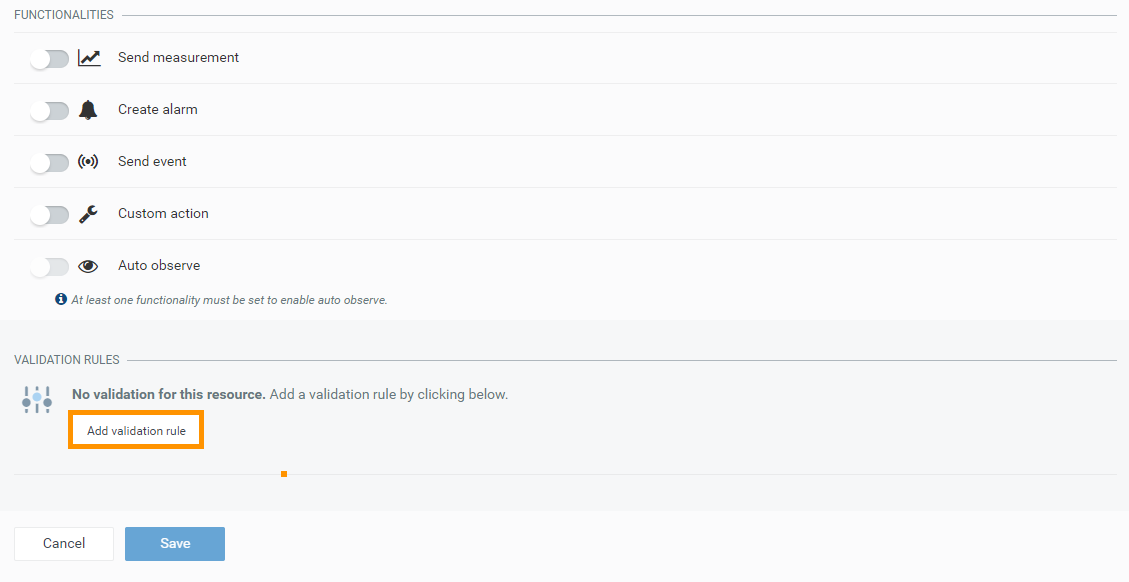
The functionalities that you may enable are the following:
Send measurement
Turn on Send measurement to specify a measurement.
Create alarm
Turn on Create alarm if you want to create an alarm out of the resource. Specify the following parameters (all mandatory):
Send Event
Turn on Send event to send an event each time you receive a resource value. Specify the following parameters:
Custom Actions
Turn on Custom Actions to map LWM2M data into Cumulocity using custom data processing actions. For specialized integration use cases, it is required to perform customized data processing on LWM2M data. One example are LWM2M resources of the OPAQUE data type that contain proprietary, binary data, CBOR, XML or alike.
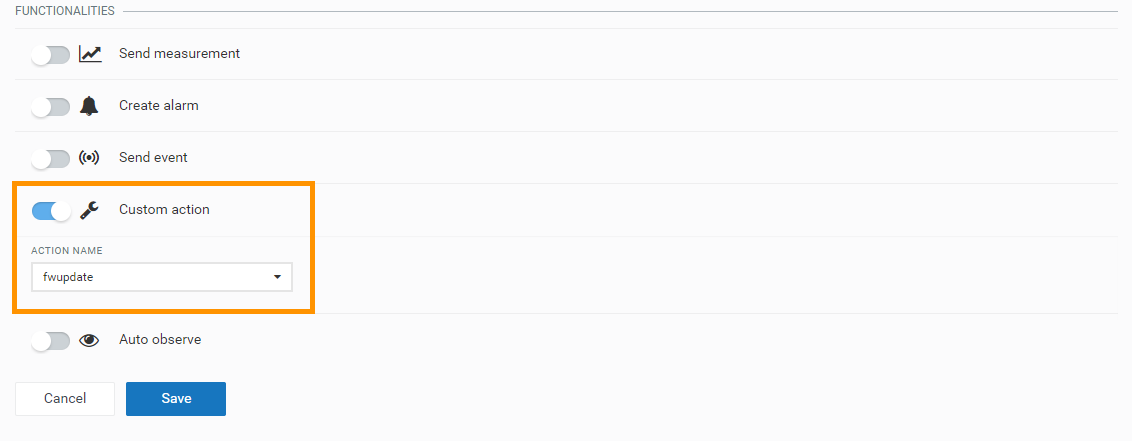
Cumulocity LWM2M allows the set of custom actions to be extended using decoder microservices. A decoder microservice is an ordinary Cumulocity microservice that implements a simple decoder interface. The LWM2M agent calls this microservice for decoding data in a customer-specific way. We are providing an according example how to write such a decoder microservice in our public Bitbucket repository.
Auto observe
If Auto-Observe is turned on for a resource, the LWM2M server observes a specific resource for changes.
Info: At least one functionality must be set to enable “Auto observe”.
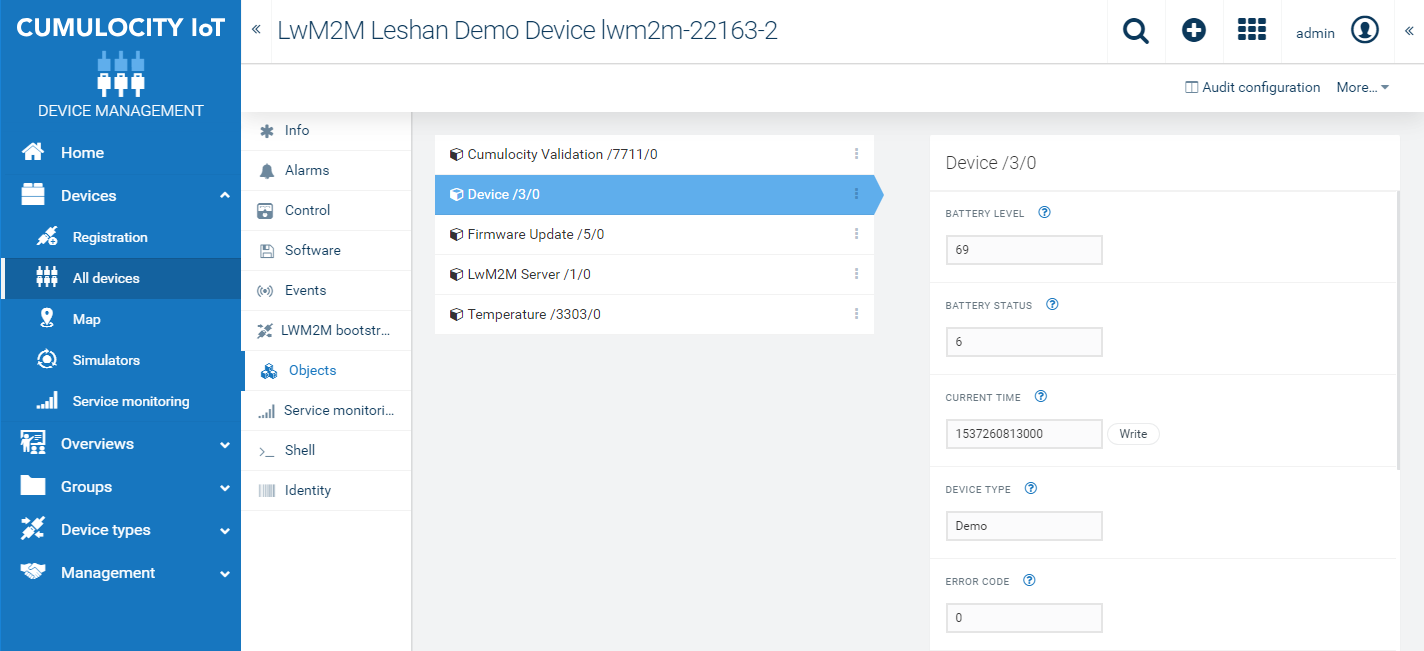
Info: In the Device management application, you can view all details of a device. The following details are specific to LWM2M devices. For information on general details refer to Device details in the Device management section.
In the Objects tab of a LWM2M device, you can view all objects, resources and instances of the device. Additionally, you can create new operations, see all currently pending operations and view the history of all previous operations.
Info: In order to see resources in the Objects tab, the resources first have to be added in the Device Protocols page.
The following operations may be available in each instance:
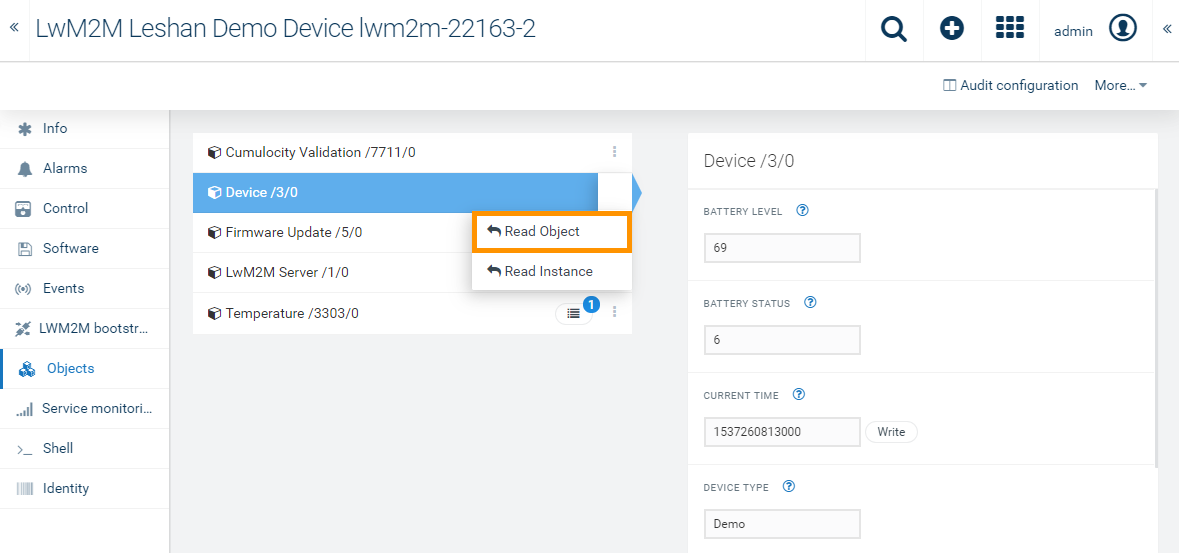
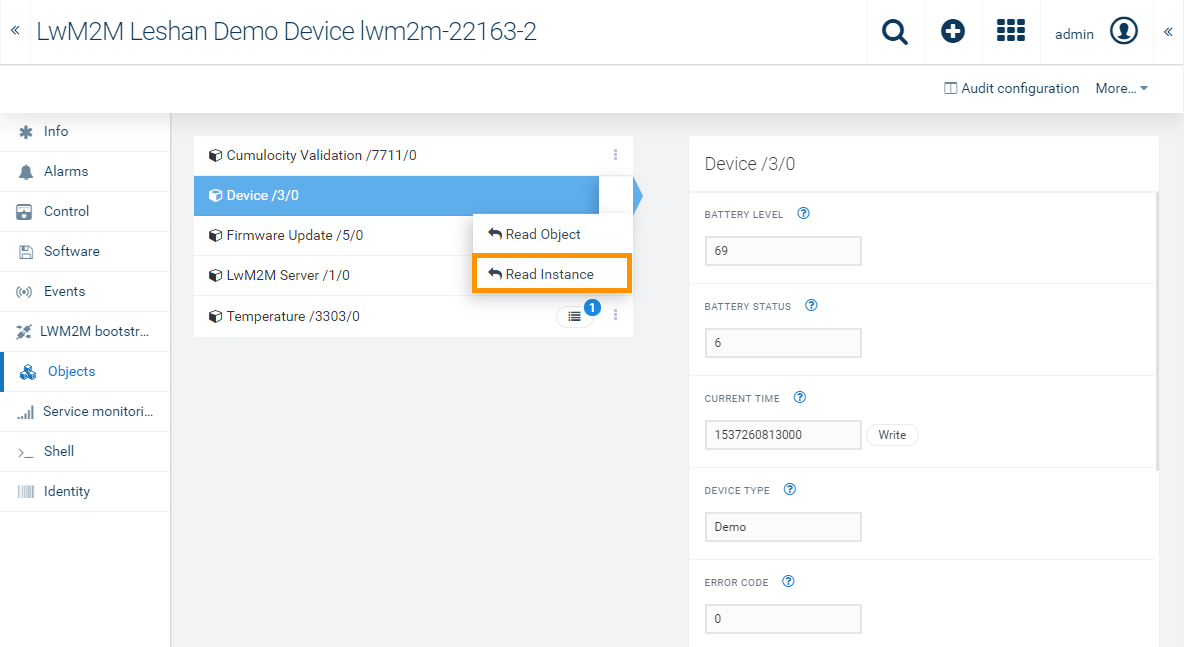
Info: Some instances do not have all of the listed operations.
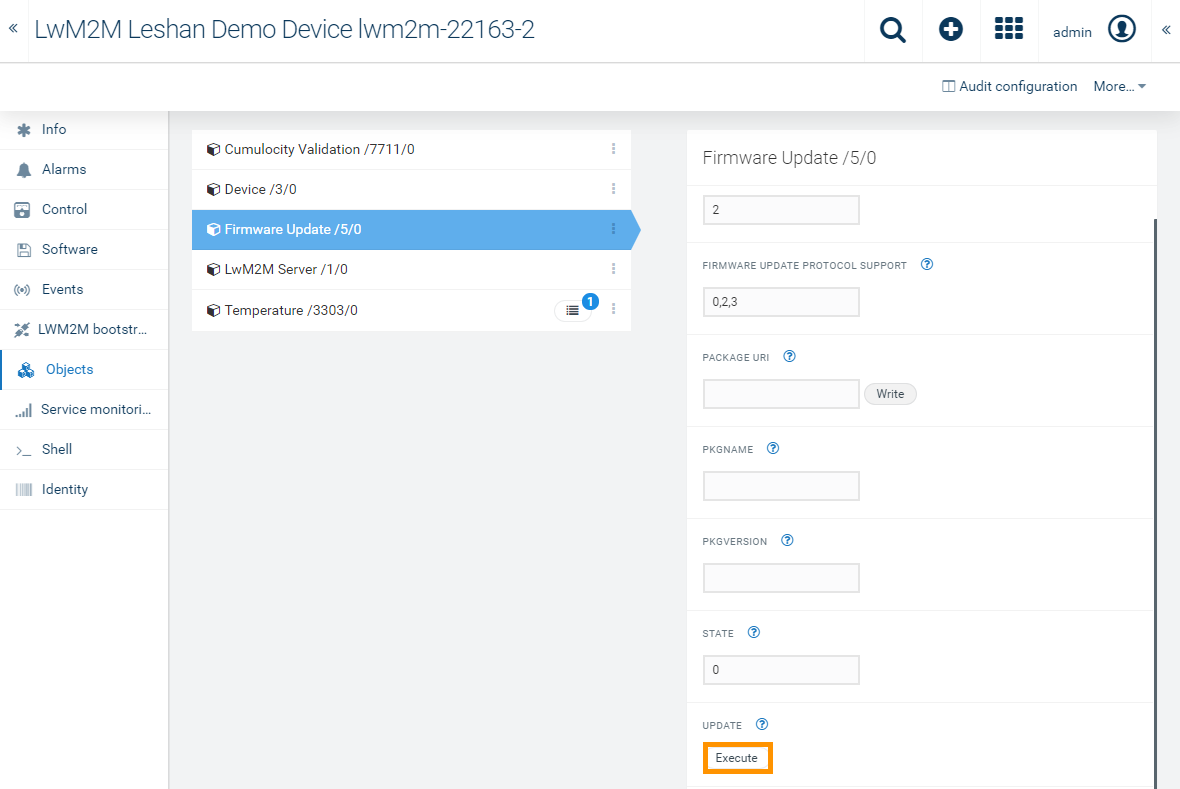
Some object cards show additional operations which can be performed. These operations become available after reading the object/instance, for example, device Update. In order to perform the operation, click Execute.
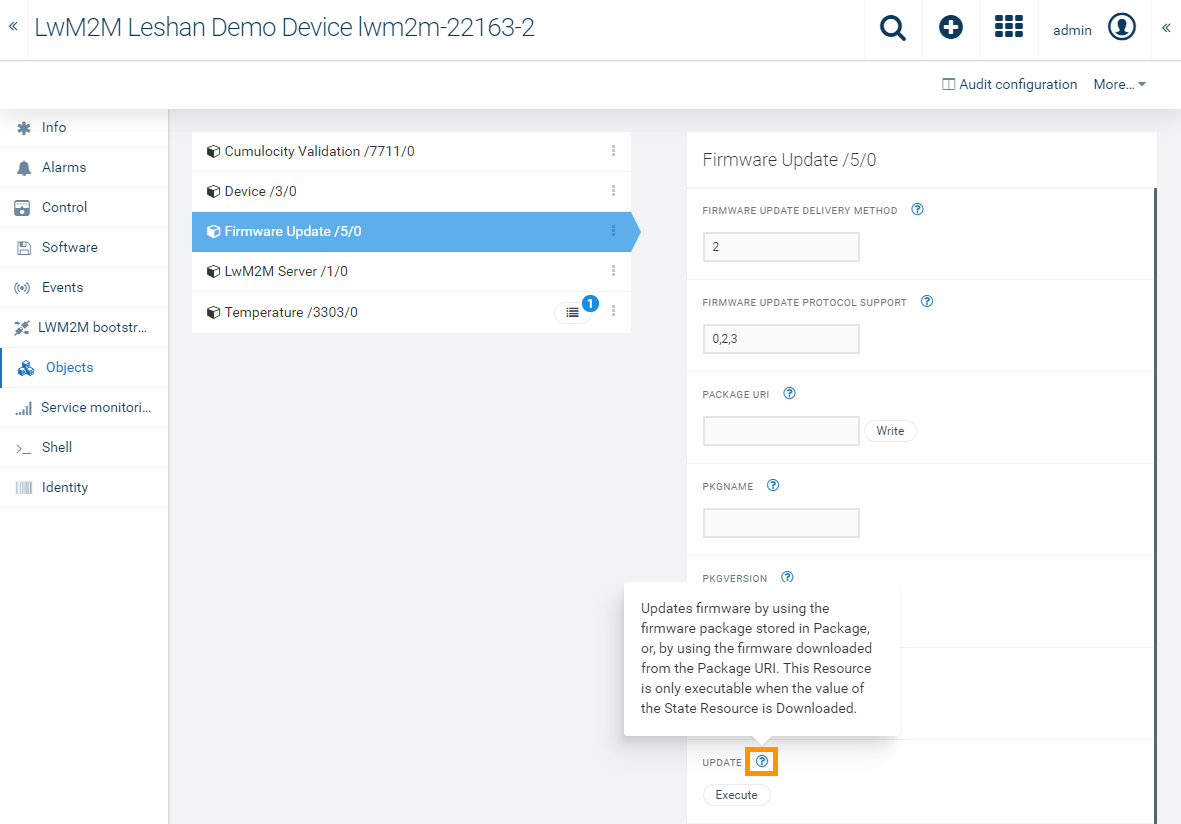
More information can be acquired for each resource by hovering over the tooltip icon.
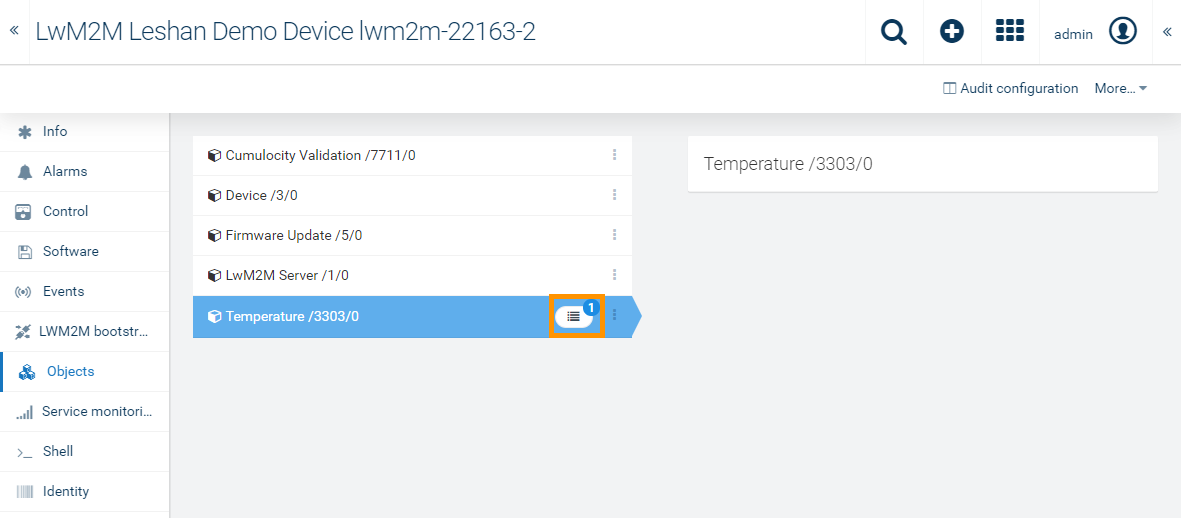
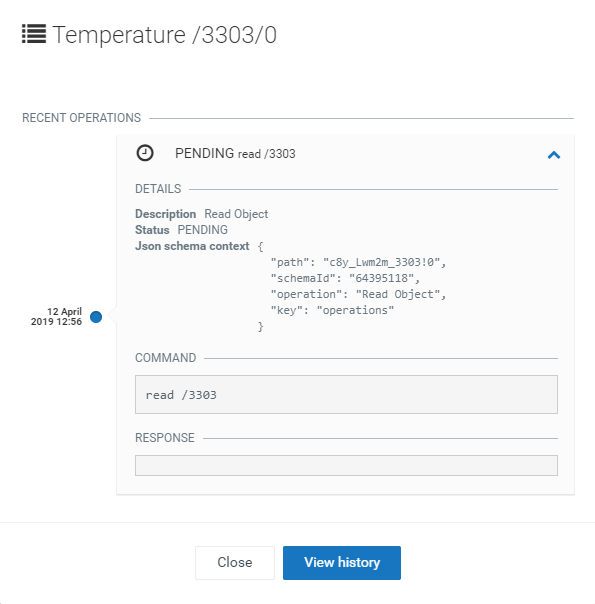
Additional information on recent operations can be viewed by clicking the operations button located on the right side of an instance card. The button is only visible if any operation has been performed. The number of unread operations can be seen on the top right of the button. In the example below there is only one.
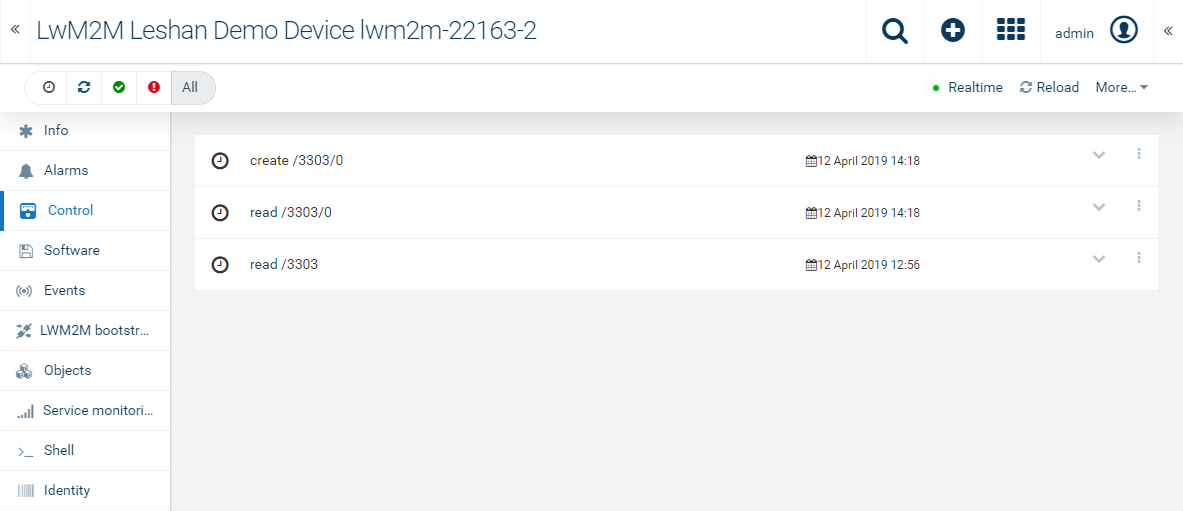
To view the history of all operations, simply click View history. Note, that you will be redirected to the Control tab.
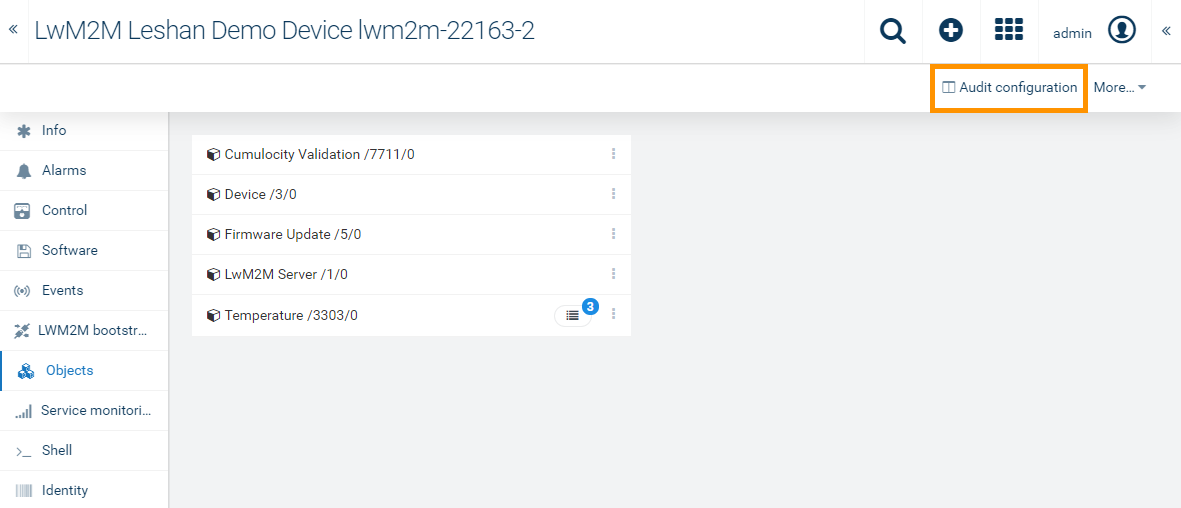
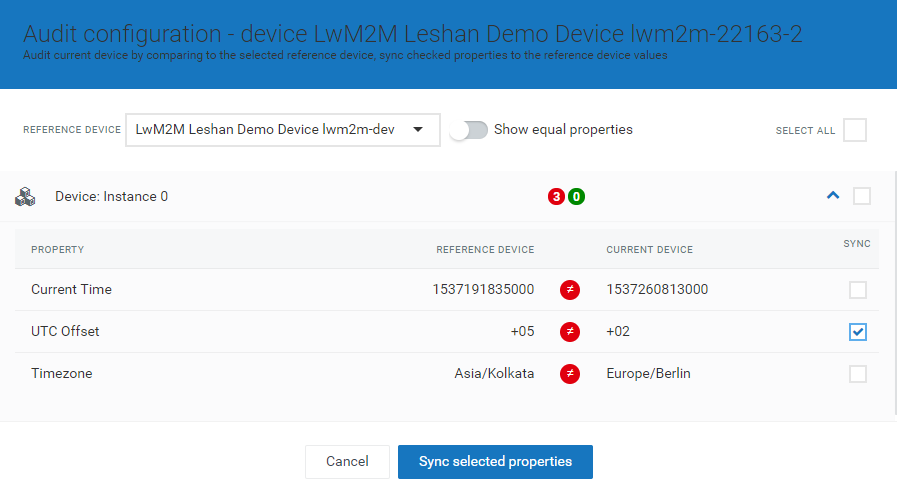
Audit Configuration
In the Audit configuration page you can audit the current device by comparing it to a selected reference device. It is also possible to sync properties to the values of the referenced device.
Click Audit configuration in the right of the top menu bar to navigate to the Audit configuration page.
To sync properties, select the desired reference device from the dropdown list. Check the properties that you wish to sync and click Sync selected properties.
Info: The numbers in the green circles represent the number of properties in the instance which have the same value in both devices. Respectively, the numbers in the red circles represent the number of properties which have different values compared to the values of the referenced device. If an instance is expanded, you can select only specific properties which can be synced.
In the LWM2M bootstrap parameters tab, bootstrap parameters of the current device can be viewed and changed. To modify a parameter, enter the desired value in a field of your choice and click Save.
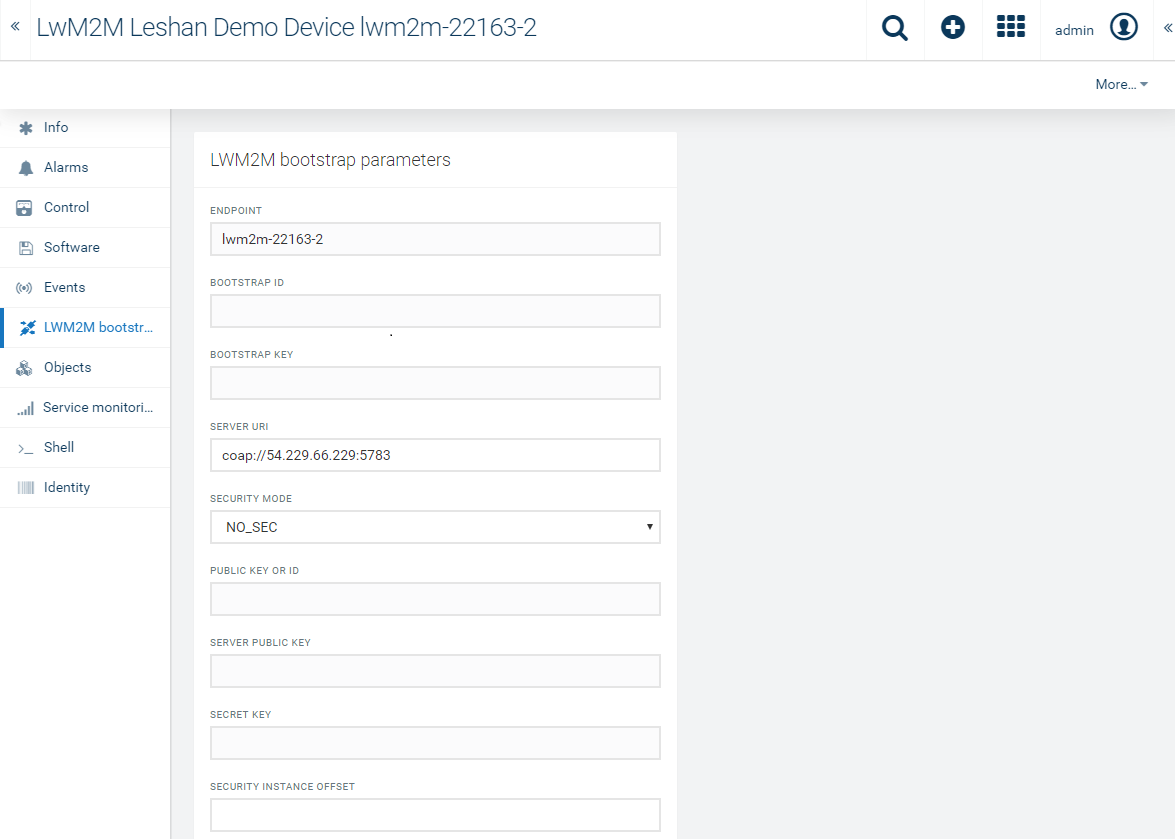
Important: Currently only the “NO_SEC” and “PSK” security modes are supported.
For further information on the fields in the LWM2M bootstrap parameters tab, see Registering LWM2M devices.
In the Shell tab of a device, LWM2M shell commands can be performed. Each command has a different functionality. Find all available placeholders (e.g. “objectID”, “instanceID”) and commands with their respective descriptions below:
| Placeholder | Description |
|---|---|
| objectID | The ID of the object. |
| instanceID | The ID of the instance. Some objects can have multiple instances. For example, “3300” is a temperature sensor object. Each device can have up to 10 sensors. In this case the instance ID would be 3300/1…10 depending on the sensor that you would like to focus. |
| resourceID | The ID of the desired resource. The resources describe the characteristics of each object. All instances of a given object have the same resources, but the value of the resources may be different. |
| Firmware version | The current version of the firmware. |
| Firmware url | The URL from which the new version of the firmware will be downloaded. |
In the next table you will see all available commands and a brief description of their functionality.
| Command | Description |
|---|---|
| read / |
Reads a resource path |
| observe / |
Enables the observe functionality |
| execute / |
Executes a resource on the device |
| cancelobservation / |
Cancels the observation functionality from the desired resource |
| delete / |
Deletes a given object/instance/resource |
| discover / |
Shows all resources of the given object |
| create / |
Creates a new object. The JSON argument is optional |
| writeattr / |
Writes additional attributes to the object. Typically used for conditional observes |
| fwupdate / |
Updates the firmware of the agent |
Validation rules are used to verify that the data a user enters in a resource meets the constraints you specify before the user can save the resource.
Validation rules can only be added to resources which have “write” permissions. Resources which can have validation rules are marked by the following icon:
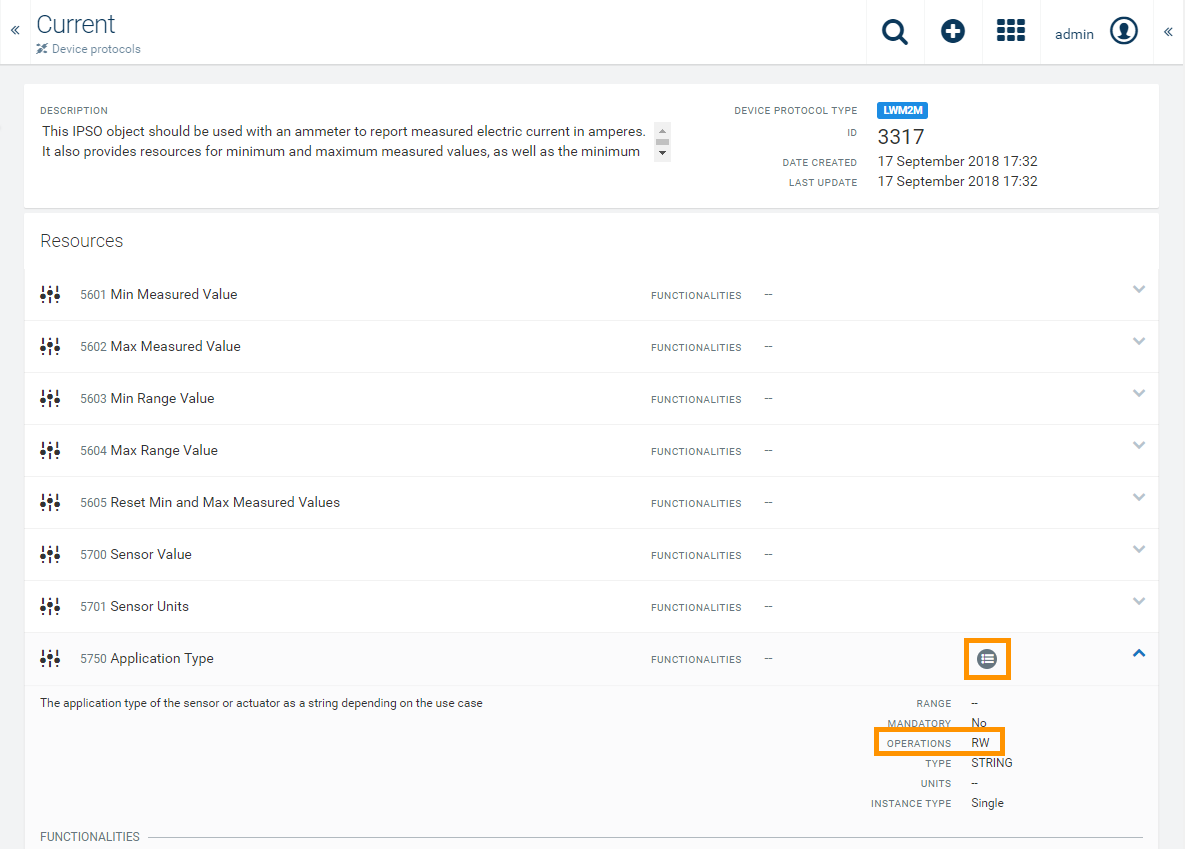
When hovering over the icon, you can see whether there are defined validation rules.
Add a new validation rule by clicking on the desired resource and then click Add validation rule.
Validation rules can have the following types:
After selecting a type, the following rules can be chosen:
Info: Not all rules are available to each type.
To delete a rule, simply click on the delete icon:
Click Save to save your settings.
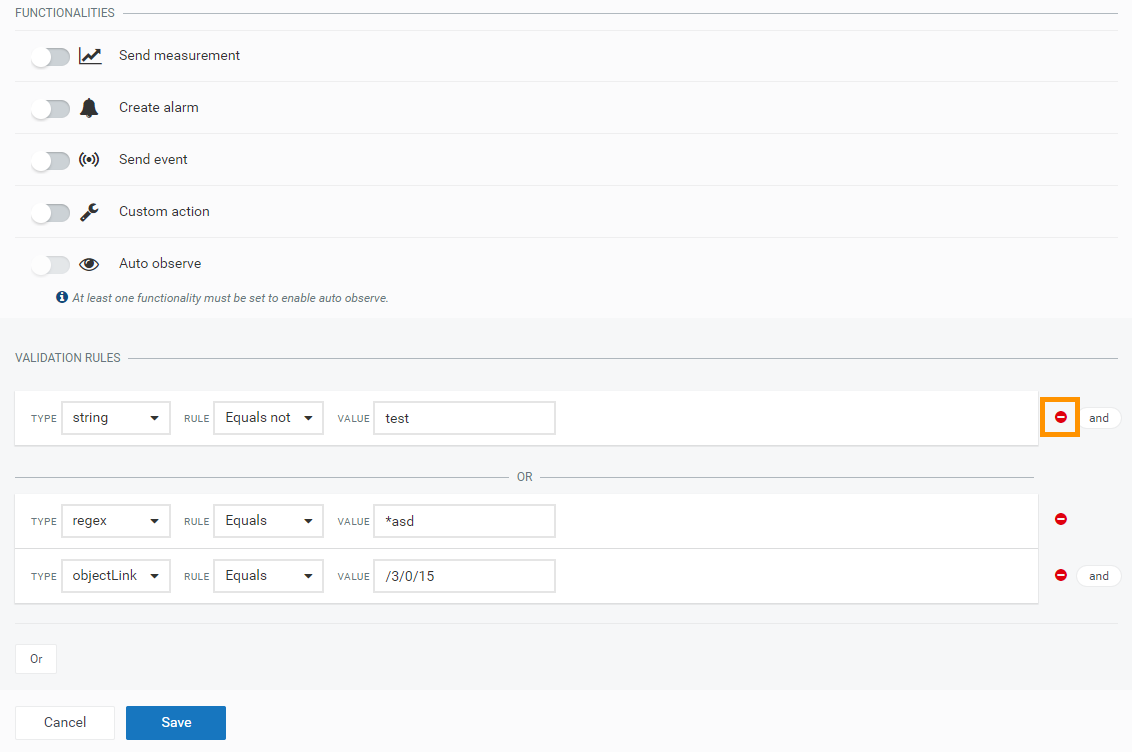
In order to enable more complex conditions, multiple validation rules can be defined for a resource:
The screenshot above provides an example for the use of validation rule groups: User input is valid if the given string does not match “test” (equals not). It is also valid if it ends with “asd” and it matches the contents of the LWM2M resource /3/0/15.
Complex rulesets are based on Boolean Disjunctive Normal Form, which allows arbitrary complex rules to be defined.
Cumulocity can interface with Sigfox devices through the Sigfox Cloud. You can:
The following illustration grants you a quick overview of the Cumulocity Sigfox integration:
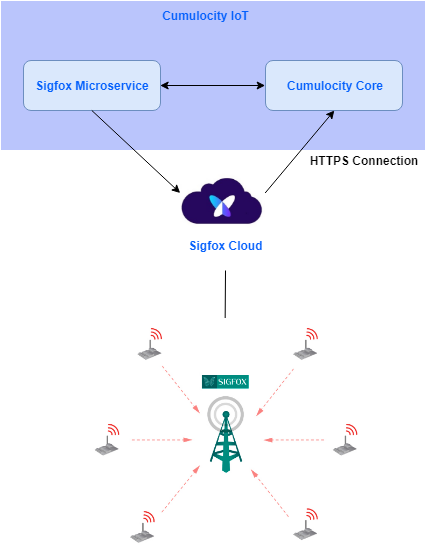
The following sections describe how to:
Moreover, check out the Troubleshooting section in case of any issues.
Info: To be able to use the Sigfox agent, your tenant needs to be subscribed to the following applications: sigfox-agent, feature-fieldbus4. In case of any issues, please contact support.
Before you register a device, you need to configure Sigfox Cloud credentials in the Connectivity page in the Administration application. You have to set up these Sigfox Cloud credentials in Sigfox.
Before you create API access to Cumulocity, you need to have an “Associated user” which is added to the Cumulocity group in Sigfox Cloud and has the following profiles:
Important: Without the profiles described below, the required Sigfox API access can not be set up.
If you already have an associated user make sure it has the profiles mentioned below and proceed to step 2.
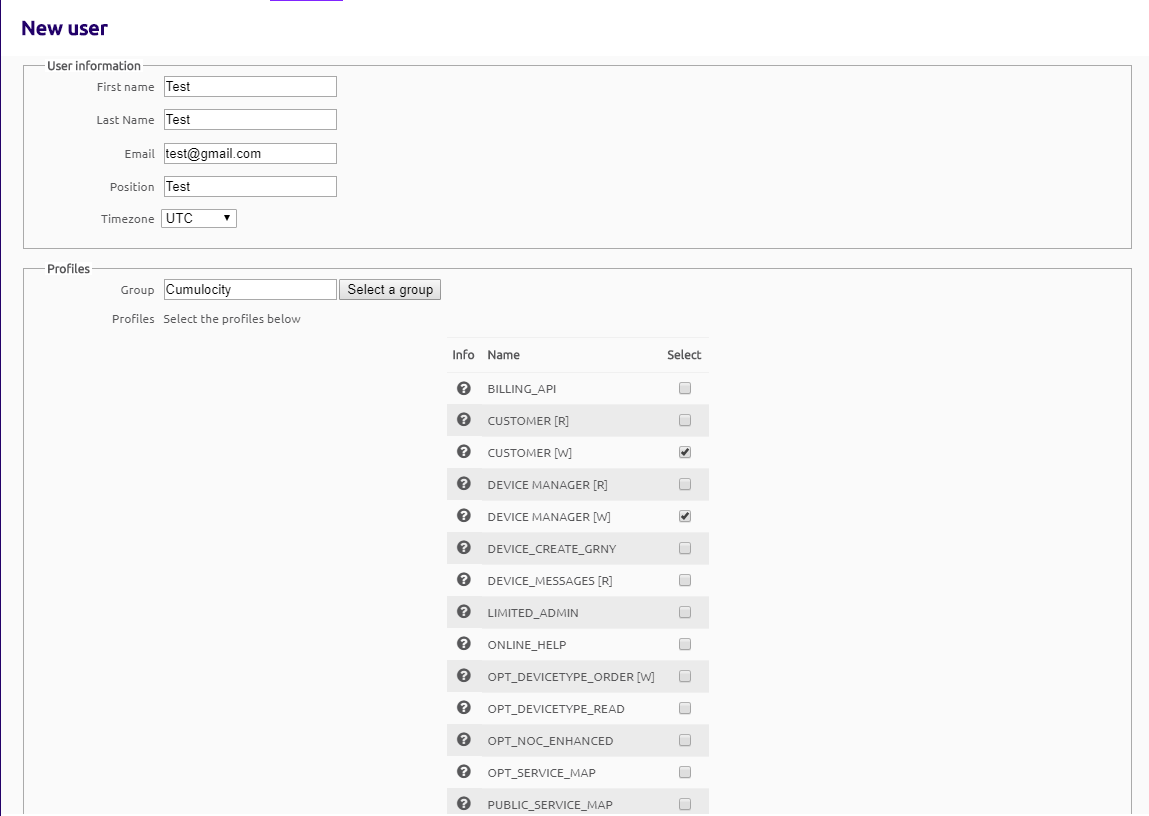
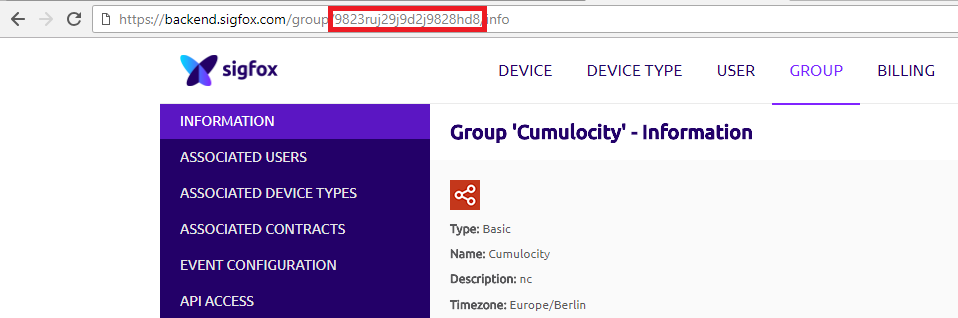
The group name is not constrained. “Cumulocity” is used as a sample group name throughout the remaining steps.
First, enter into your Sigfox Cloud account and create a new user. Add the user to the group and select the “Customer [R]” and “Device Manager [W]” profiles.
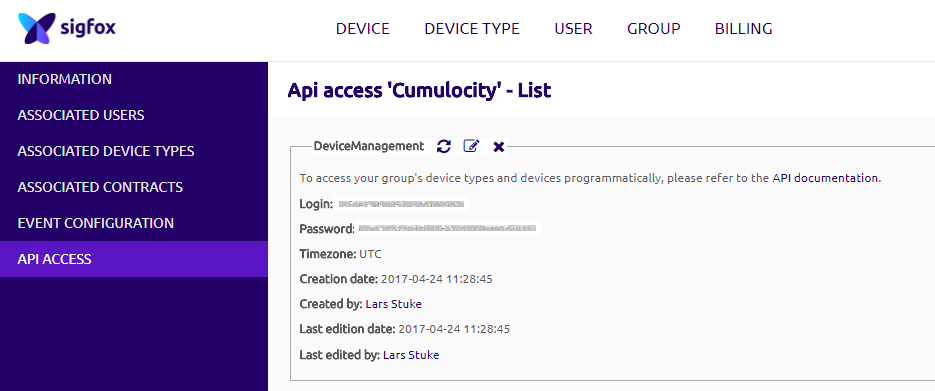
After creating an “Associated user” with the proper group and profiles navigate to the Groups page. In the API access tab, create a new entry and add the following profiles:
After the API access entry has been created, you can connect your Sigfox Cloud account to Cumulocity via the Connectivity page in the Administration application. Navigate to the Connectivity page and switch to the Sigfox provider settings tab.
The following information has to be provided:
**Info:**The group name in the screenshot below is only an example. It does not necessarily have to be “Cumulocity”.
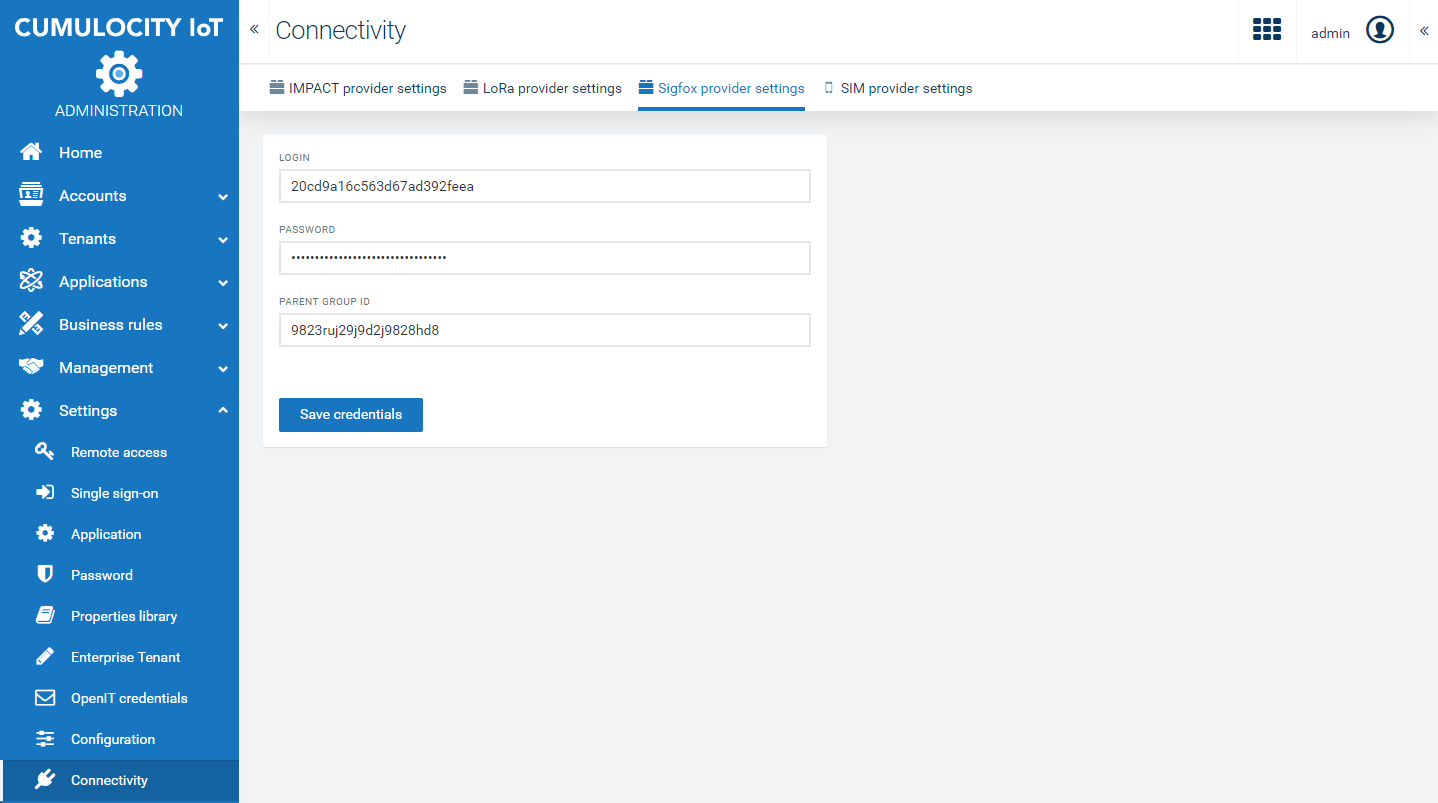
Click Save credentials to save your settings. If everything is correct, a message “Credentials successfully saved” will be displayed.
If you wish to overwrite your previous credentials, click Replace credentials and add your new credentials.
To process data from Sigfox devices, Cumulocity needs to understand the payload format of the devices. Mapping payload data to Cumulocity data can be done by creating a Sigfox device protocol.
During the device registration, you can associate this device protocol. The received uplink callbacks for this device with a hexadecimal payload will then be mapped to the ones you have configured in your device protocol.
If a device protocol has been changed after being associated to a device, the reflection of the change can take up to 10 minutes because of the refresh mechanism of the Sigfox microservice.
Info: Device protocol mapping only supports decoding for fixed byte positions based on the message type.
To create device protocols, select Device protocols in the Device types menu in the navigator of the Device Management application. You can either import an existing device protocol or create a new one.
In the Device protocols page, click Import.
Select the desired predefined device type or upload it from a file. When ready, click Import again.
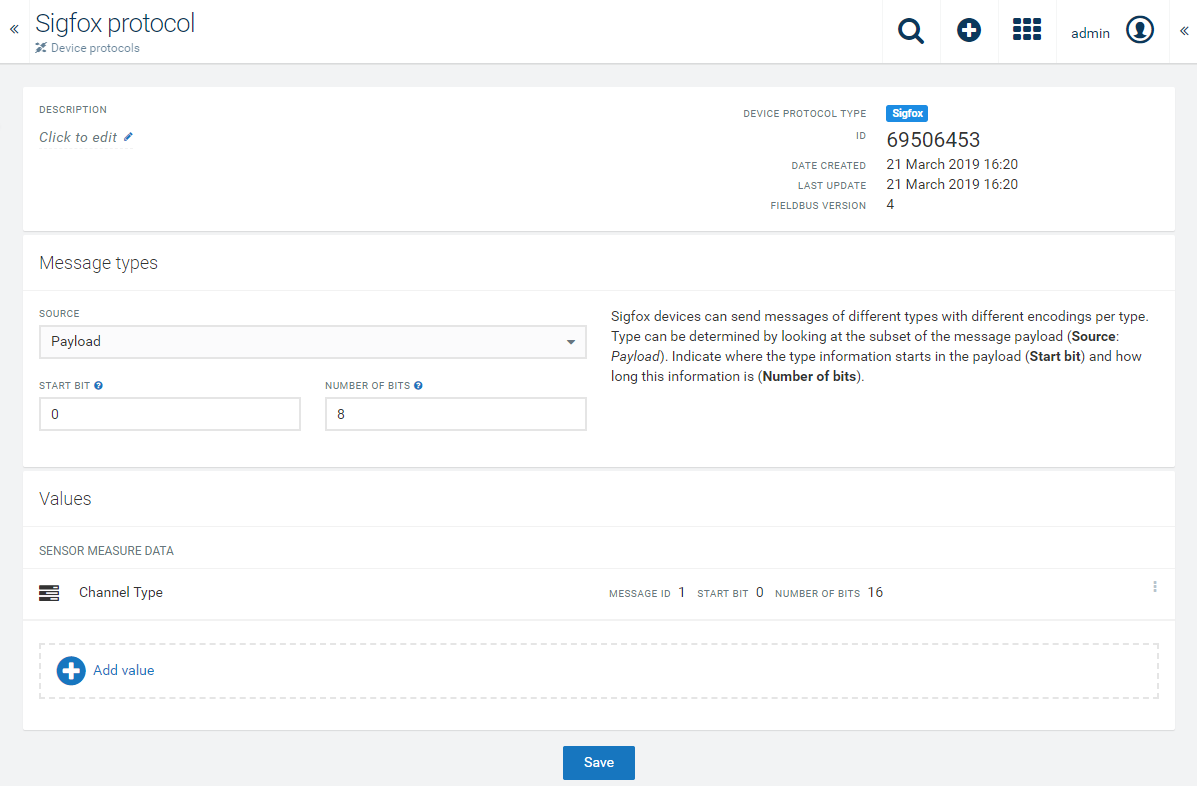
In the Device protocols page, click New device protocol and select Sigfox from the options list.
Provide a name for the device protocol an and optional description, and click Create.
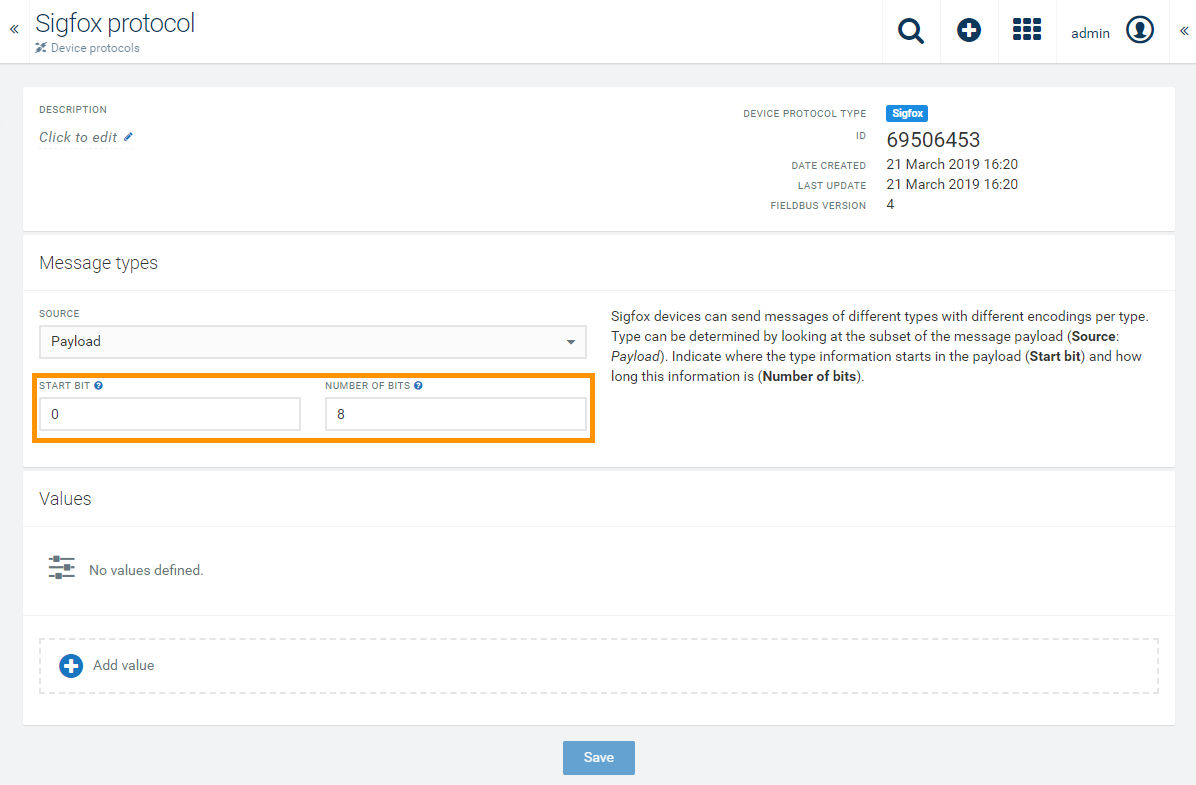
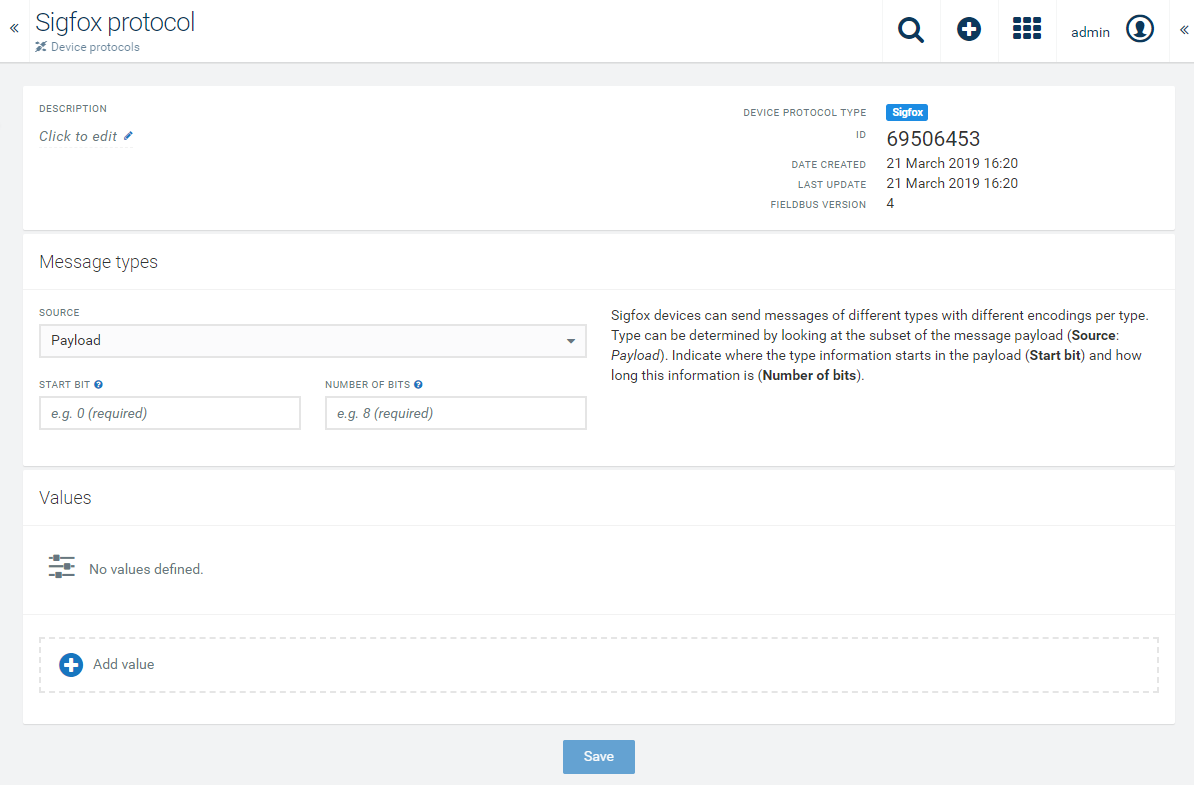
Under Message types, specify the message types. Sigfox devices can send messages of different types with different encodings per type. Depending on the device, the type can be determined by looking either at the FPort parameter of a message (Source: FPort) or at the subset of the message payload itself (Source: Payload).
In the Source field, select the way the message type is encoded:
In the following sample payload structure, the first byte indicates the message type source (as highlighted).
In the user interface, you can enter this type of message type source information as follows: In the Start bit field, indicate where the message type information starts in the payload. In the Number of bits field, indicate how long this information is. For example, start bit = “0” and number of bits = “8”.
Click Add value to create the value configuration.
In the following window, configure the relevant values as shown in this example.
The value configuration maps the value in the payload of a message type to the Cumulocity data.
Under Message type, configure the Message ID according to your device message specification. The message ID is the numeric value identifying the message type. It will be matched with the message ID found in the source specified on the device protocol main page (i.e. Payload or FPort). The message ID needs to be entered in decimal numbers (not hex).
In this sample payload structure the message ID is “1”.
Under General, specify a name for the value and the category under which it will be displayed in the values list.
Under Value selection, specify from where the value should be extracted. In the Start bit field, indicate where the value information starts and in the Number of bits field, indicate the length of the information.
In this example, the “Channel 1 Type” information starts in byte 2 (i.e. start bit = “16”) and is 1 byte long (i.e. number of bits = “8”).
The hexadecimal value is converted to a decimal number and afterwards a “value normalization” is applied.
Under Value normalization, specify how the raw value should be transformed before being stored in the platform and enter the appropriate values for:
For detailed information on how to decode the payload, refer to the documentation of the device.
Under Options, select on of the following options, if required:
Under Functionalities, specify how this device protocol should behave:
You can also have a nested structure with several values within a measurement, event or managed object fragment. In case of a measurement, all the properties of the same type will be merged to create a nested structure. In case of an event or a managed object all the properties with the same fragment are merged to create a nested structure. (Also refer to the example of a nested structure for a “Position” device protocol below.)
Click OK to add the values to your device protocol.
Click Save to create the device protocol.
Example with single property
The following images show an example for a message which sends a measurement when the battery level value changes.
The following images show an example of a nested structure for a device protocol, reporting the current position of a GPS device. The device protocol is named “Position” and contains values for longitude and latitude.
The message ID should be the same for all the values. Enter the rest of the parameters according to the instructions above. Enter “c8y_Position” in the Managed object fragment field and create a new value for each: longitude and latitude.
This will be the result:
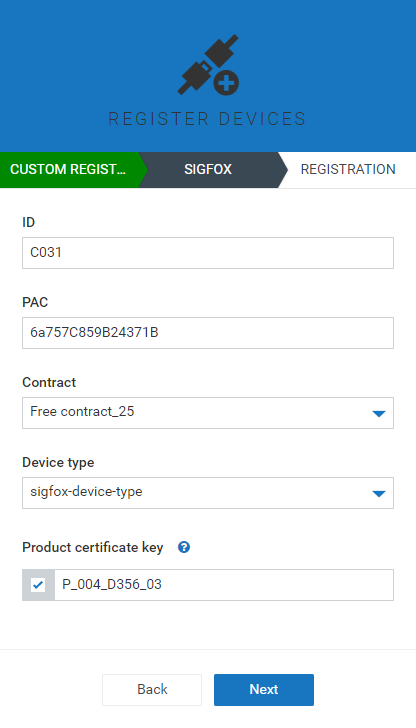
To register a Sigfox device, navigate to the Registration page in the Devices menu in the Device Management application and click Register devices. In the upcoming window, select Custom device registration and then Sigfox.
Info: If Sigfox is not one of the available options, your tenant is not subscribed to the relevant applications, see information at the top.
In the next window, fill in the required information:
Info: The term “Device type” is used both by Sigfox and Cumulocity, but with different meaning. In Sigfox, a device type specifies how to route data from devices. In Cumulocity, a device type describes the data that is sent by devices of a particular type.
After clicking Next the device registration request will be submitted and the device will be created.
You can verify that the device is really connected by checking that events are actually coming in. You can do so by clicking on a device and opening its Events tab. All events related to this device are listed here.
For more information on viewing and managing your connected devices, also refer to Device Management.
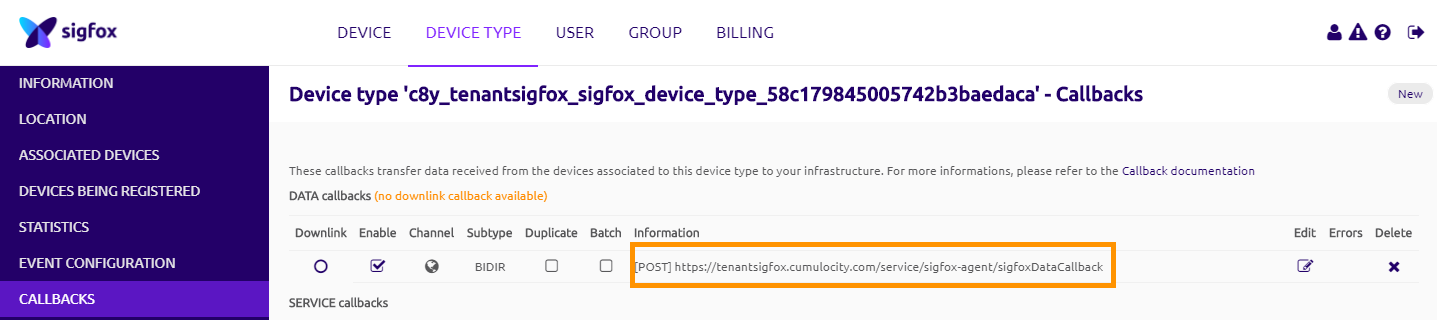
If devices have previously been registered via the general device registration the following URLs have to be manually changed in the Sigfox Cloud:
https://sigfox-agent.cumulocity.com/sigfoxDataCallback to https://<tenantId>.cumulocity.com/service/sigfox-agent/sigfoxDataCallbackhttps://sigfox-agent.cumulocity.com/sigfoxServiceAcknowledgeCallback to https://<tenantId>.cumulocity.com/service/sigfox-agent/sigfoxServiceAcknowledgeCallbackhttps://sigfox-agent.cumulocity.com/sigfoxServiceStatusCallback to https://<tenantId>.cumulocity.com/service/sigfox-agent/sigfoxServiceStatusCallbackhttps://sigfox-agent.cumulocity.com/sigfoxErrorCallback to https://<tenantId>.cumulocity.com/service/sigfox-agent/sigfoxErrorCallbackInfo: General device registration for Sigfox devices is no longer supported.
If the device supports sending hexadecimal commands, you can send commands from the “Shell”. In the Device Management application, navigate to the device you want to send an operation to in the All devices page. Switch to the Shell tab.
Info: Operations do not go to executing state immediately. They go to executing state when the device is expecting the downlink message. Afterwards, the pending operation which is created first goes to executing state.
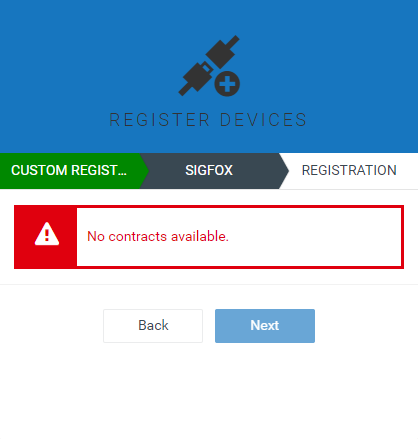
In order to resolve this error, please contact support.sigfox.com to create a contract for your Sigfox account.
The information for the callback setup is retrieved by a microservice.
To verify whether your setup is correct, execute the following REST API request:
```http
GET {{url}}/tenant/currentTenant
```
Info: The request above is simply an example API request that could be used. For more info on REST API requests, refer to the Tenants in the Reference guide.
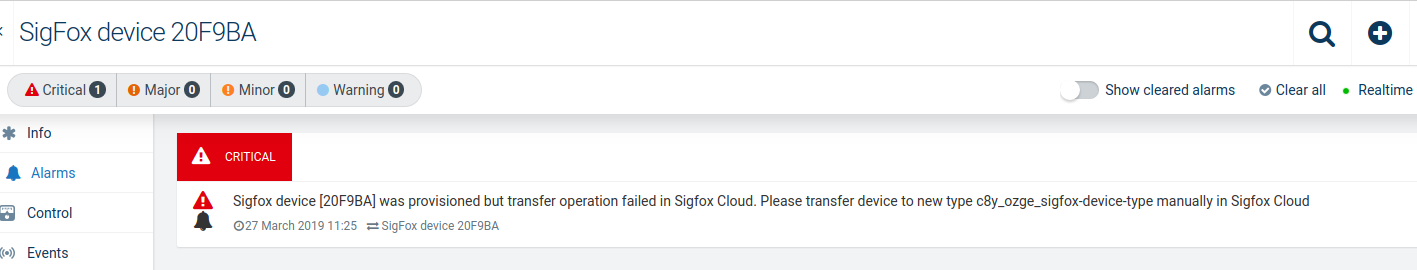
If the “transfer operation failed” alarm is triggered, the device is already provisioned in the Sigfox platform and changing the device type in the Sigfox platform failed. In order to fix this issue, you have to manually change the device type in the Sigfox platform to the intended one.
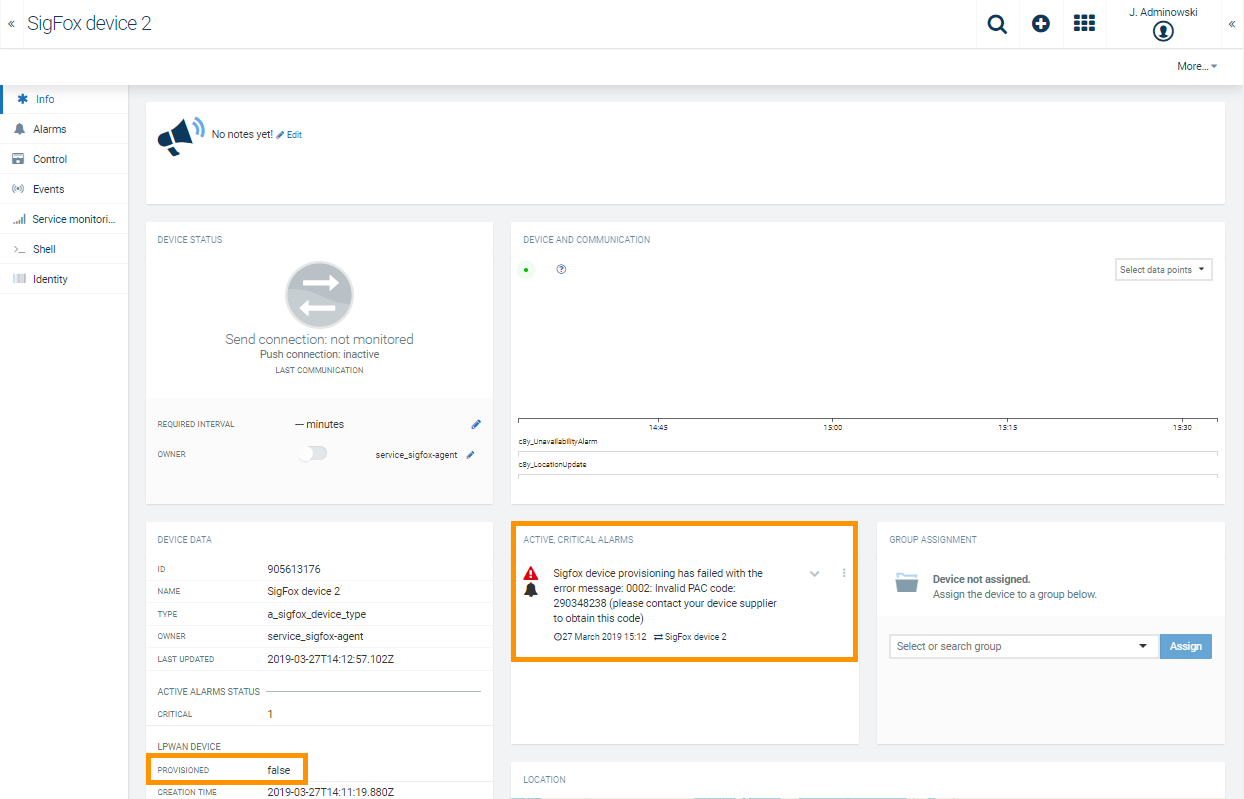
In case of this alarm, you can see that the Provisioned status is set to “false” which means that no data is coming from the Sigfox platform. In the alarm message there is more information regarding the error. In this case the PAC code given during registration was invalid.
Info: If the provisioning process has been completed, but has failed, information is returned as an alarm with the reason of the failure provided.
The Provisioned status is set to true when the device provisioning process is completed and success information is received from the Sigfox platform. Additionally, it is set to true when uplink messages are retrieved from the device.
Info: The status is updated asynchronously which means that sometimes you might have to wait a bit until it is set to true.
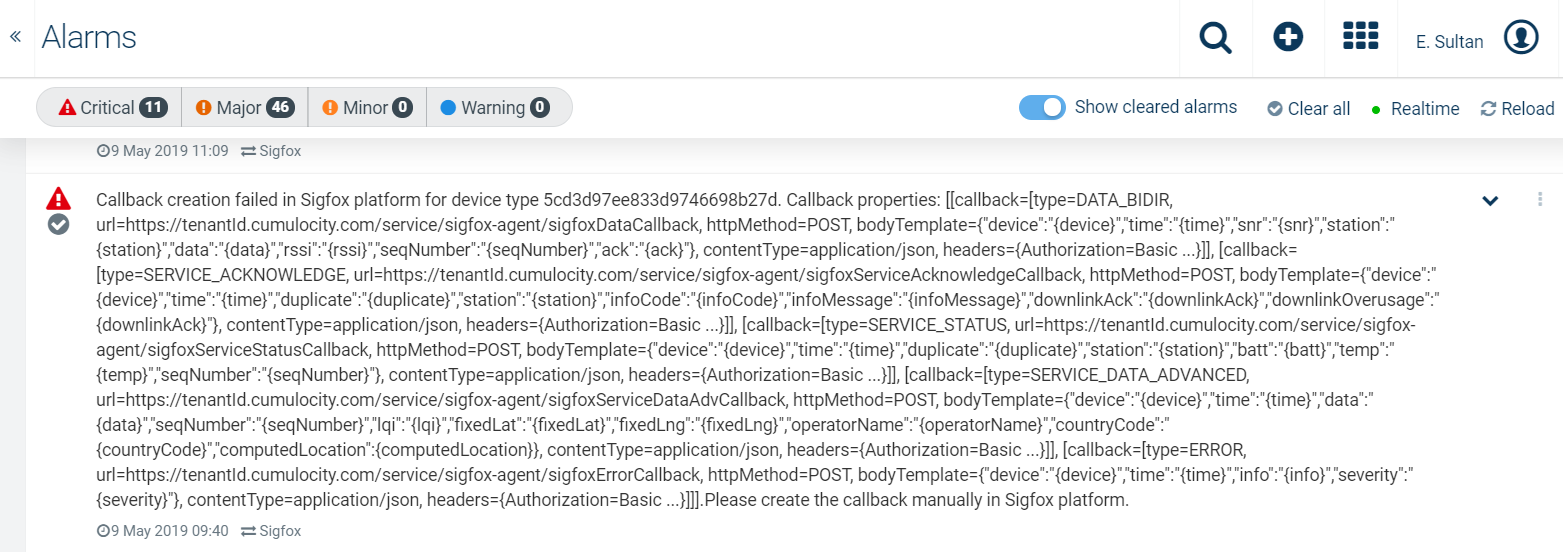
This alarm is created when one or more callback creation requests have failed in the Sigfox platform. You can view the alarm either in the Alarms page or in the Home page.
In order to fix this issue, navigate to the Sigfox platform web interface and check the device type with the id mentioned in the alarm.
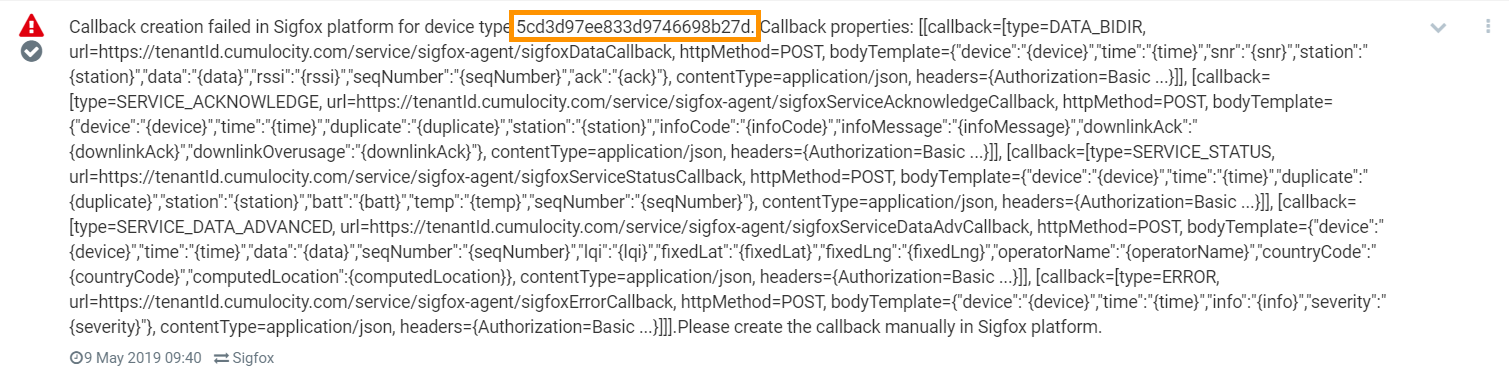
In this case navigate to the following address: https://backend.sigfox.com/devicetype/5cd3d97ee833d9746698b27d/callbacks
If the mentioned callbacks cannot be located in the Sigfox platform, you must create them manually. All of the required information needed for the creation of the callbacks is already given in the alarm description. In the case of the above alarm, the following callback is listed first:
In order to manually create the callback, the following properties must be filled:
Info: The Authorization header displayed in the alarm does not show the user credentials.
Non-mentioned properties from the alarm are:
These properties will be set to false.
The Tenant SLA Monitoring service lets service providers monitor the availability and response time of tenants and sub-tenants.
Info: The Tenant SLA Monitoring service is only available to the main Management Tenant.
In detail, it offers the following features:
By using Tenant SLA Monitoring, service providers can instantly check
Use the the Device Management application to visualize Tenant SLA Monitoring data.
The management tenant needs to be subscribed to the application “Tenant-sla-monitoring” to see any monitoring results.
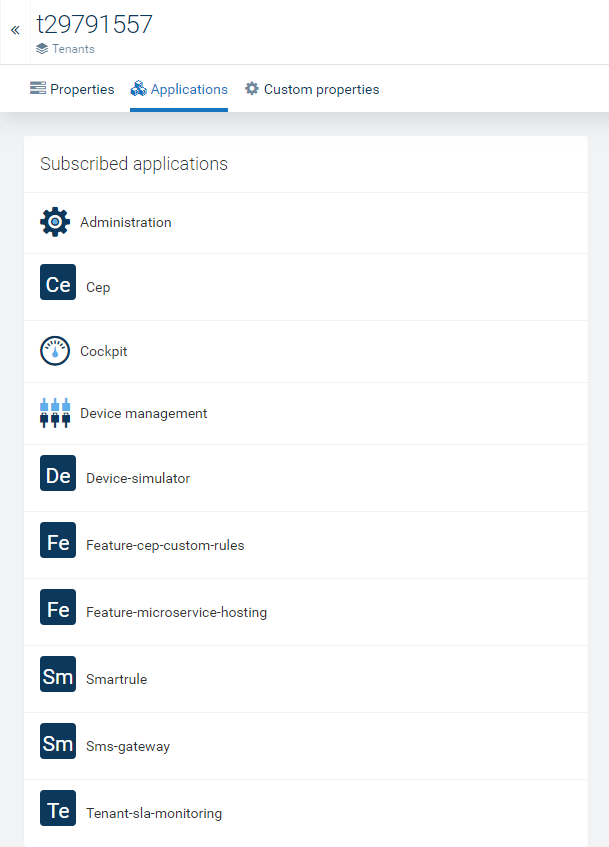
For details on application subscription, refer to Enterprise Tenant > Managing Tenants > Application in the User guide.
Every 5 minutes, the Tenant SLA Monitoring service probes for the response time of each tenant, and all its sub-tenants (if not disabled), and stores the results.
To be able to do so, the service automatically subscribes to all sub-tenants of a subscribed tenant, to get its credentials and gain access to its API.
Moreover, for each subscribed tenant (i.e. management tenant), a source in the Device Management application is created in which the monitoring results, including those of the sub-tenants, are stored as measurements.
To view the measurements showing the monitoring results, open the management tenant´s source (device) in All devices in the Device Management application and switch to the Measurements tab.
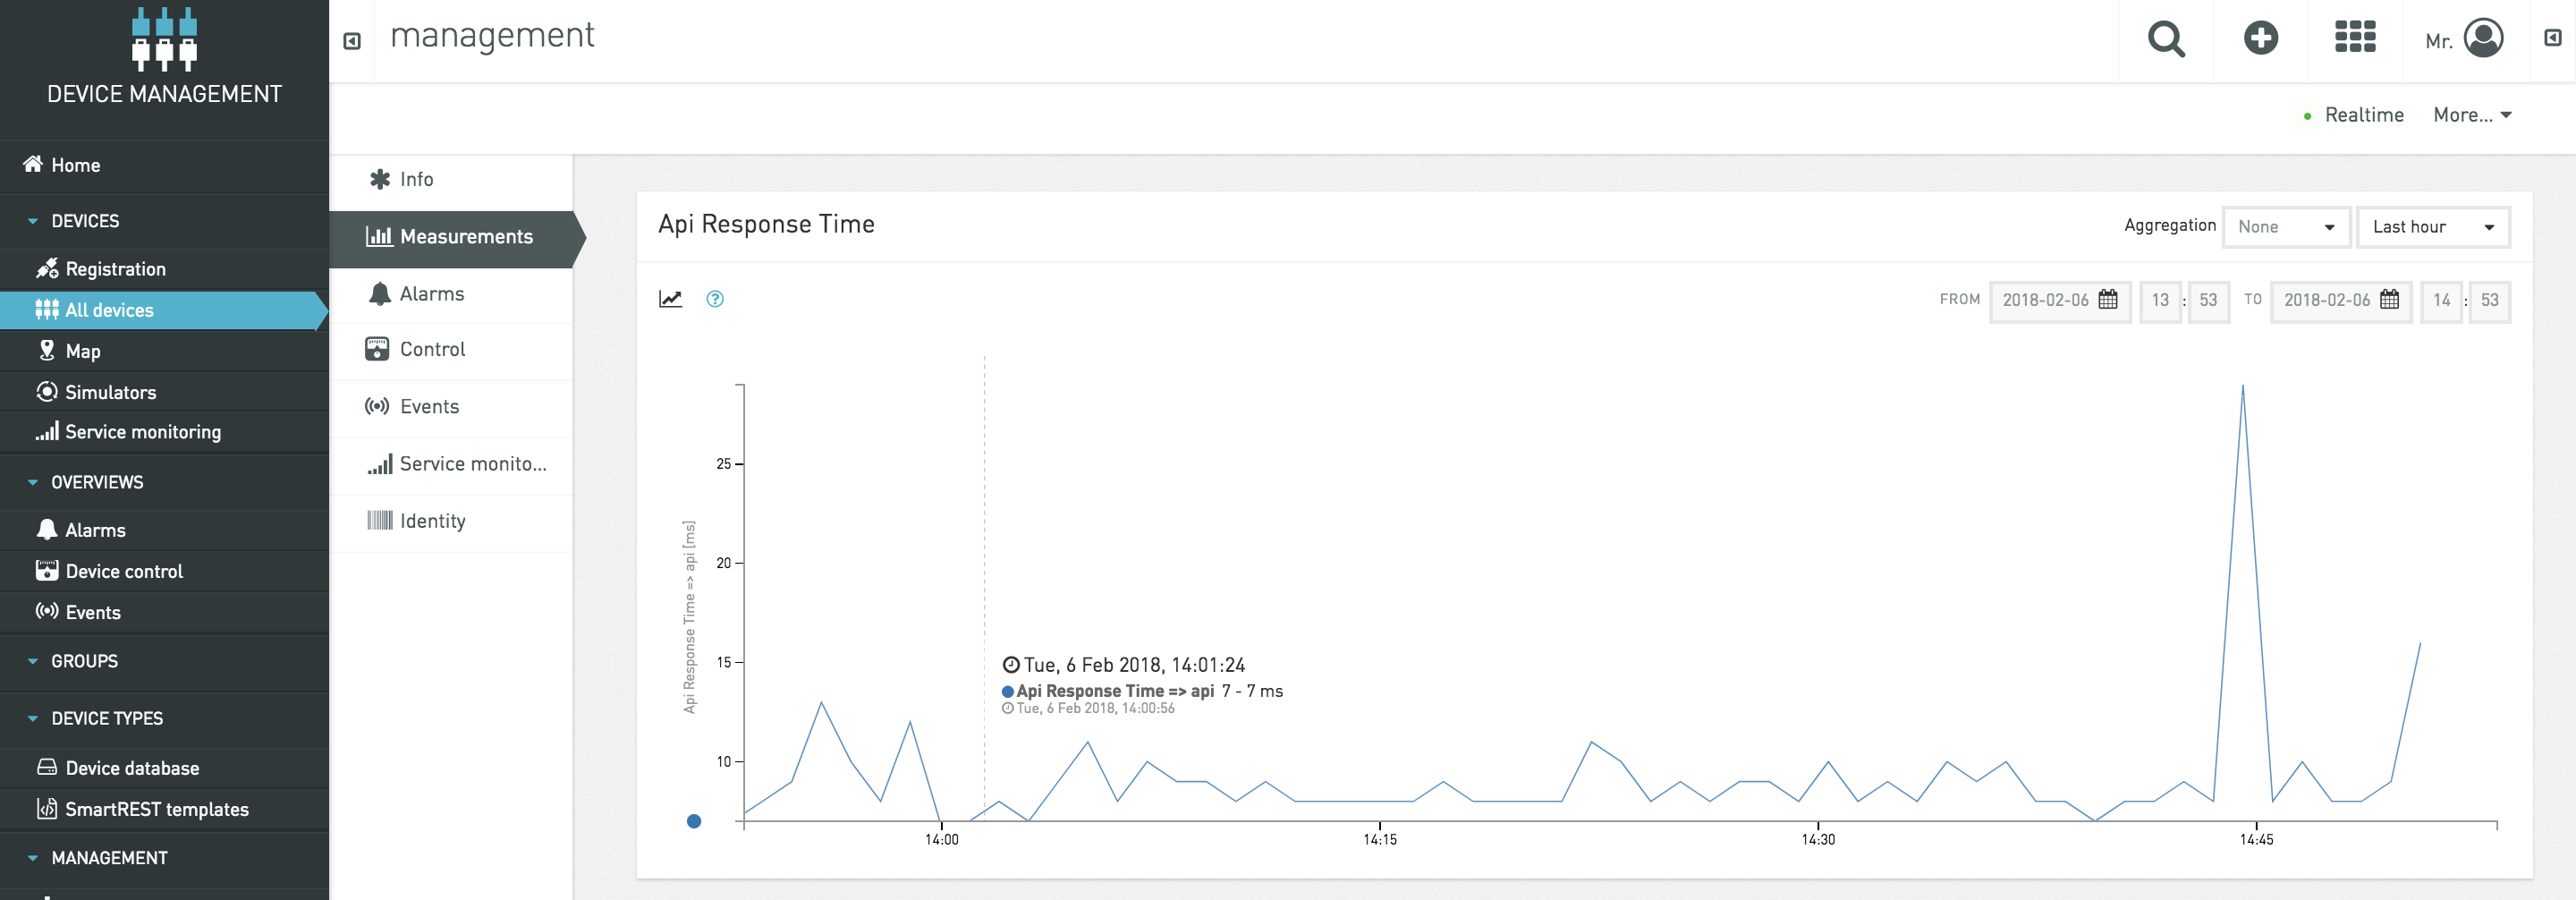
In the API Response Time diagram, you see the response time of the tenants in milliseconds.
Additionally, you will find diagrams showing the average availability values for the tenants for the following periods:
These average values are calculated by summing up the timespan of all timeout and response time alarms (e.g. created if data is missing, see below) for the specific time period and divide it by the total timespan.
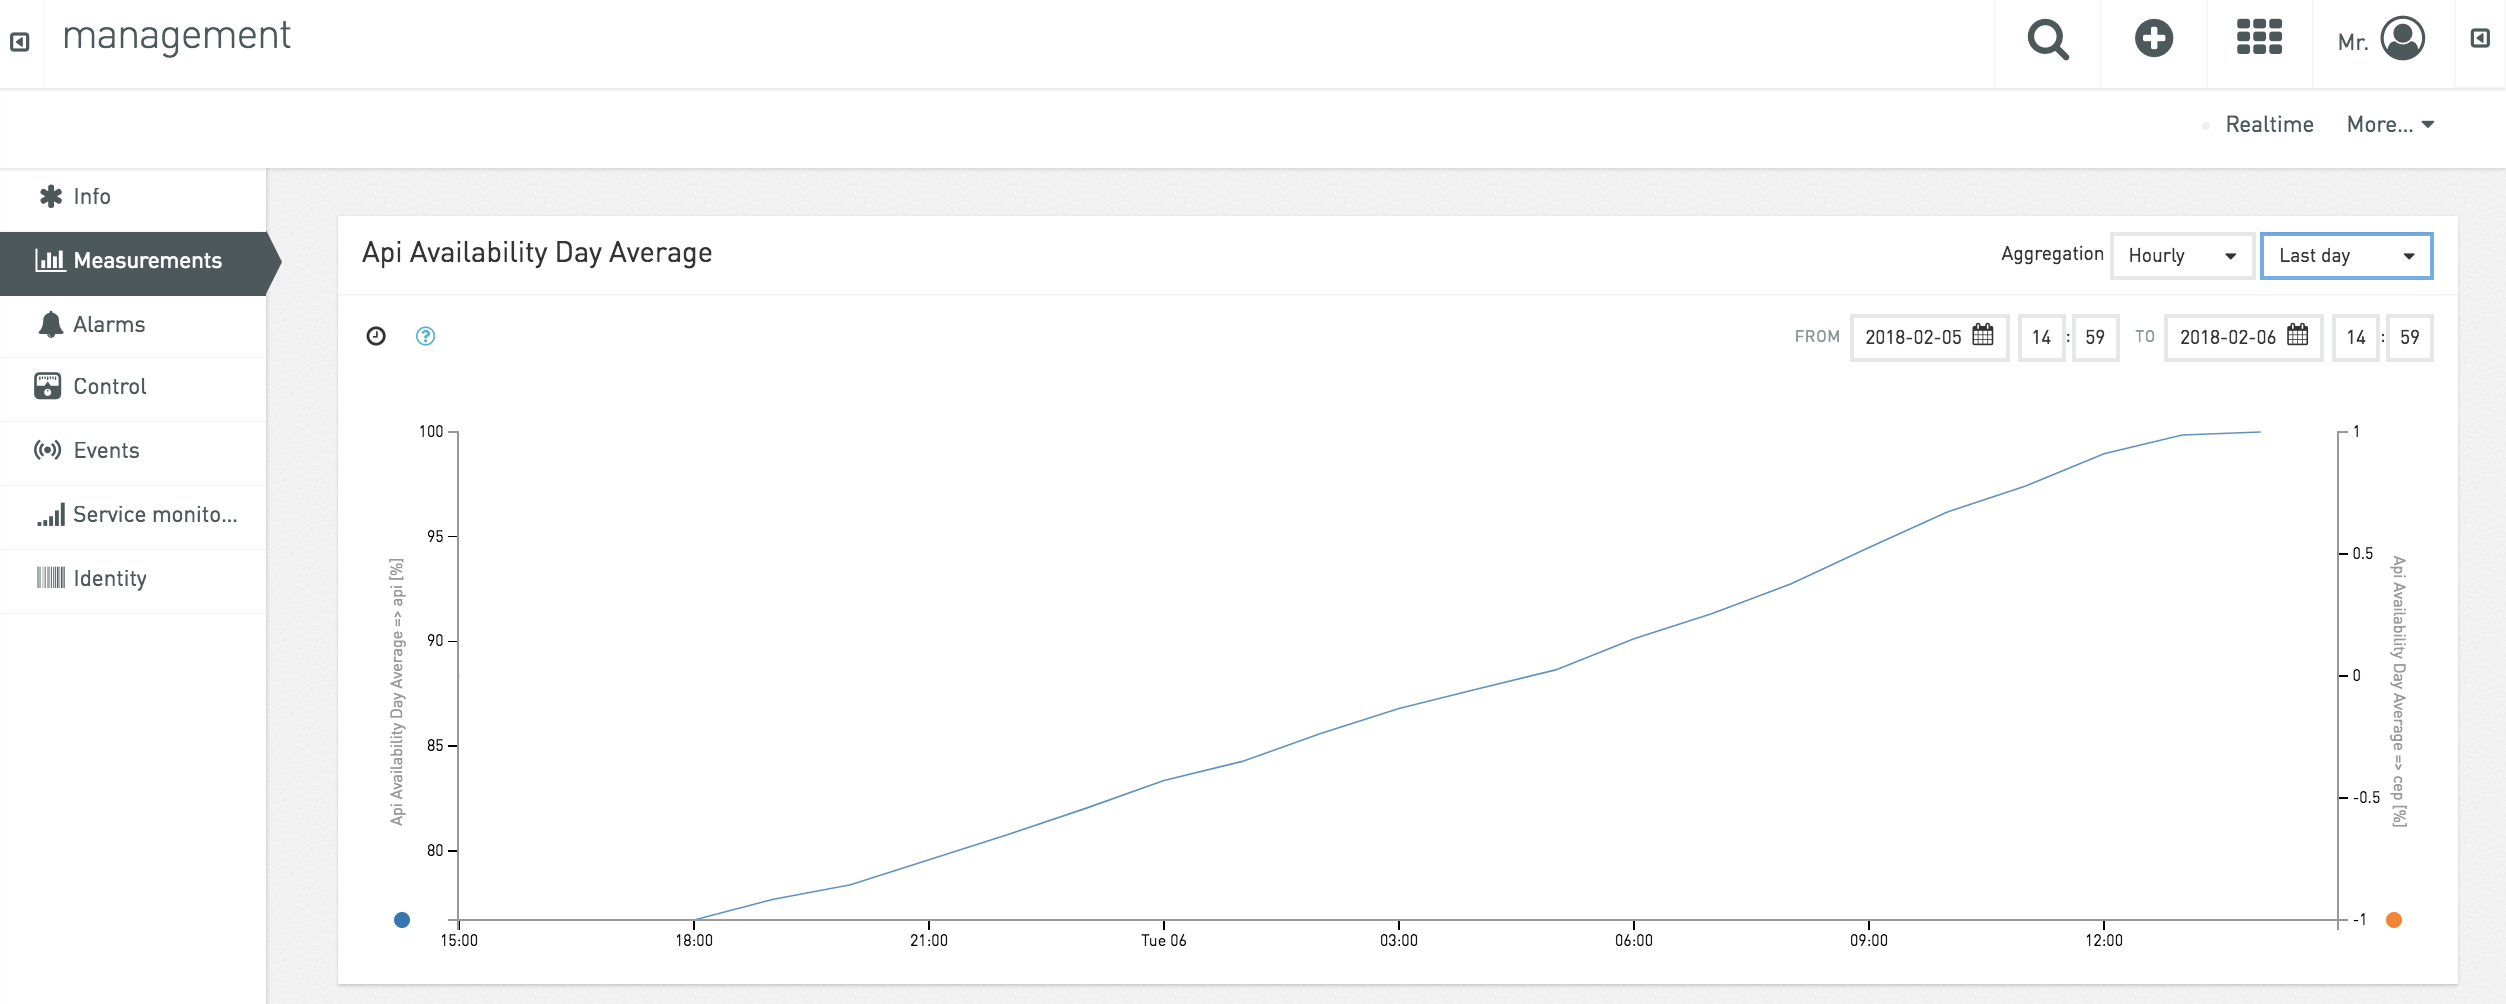
For further details on measurements refer to Device Management > Device details > Measurements in the User guide.
The Tenant SLA Monitoring service will create alarms in case of the following scenarios:
These alarms are used to calculate the availability of the system in percentage, shown as measurements (see above).
To view recent alarms, switch to the “Alarms” tabs of the management tenant´s source.
Since 2018, webMethods Integration Cloud can be used to integrate with Cumulocity IoT. With the launch of a common Software AG Cloud platform, the integration has been further enhanced by providing single sign-on access between webMethods Integration Cloud and Cumulocity IoT for a seamless experience.
More information on the webMethods Integration Cloud is available at https://www.softwareag.cloud/site/product/webmethods-integration.html.
Info: Related to this, support for the Cumulocity Zapier integration will be discontinued. No new subscriptions are possible with immediate effect. Functionality for existing customers is not affected.