Device Management
The Device Management application provides functionalities for managing and monitoring devices and enables you to control and troubleshoot devices remotely.
The Device Management application provides functionalities for managing and monitoring devices and enables you to control and troubleshoot devices remotely.
The following sections will walk you through all functionalities of the Device Management application in detail. For your convenience find an overview on the content of this document below.
| SECTION | CONTENT |
|---|---|
| Connecting devices | How to register one or more devices manually and how to bulk-register devices in order to connect devices to your account. |
| Viewing devices | What is displayed in the device list and how to sort devices by searching for devices and filtering devices. |
| Grouping devices | Why and how to group devices into top-level groups, subgroups and smart groups. |
| Device details | Detailed description of the various kind of information available for various types of devices. |
| Monitoring and controlling devices | How to monitor the connection quality and service status of devices, how to handle alarms from devices, how to remote control and how to troubleshoot devices. |
| Managing device types | How to process data from various device types by using device protocols. |
| Managing device data | How to retrieve and manage firmware and software for devices and how to handle configuration snapshots. |
| SmartREST templates | How to work with SmartREST templates, a collection of request and response templates used to convert CSV data and Cumulocity Rest API calls. |
| Working with simulators | How to model devices with the simulator in order to have the same level of functionality as connected hardware devices. |
In the Device registration page all devices which currently are in the registration process are displayed either in a list or in a grid.
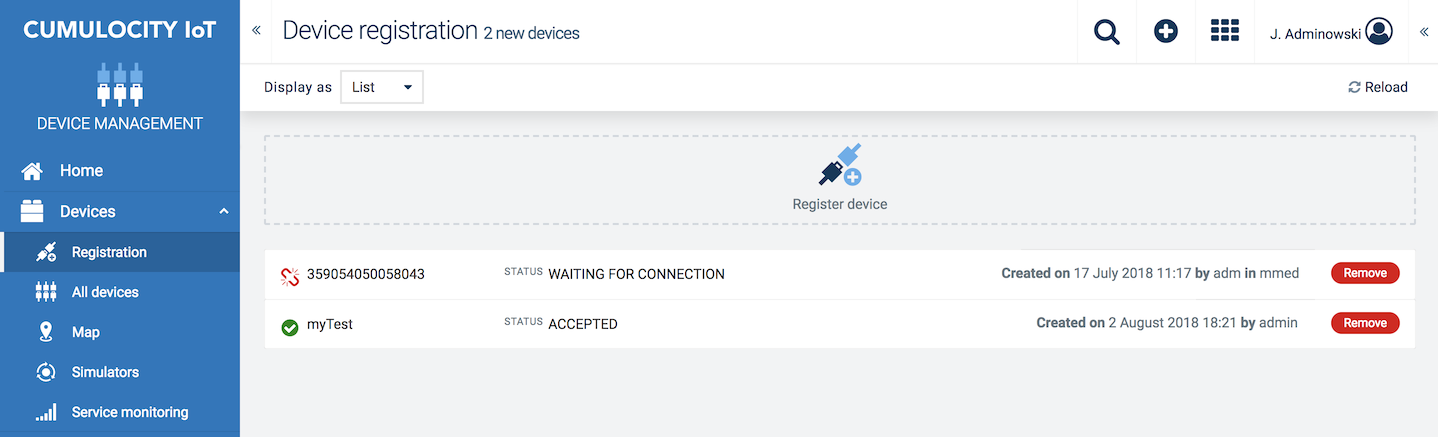
The following information is shown for each device:
The devices may have one of the following status:
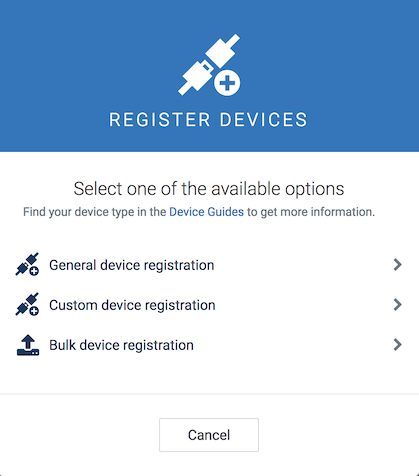
To register devices, you may choose one of the following options:
If you are subscribed to the required applications you will see a third option Custom device registration for registering devices of specific types, e.g. LoRa or Sigfox, see the documentation for these services in Optional services.
Info: Depending on the type of device you want to connect, not all steps of the following process may be relevant.
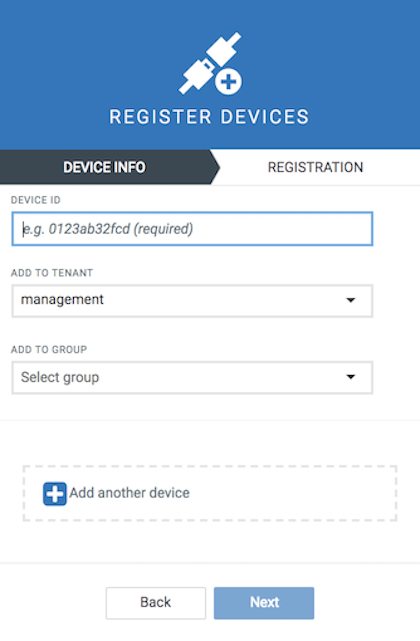
Click Registration in the Devices menu of the navigator and then click Register device.
In the resulting Register devices dialog box, select General device registration.
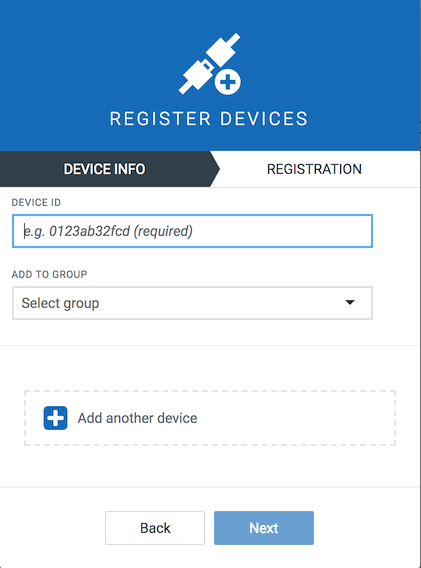
In the Device ID field, enter a unique ID for the device. To determine the ID, consult the device documentation. In case of mobile devices the ID usually is the IMEI (International Mobile Equipment Identity) often found on the back of the device.
Optionally, select a group to assign your device to after registration, see also Grouping devices.
Click Add another device to register one more device. Again, enter the device ID and optionally select a group. This way, you can add multiple devices in one step.
Click Next to register your device(s).
Info: In an Enterprise Tenant, the management tenant may also directly select a tenant to which the device will be added from here. Note that since the management tenant does not have access to the subtenant’s inventory you can either register devices to a tenant OR to a group, not both.
After successful registration the device(s) will be listed in the Device registration page with the status Waiting for connection.
Turn on the device(s) and wait for the connection to be established. Once a device is connected, its status will change to Pending acceptance. Click Accept to confirm the connection. The status of the device will change to Accepted.
Info: In case of any issues, consult the documentation applicable for your device type in the Devices guide or look up the manual of your device.
To connect larger amounts of devices, Cumulocity offers the option to bulk-register devices, i.e. to register larger amounts of devices by uploading a CSV file.
Click Registration in the Devices menu of the navigator and then click Register device.
In the resulting Register devices dialog box select Bulk device registration.
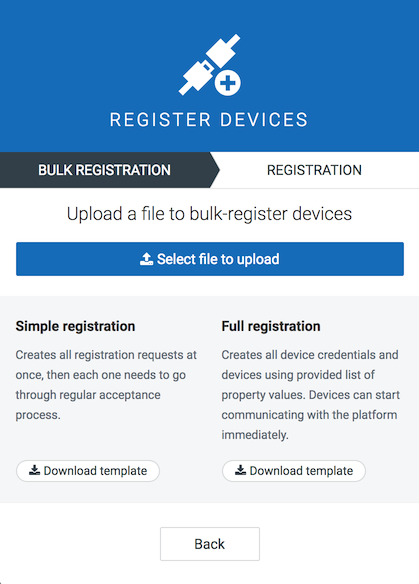
Click Select file to upload and select the CSV file you want to upload by browsing for it on your computer.
Info: Bulk registration creates an elementary representation of the device. Then, the device needs to update it to a full representation with its own status.
Simple registration
The CSV file contains two columns: ID;PATH, where ID is the device identifier, e.g. serial number, and PATH is a slash-separated list of group names (path to the group where the device should be assigned to after registration).
		ID;PATH
		Device1;Group A
		Device2;Group A/Group B
After the file is uploaded, all required new groups will be created, new registrations will be created with status WAITING FOR CONNECTION, and the normal registration process needs to be continued (see above).
Full registration
The CSV files must contain at least the IDs as device identifier and the credentials of the devices.
In addition to these columns the file can also contain other columns like ICCID, NAME, TYPE as shown in this example.
		ID;Credentials;PATH;ICCID;NAME;TYPE
		006064ce800a;LF2PWJoLG1Fz;Sample_Düsseldorf;+491555555;Sample_Device1;c8y_Device
		006064ce8077;OowoGKAbiNJs;Sample_Düsseldorf;+491555555;Sample_Device2;c8y_Device
To connect the devices, they are pre-registered with the relevant information. More specific, each device will be configured as follows:
After the data is imported, you will get feedback on the number of devices that were pre-registered as well as on any potential errors that may have occurred.
For your convenience we provide CSV template files for both bulk registration types (simple/full) which you can download to view or copy the structure.
For further information on the file format and accepted CSV variants, also refer to Bulk device credentials in the Reference guide.
Info: In an Enterprise Tenant you may also register devices across multiple tenants by adding a Tenant column to the spreadsheet and importing the CSV file from the management tenant.
To view all devices connected to your account, click All devices in the Devices menu in the navigator.
A detailed device list will be displayed.
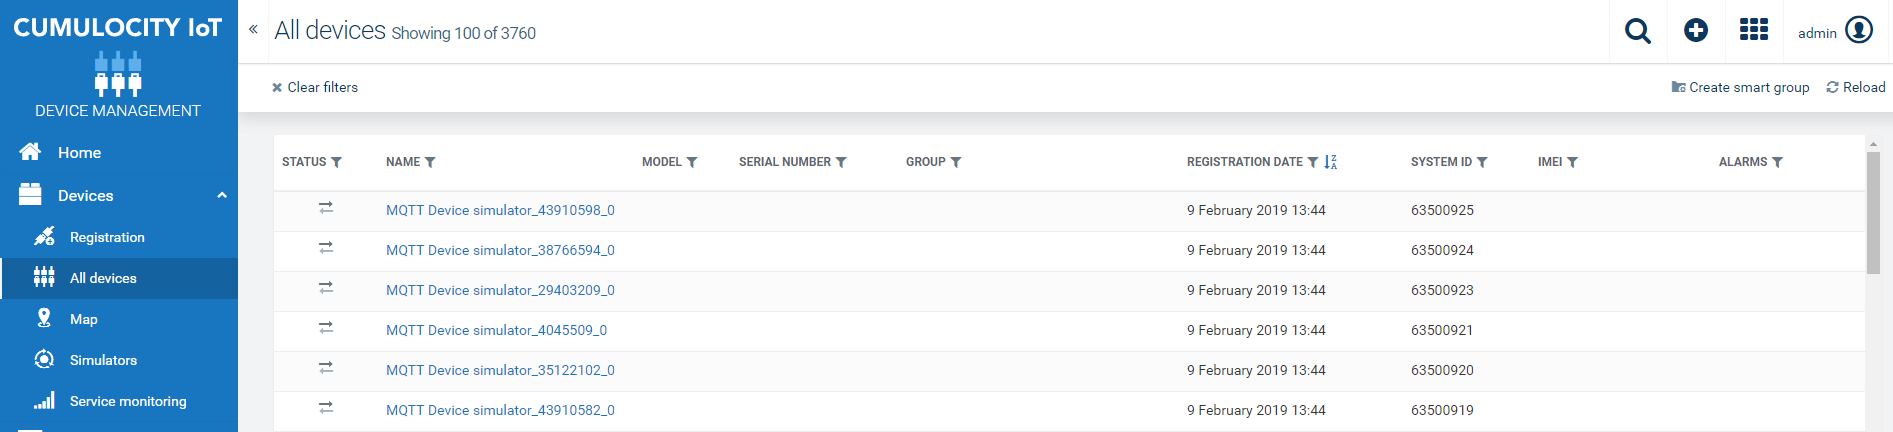
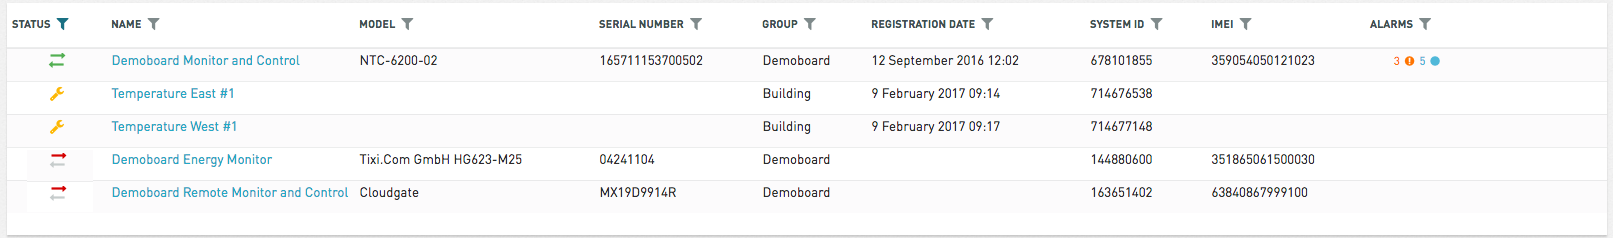
For each device, the device list shows the following information provided in columns:
| Column | Description |
|---|---|
| Status | An icon representing the connection status. For details, see Connection monitoring. |
| Name | Unique name of the device. |
| Model | Model type of the device. Not always displayed, depends on browser width. |
| Serial Number | Serial number of the device. Not always displayed, depends on browser width. |
| Group | Group the device is assigned to, if any. |
| Registration Date | Date when the device was registered to your account. |
| System ID | System ID of the device. |
| IMEI | IMEI of the device. |
| Alarms | The alarm status of the device, showing number and type of alarms currently unresolved for the device. See Working with alarms for further information on working with alarms. |
The devices list displays up to 100 rows. If a list contains more than 100 devices, click Load more at the bottom of the list to display the next 100 entries.
The device will be permanently deleted from the platform.
Important: Deleting a device means to remove the device from Cumulocity database including all its generated data. Alternatively, you can arrange all retired devices in one group, see Grouping Devices). This ensures that all reports remain correct. To prevent alarms from being raised for the retired devices, disable connection monitoring. Deleting a device does not delete the data of its child devices.
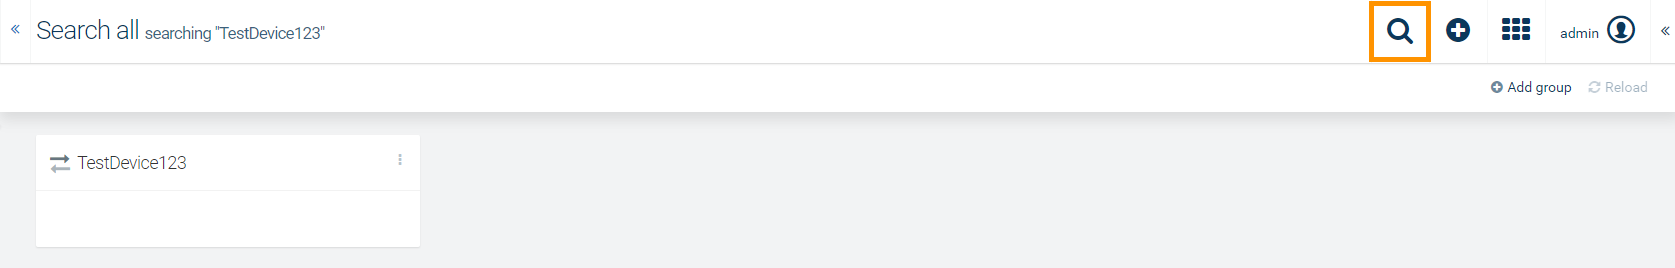
Cumulocity includes a full-text search for devices.
Click the Search button at the top right and enter a search term into the textbox. Cumulocity returns all devices containing this term in any property (name, model, any fragment…)
Our example shows a search for “Ublox C027”.
Info: Unlike filtering, the use of wildcards in a search is not supported.
For details on the search functionality, refer to Getting Started > GUI functionalities and features.
The device list offers a filtering functionality to filter devices in the list for specific criteria.
Filtering is available on every column. Just click the filter icon next to the name of the column you want to set a filter for.
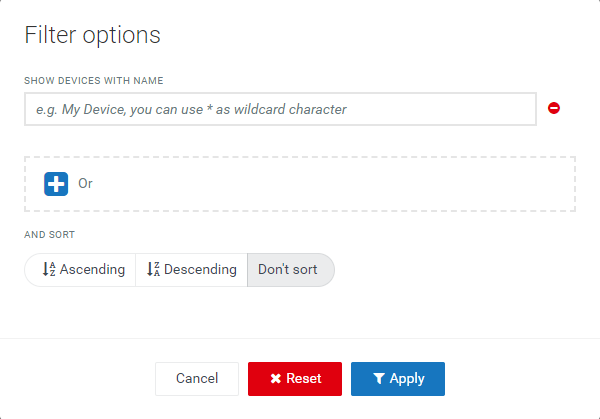
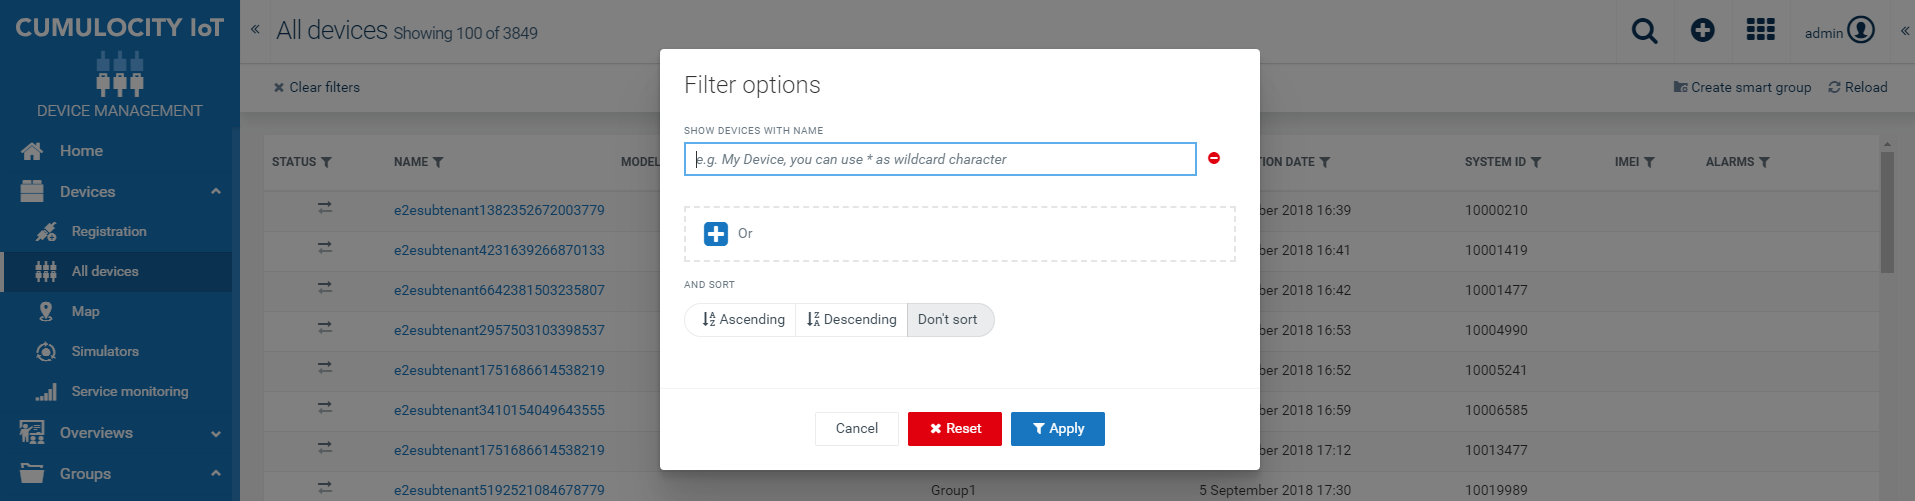
In the Filter options dialog box, specify your filter options.
Most columns represent text fields. You can filter these columns by simply entering an arbitrary text into the textbox as in the search field. Click + Or to add another textbox if you want to filter for more than one term.
Apart from filtering for text there are several other options:
In the Filter options dialog box, click Ascending or Descending if you want the devices to be sorted in a specific order. Finally, click Apply to carry out the filtering.
The devices list will now only display devices matching the filtering options.
Click Clear filters at the left of the top menu bar if you want to clear all filters and view all devices.
Info: If you select to sort a text field, e.g. device name, in ascending or descending order, keep in mind that the resulting alphabetical sorting is based on ASCII/UTF: A < B < … < Z < … < a < b … < z. Names starting with lower case letters will be sorted below all names with uppercase letters or vice versa.
Devices can be arbitrarily grouped according to a particular use case. A device can be located in multiple groups, and groups themselves can again be part of multiple groups.
Cumulocity distinguishes between top-level groups and subgroups:
Top-level groups are shown in the Group menu in the navigator at top-level.
Subgroups are used to further subdivide top-level groups.
To display a list of all groups in the account, click Groups in the navigator.
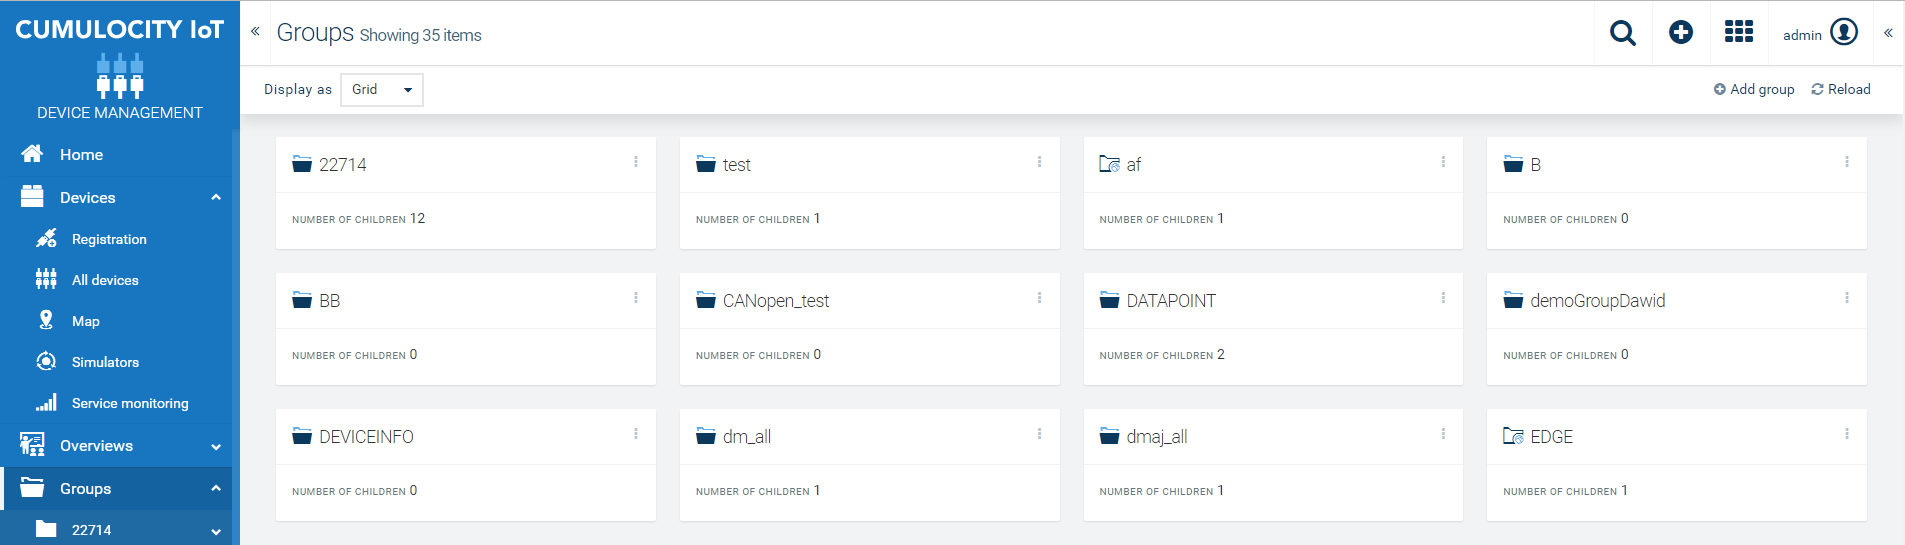
For each group, the name and the number of children is displayed.
Click a group to view its details.
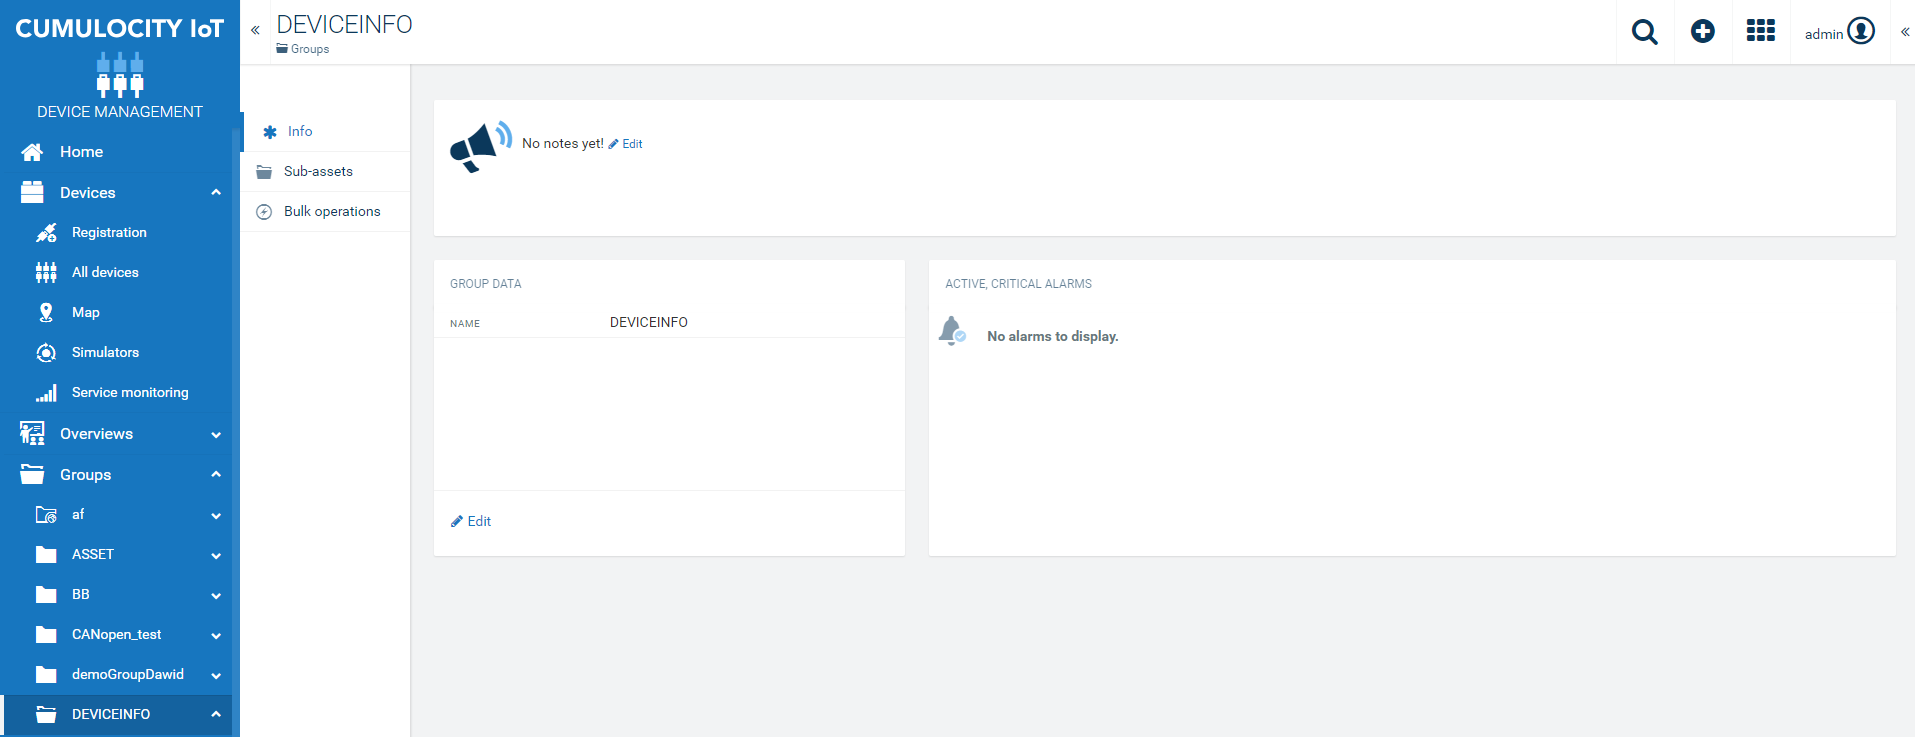
Info Tab
In the Info tab, the following information is provided:
| Card | Description |
|---|---|
| Notes | Provides optional notes to inform about current activities. Notes usually may only be edited by an administrator. To add or edit a note, click Edit, enter your note or your modifications in the text box and save your edits by clicking the green checkmark at the right of the text box. |
| Group data | Displays editable information on the group (name, description). |
| Active, critical alarms | Shows the active critical alarms for the devices in the group. |
Sub-assets
In the Sub-assets tab you see a list of all devices assigned to the group. For each device, the name and the number of children is displayed.
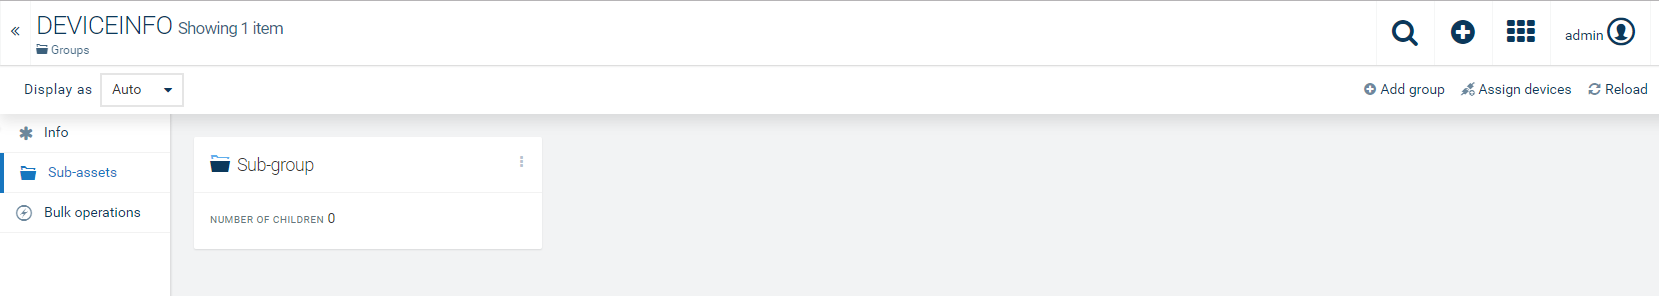
See also To add a group and To assign a device to a group.
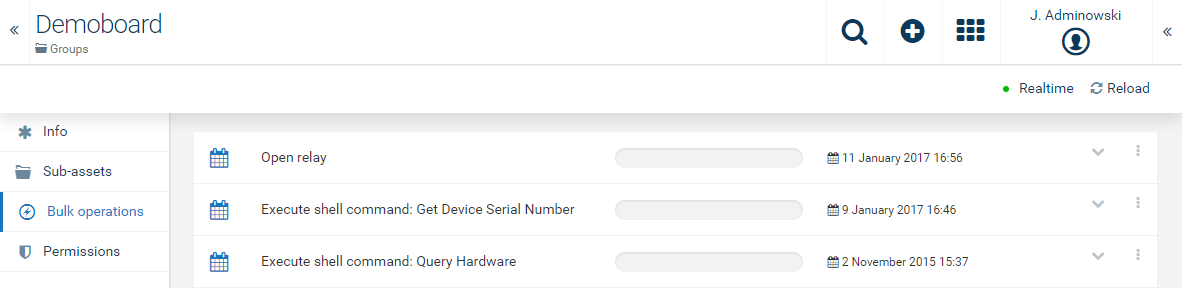
Bulk operations
In the Bulk operations tab, bulk operations created for the group can be managed. With bulk operations you can at once execute operations for each device within one group. For details, refer to Bulk operations.
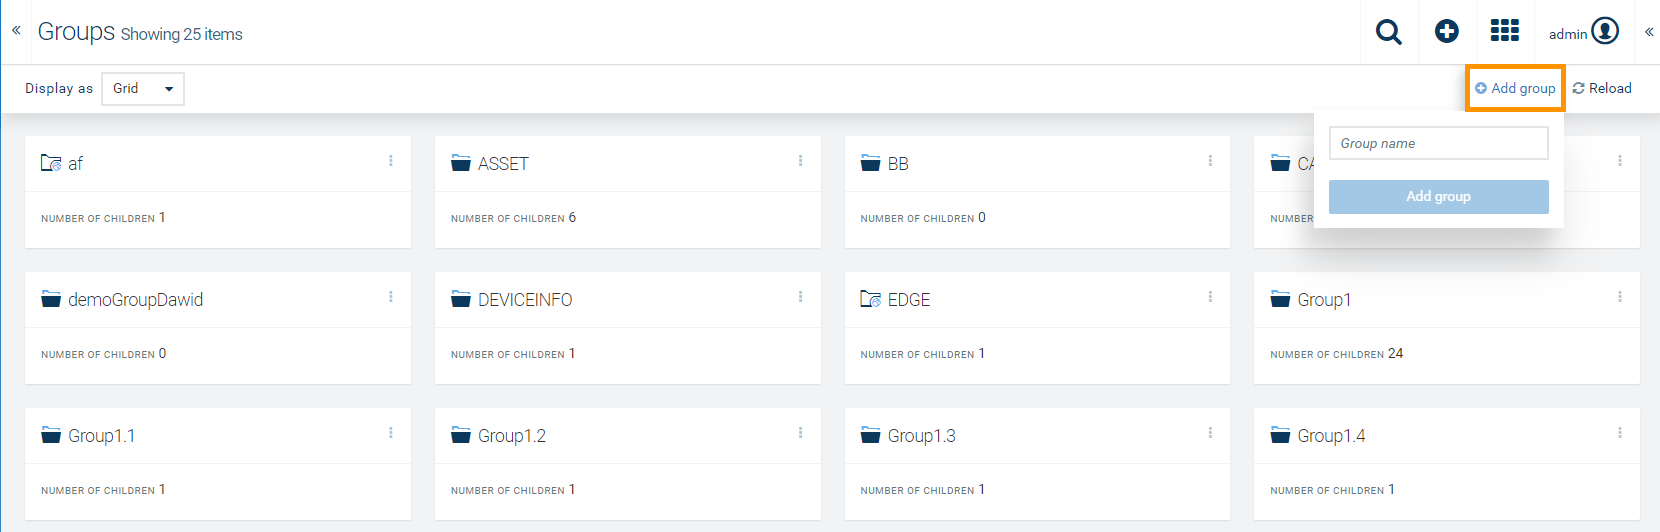
The new group will be added to the groups list.
Info: A group can be created with “0” devices in it.
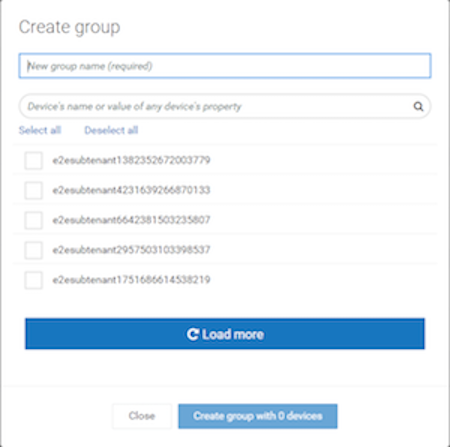
From the Groups page, you can also create a new group by clicking Add group in the top menu bar. In the resulting dialog box, enter a name for the group and click Add group.
Click the menu icon in a device entry and then click Delete.
You can assign devices to groups in several ways.
From the group perspective
You can quickly assign devices to groups by using the drag and drop functionality in the navigator, see Restructuring groups and devices.
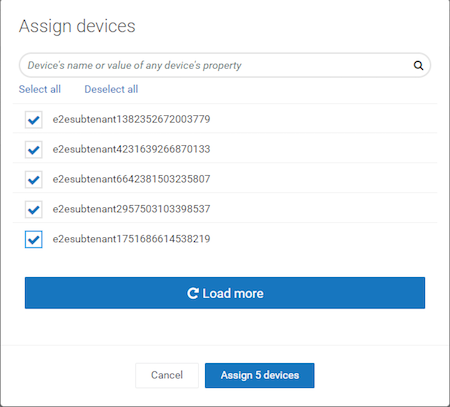
Moreover, you can assign devices performing the following steps:
The devices will be assigned to the selected group.
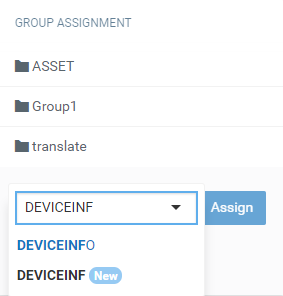
From the device perspective
The device will be assigned to the selected group.
If you search for a group by its name which does not exist yet, a New button will appear so that you can create a new group with this name from here and assign the device to that group.
Info: In order to create a new group, the user must have the permissions ROLE_INVENTORY_CREATE and ROLE_INVENTORY_ADMIN.
Click the menu icon in a device entry and then click Unassign.
Click the menu icon in a device entry and then click Delete.
The device will be permanently deleted.
Click the menu icon in a device entry and then click Device management.
The device details for the specific device stored under All devices in the Device Management application will open.
You can easily restructure groups, sub-groups and devices by a drag and drop functionality.
Smart groups are groups dynamically constructed based on filtering criteria. They have a temporary character because the group members can change constantly. Smart groups do not have fixed member listings. They have fixed criteria instead. This type of group can be used, for example, for bulk upgrades of devices of a certain type to a new software or firmware version.
Note that smart groups are only available in the Device Management application and not visible in the Cockpit application.
Smart groups can be created from the device list.
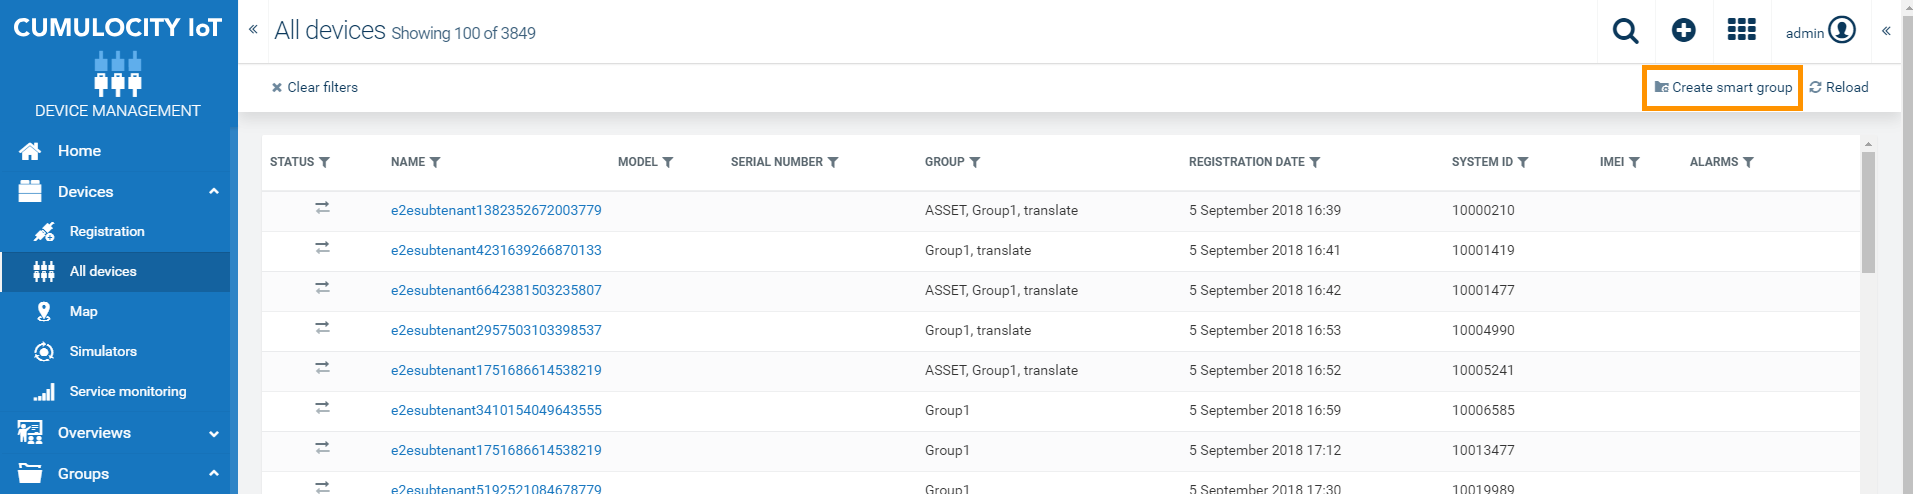
The new group will appear as a top-level group in the Groups menu of the navigator. Smart groups can be distinguished by a small cogwheel in the folder icon.
![]()
In the Sub-asset tab you can adjust your selection and modify the filter settings.
To delete a smart group, click the menu icon and then click Delete.
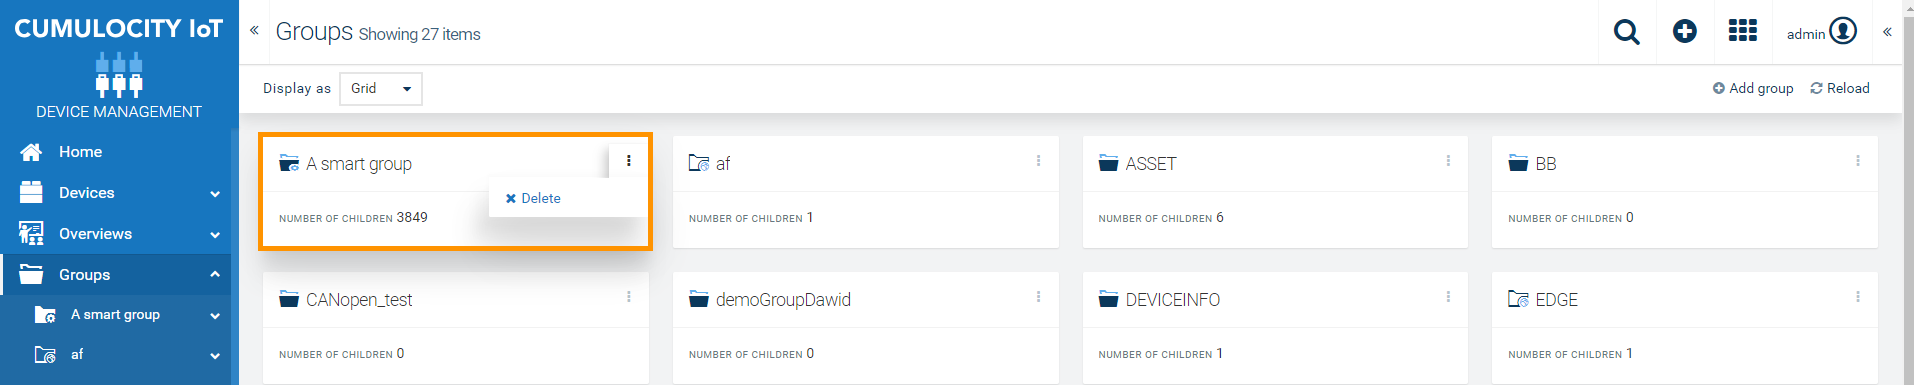
Important: Deleting a smart group is irreversible.
For each device, detailed information is available. The kind of information actually provided for a device depends on the device type, device usage and the configuration of your user interface.
To view detailed information on the device, click a device in the device list.
The device details are divided into tabs. The number of tabs is dynamic and depends on the available information, i.e. tabs are only displayed if the kind of information is available for the particular device.
Initially the Info tab is shown, which offers general information on a device and is available for each device.
Each device at least shows the following tabs: Info, Alarms, Control, Events, Service monitoring, Identity (also see the tab list below).
The following tabs are the most common ones, each described in detail in a separate section:
| Tab | Description |
|---|---|
| Info | Provides general information on a device. Available for each device. |
| Child Devices | Lists devices being connected to the current device. |
| Measurements | Provides a default visualization of numeric data provided by the device in the form of charts. |
| Alarms | Provides information on the alarms for a device. See also Working with alarms. Available for each device. |
| Configuration | Allows manual configuration of device parameters and settings entered in a text format. See also Configuration repository for binary configuration. |
| Control | Displays operations being sent to a device. Also refer to Working with operations. Available for each device. |
| Network | Displays network information for a device. |
| Software | Manages firmware of a device and software installed on a device. |
| Events | Displays events related to a device, helpful for low-level troubleshooting. Also refer to Troubleshooting devices. Available for each device. |
| Location | Shows the location of a device, if available. |
| Logs | Allows requesting log information for a device. |
| Service monitoring | Allows the service monitoring of machines. See also Monitoring services. Available for each device. |
| Shell | Enables you to interact with remote devices via a command prompt. |
| Tracking | Shows the movement of a device, if available. |
| Identity | Displays identities recorded for a particular device. Available for each device. |
Info: Several individual tabs, which you do not find listed here, may be described in a different context in another section of the Cumulocity documentation. Use the Search function to switch to the relevant sections. A detailed description on the Modbus tab, for example, can be found in Optional services > Cloud fieldbus.
Below the name, a list of breadcrumbs is displayed. If the device is part of an asset hierarchy (such as a group), you can use the breadcrumbs to easily navigate up that hierarchy. Since devices can be part of multiple hierarchies, several rows of breadcrumbs may be shown.
Depending of the type and usage of a device, further actions are provided in an action menu when clicking More… at the right of the top menu bar.
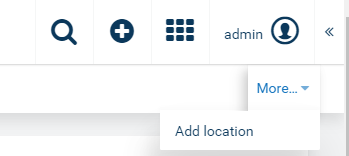
Details on these additional menu items are provided where required.
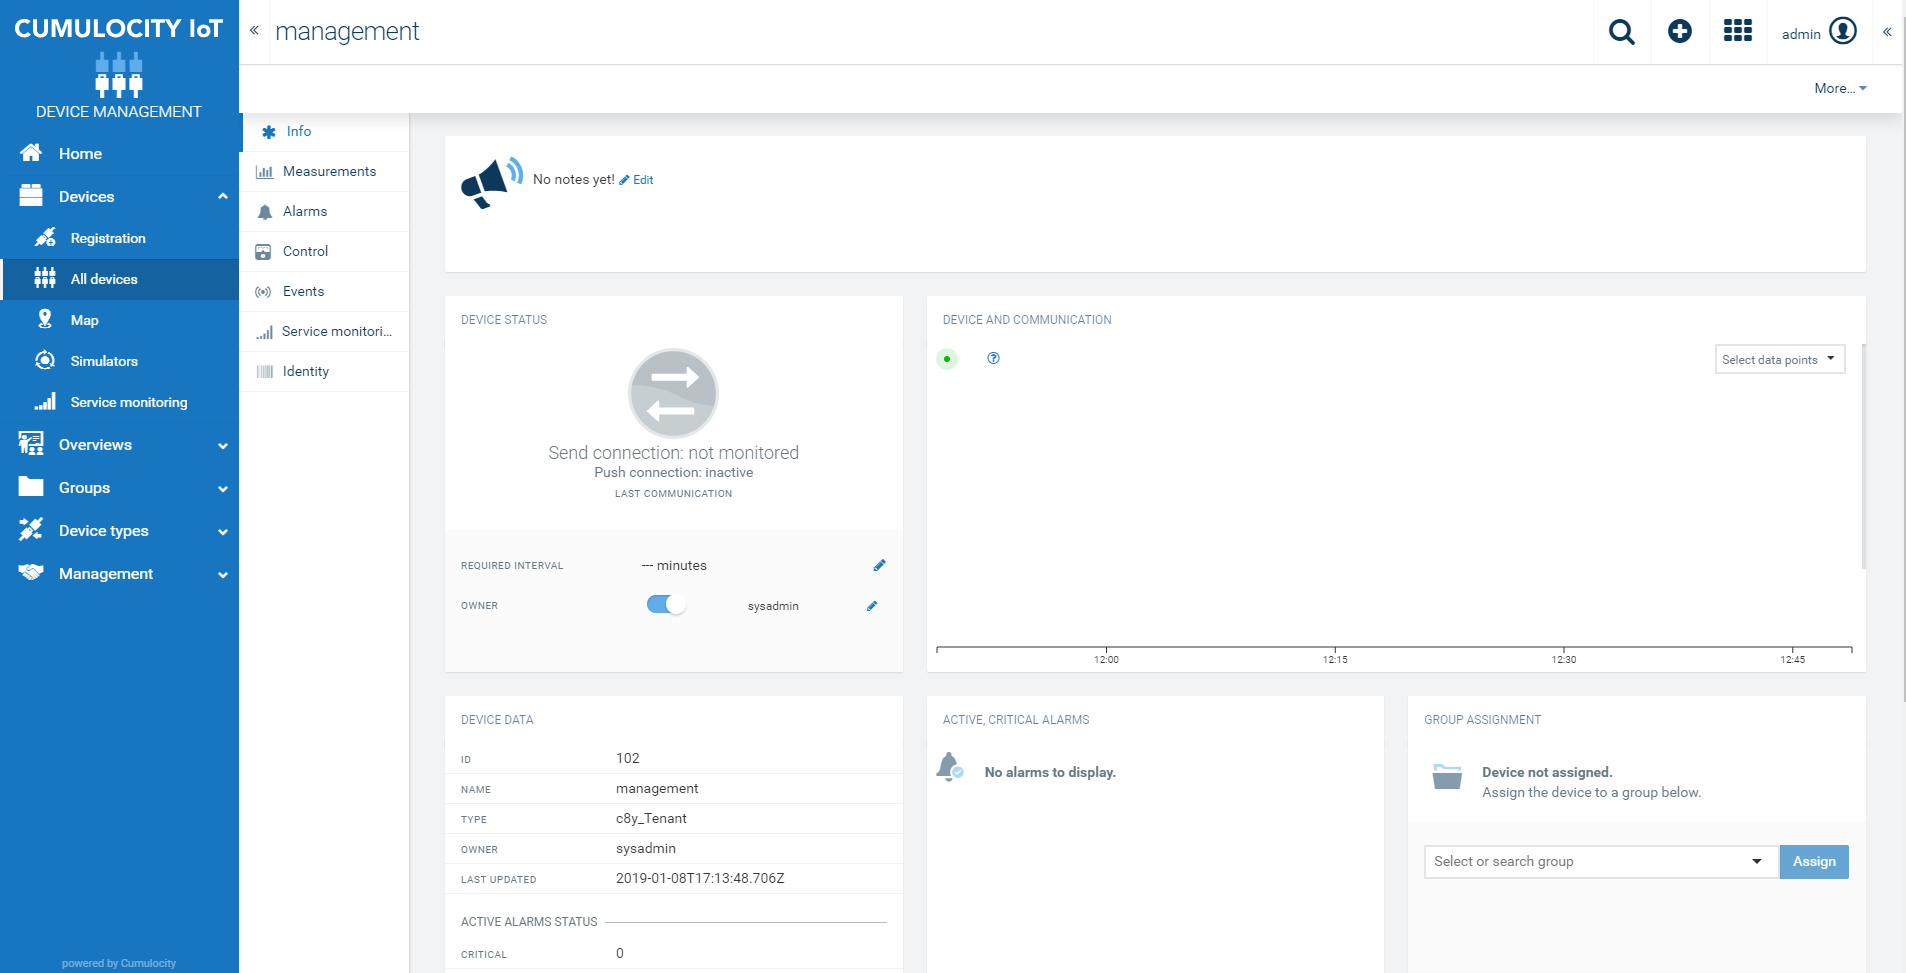
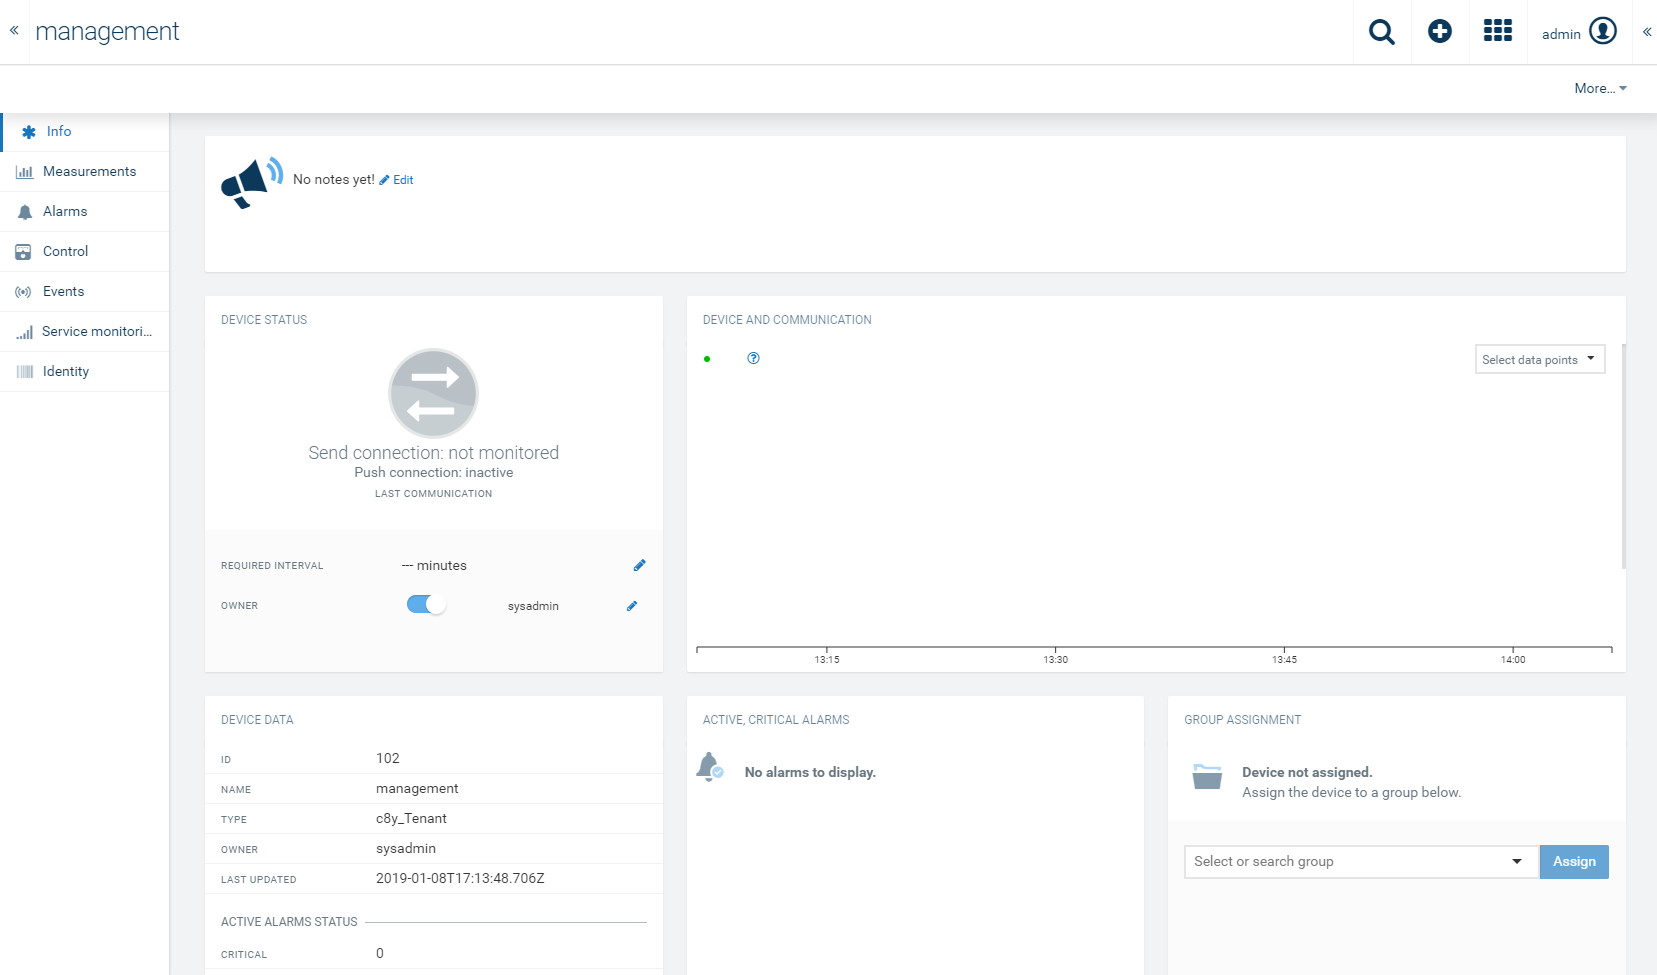
The Info tab summarizes management-relevant device information in a dashboard.
The information is provided on the following cards:
| Card | Description |
|---|---|
| Notes | Provides optional notes to inform about current activities. Notes usually may only be edited by an administrator. To add or edit a note, click Edit, enter your note or your modifications in the text box and save your edits by clicking the green checkmark at the right of the text box. |
| Device status | Displays connection-relevant information, as described in detail in Connection monitoring. |
| Device and communication | Shows a data point graph displaying real-time data on particular measurements. For details on data point graphs, refer to Using the data explorer in the Cockpit documentation. The following measurements may be shown here: Data points: c8y_Battery.level, c8y_SignalStrength.rssi, c8y_MemoryMeasurement.Used, c8y_CPUMeasurement.Workload, c8y_NetworkStatistics.Upload, c8y_SignalStrength.RCSP, c8y_SignalStrength.ber, c8y_SignalStrength.ECN0, c8y_NetworkStatistics.Download, c8y_MemoryMeasurement.Total Alarms: c8y_UnavailabilityAlarm Events: c8y_LocationUpdate |
| Device data | Displays general information on the device (ID, name, type, owner, last update). The fields Name and Type can be edited. Below the general device information, the card shows status information for active alarms, availability and connection (not editable). Moreover, various device-specific information like hardware and firmware is displayed here (editable). |
| Active, critical alarms | Shows the active critical alarms for the device. |
| Groups assignment | Displays the groups the device belongs to. Moreover you can add the device to groups here or unassign it from groups, see Grouping devices. |
| Location | Shows the location of a device on a map as reported by the device or as manually set, see Location. |
The Child devices tab shows a list of devices connected to the currently displayed device. For example, if you look at a gateway, the tab lists all machines connected to the gateway.
For details provided in the child device list, see Viewing devices.
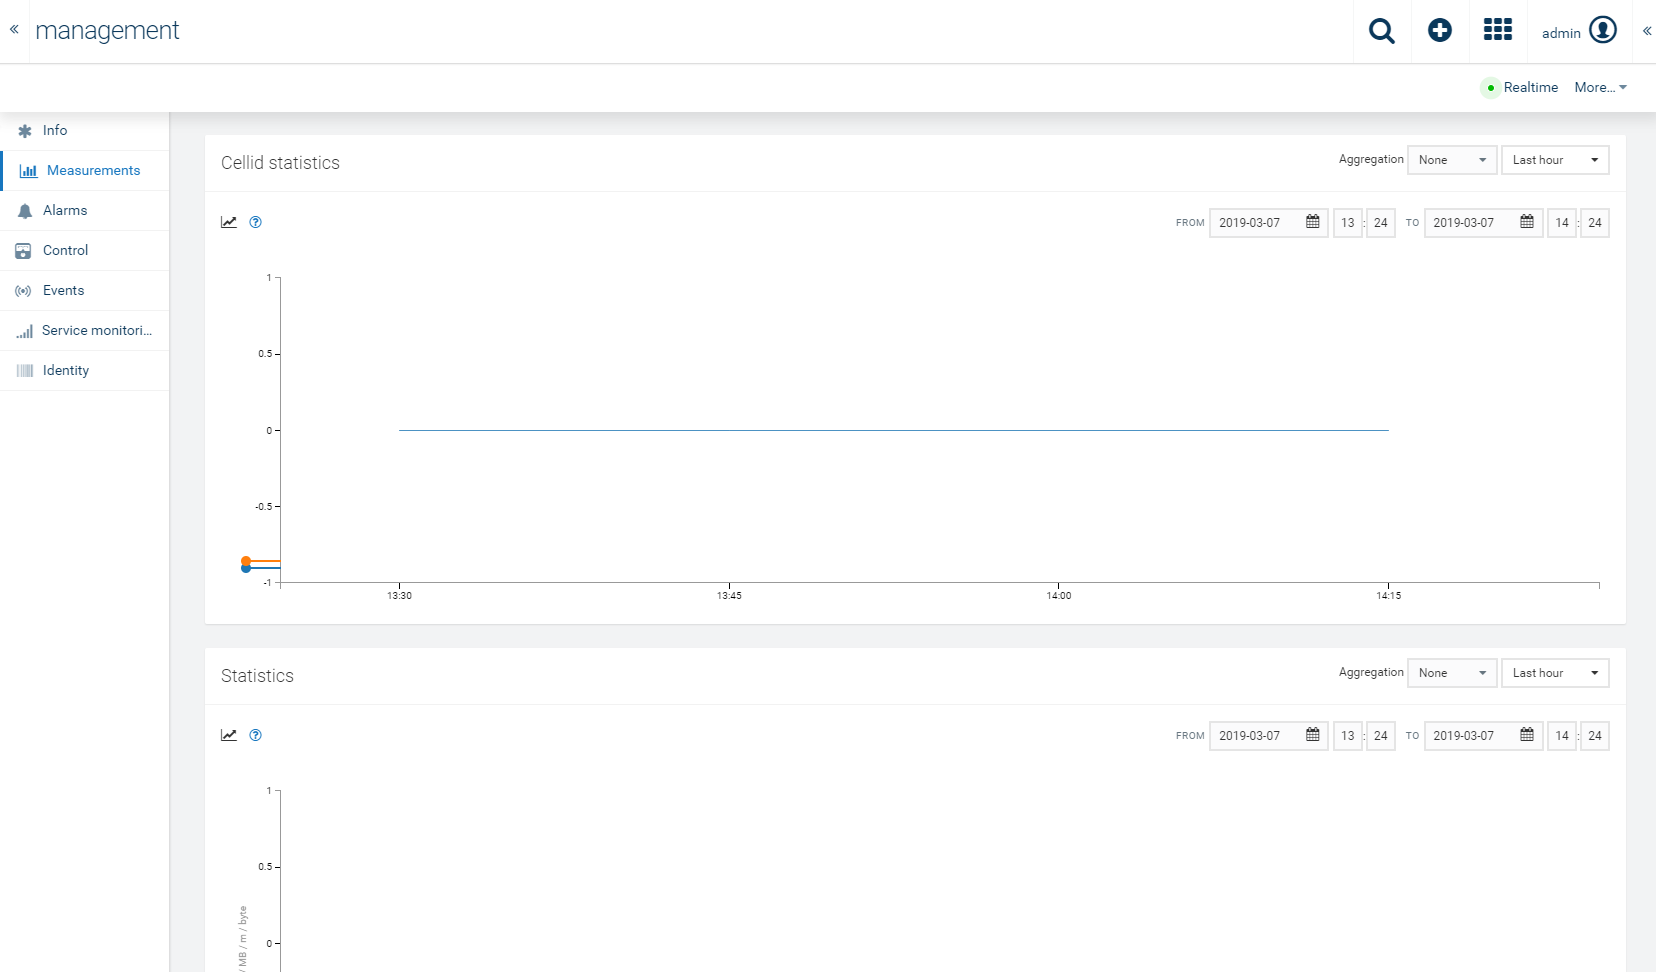
The Measurements tab provides a default visualization of numeric data provided by the device in the form of charts. Charts are grouped into types of measurements, which can contain multiple graphs or “series”.
The screenshot below, for example, shows a chart for motion measurement including graphs for acceleration in the three dimensions, and a chart with modem statistics in the form of signal strength and bit error rate.
If a chart contains graphs with different units, one Y-axis is rendered per unit. In the example above, motion measurements consist of three parameters with unit “meter per square second”, so only one axis is rendered. Modem statistics consist of signal strength in decibel milliwatts and bit error rate in percent, so one axis is rendered for each graph.
To see detailed information about the measured values, hover over the chart. A tooltip will be displayed with detailed information on the measurement next to your cursor (the tooltip will “snap” to the closest measurement).
Time range and aggregation
By default, charts show the raw data of the last hour. To change the time range on the X-axis, open the “Last hour” dropdown menu at the top right and select a time range.
If you increase the time range, the value in the Aggregation field will automatically switch to “hourly” or “daily”. The chart now shows ranges instead of individual raw data points. For “hourly”, the chart will show a range of the minimum and maximum value measured in one hour. For “daily”, the chart will show the minimum and maximum value measured over one day. Likewise, the tooltips will now show ranges of values instead of individual values.
This enables you to get an efficient overview over larger time periods. A graph will only show 5.000 data points per graph maximum to avoid overloading your desktop browser. If you select a fine focus resulting in more than 5.000 data points, a warning message will be shown: “Truncated data. Change aggregation or select shorter date range.”
Clicking Realtime will enable real-time user interface updates of the graphs as new data flows into the system from the connected devices.
You can influence the graphical display and axes limits by setting up so-called “KPIs”, see the Administration Guide.
Measurement format
In order to see measurement graphs, the device has to send measurements in a specified fragment format.
“fragment_name” : { “serie_name” : { “value” : … “unit” : … } }
Example:
“c8y_SpeedMeasurement”: { “Speed”: { “value”: 1234, “unit”: “km/h” } }
Fragment_name and serie_name can be replaced by different valid JSON property names, but no whitespaces and special characters like [ ],* are allowed. The structure has to be exactly as above, two-level deep JSON object.
The Alarms tab provides information on the alarms of a device. See Working with alarms for detailed information on alarms.
The Configuration tab allows you to configure the parameters and initial settings of your device in a text format.
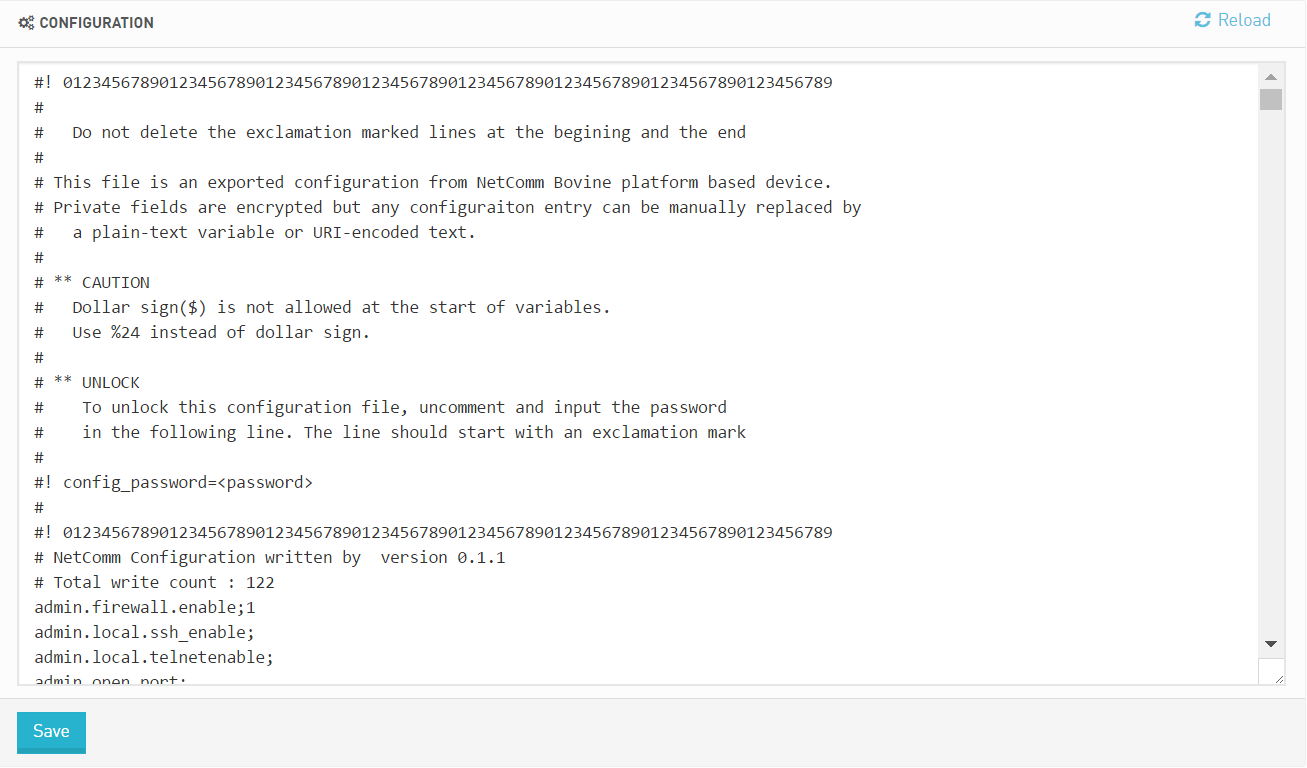
Alternatively, you can work with configuration snapshots, see Configuration snapshots.
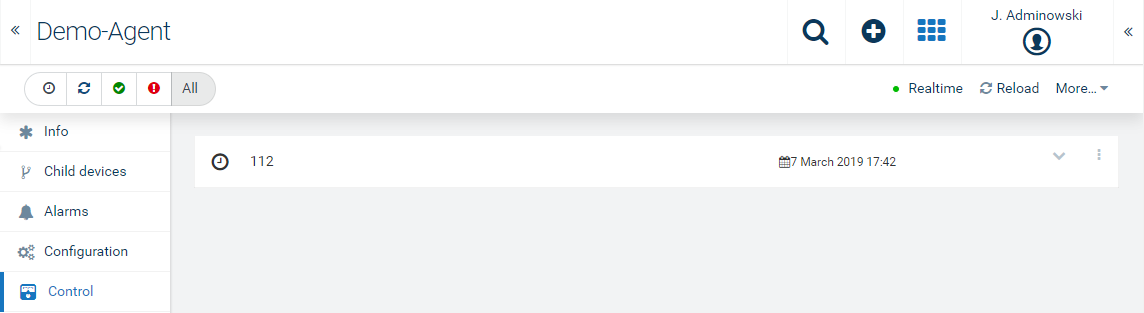
The Control tab lists the operations being sent to a device. See Working with operations for detailed information on operations.
In the Network tab, mobile network (WAN) and local area network (LAN) parameters can be viewed and configured.
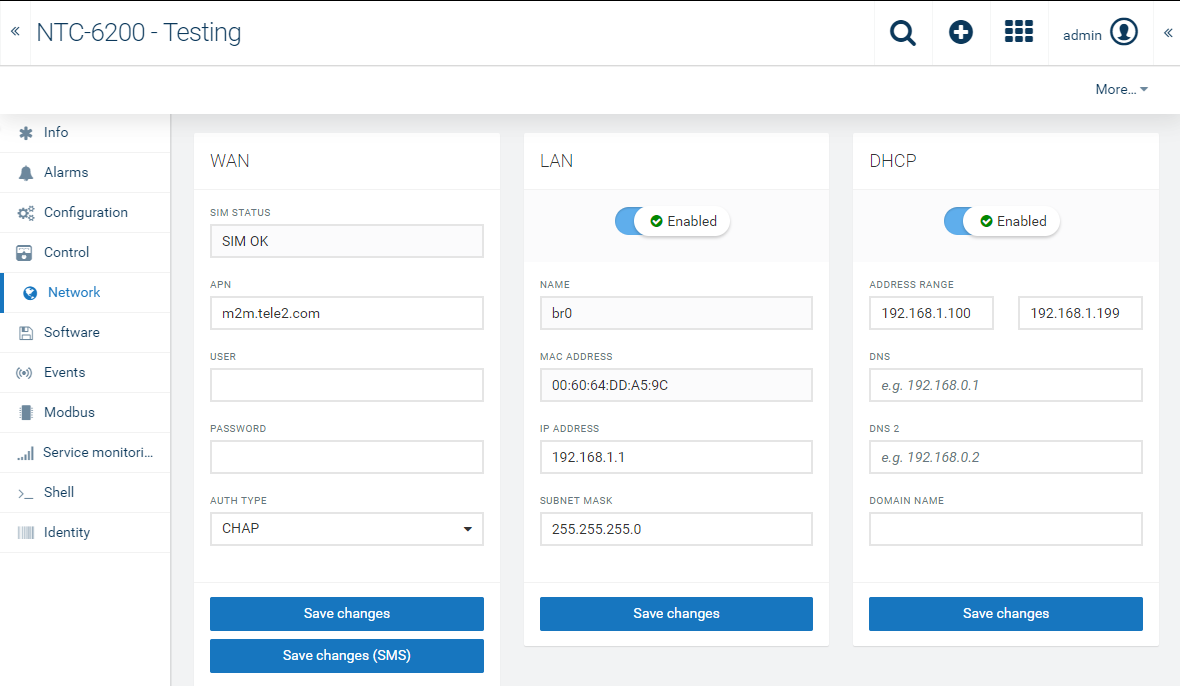
The WAN parameters in the user interface correspond to the first profile stored in the router. These parameter can be configured remotely or via SMS.
Info: For SMS configuration, the router needs to be configured to accept SMS commands.
To configure LAN parameters, simply enter IP address and Subnet mask.
Info: Name and Mac address fields are not configurable.
Info: If the LAN configuration is disabled, the DHCP configuration is automatically disabled as well.
The Software tab allows you to manage and update the firmware of a device and the software installed on a device.
Select a firmware from the dropdown list, which contains all firmware available in the Firmware repository, and click Install.
Similarly, to install a software on the device, select a software package from the dropdown list, which contains all software available in the Software repository, and click Install.
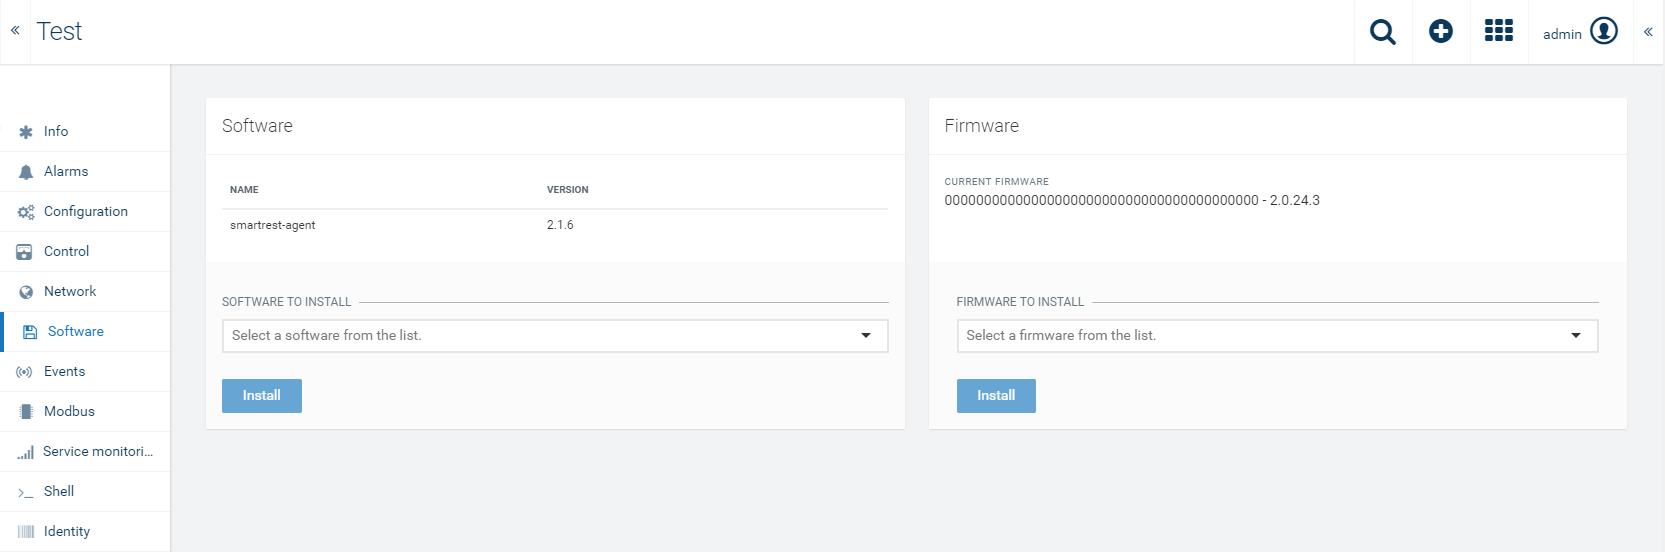
Installing software and firmware usually includes a restart of the device. To monitor the progress of an installation, visit the Control tab.
To remove a firmware/software object from a device, hover over a particular firmware/software entry and click the delete icon.
The Events tab displays events related to a device. This enables low-level troubleshooting of a device. See Troubleshooting devices for detailed information.
The Location tab by default shows the location of a device on a map and as coordinates, as reported by the device. For devices that do not report a location you may manually set the location. Simply place the “pin” in the correct place of the displayed map.
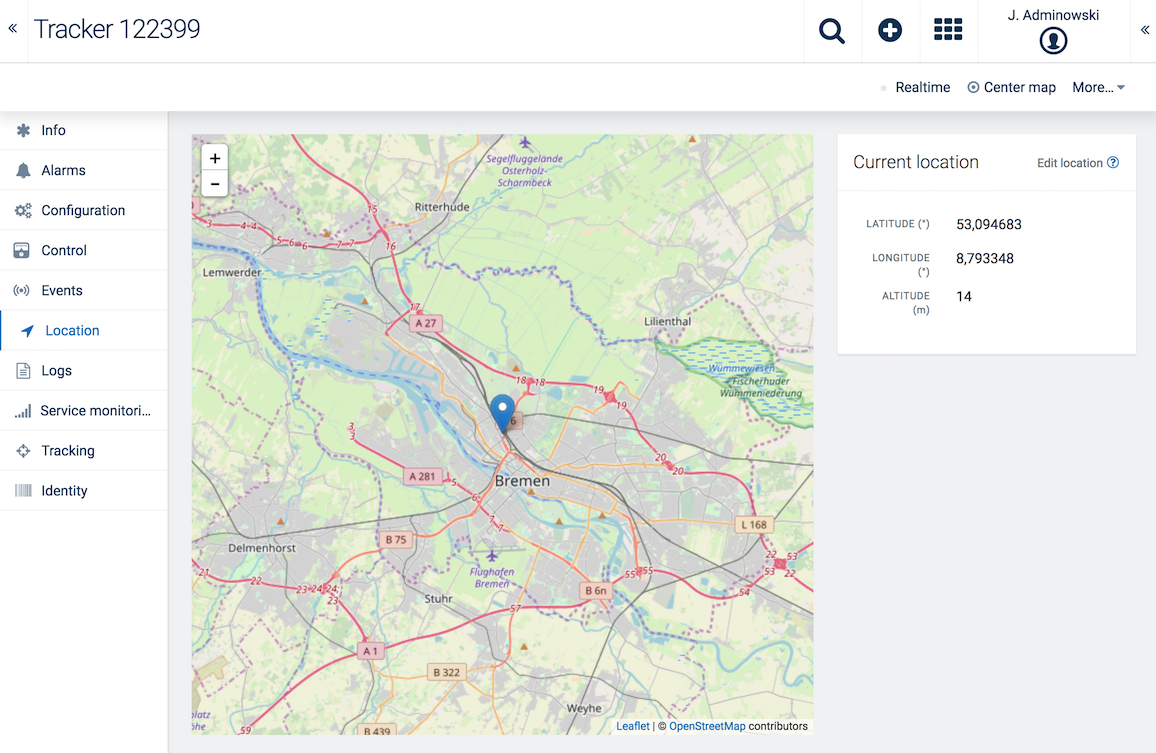
The Location tab also shows when a device contains c8y_Position property. When you send a new c8y-position event, you can set the same c8y-Position fragment on the device and it will automatically mark its position on the map.
In the Logs tab you can manage log information from devices.
The log information will be requested from the device.
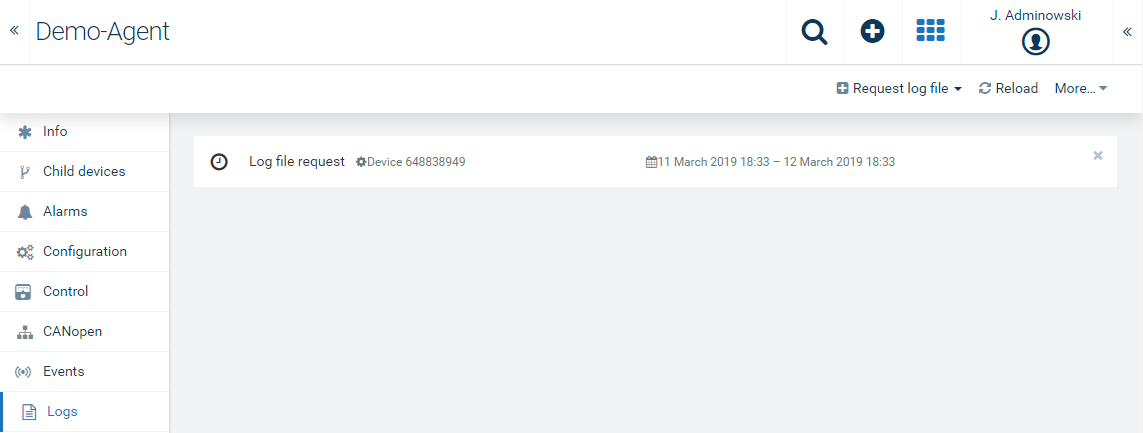
Requesting a log from a device may take some time.
After the log has been transferred from the device to Cumulocity, it will be listed in the Logs tab. The row in the list shows the requested log time range.
Click on the entry in the list to show the entire log information.
Hover over a row and click the download icon, to download the log excerpt to your file system.
Hover over a row and click the delete icon, to delete the log information.
In addition to connection monitoring, Cumulocity offers a separate service monitoring for machines, see Service monitoring for more information.
The device shell enables you to interactively work with remote devices. Many industrial devices support some form of command language, like AT commands for modems, CSV-style commands for many tracking devices or elaborate scripting mechanisms such as Tixi TiXML. In the shell, you can send commands in the respective language of the device and interactively view the results of the commands.
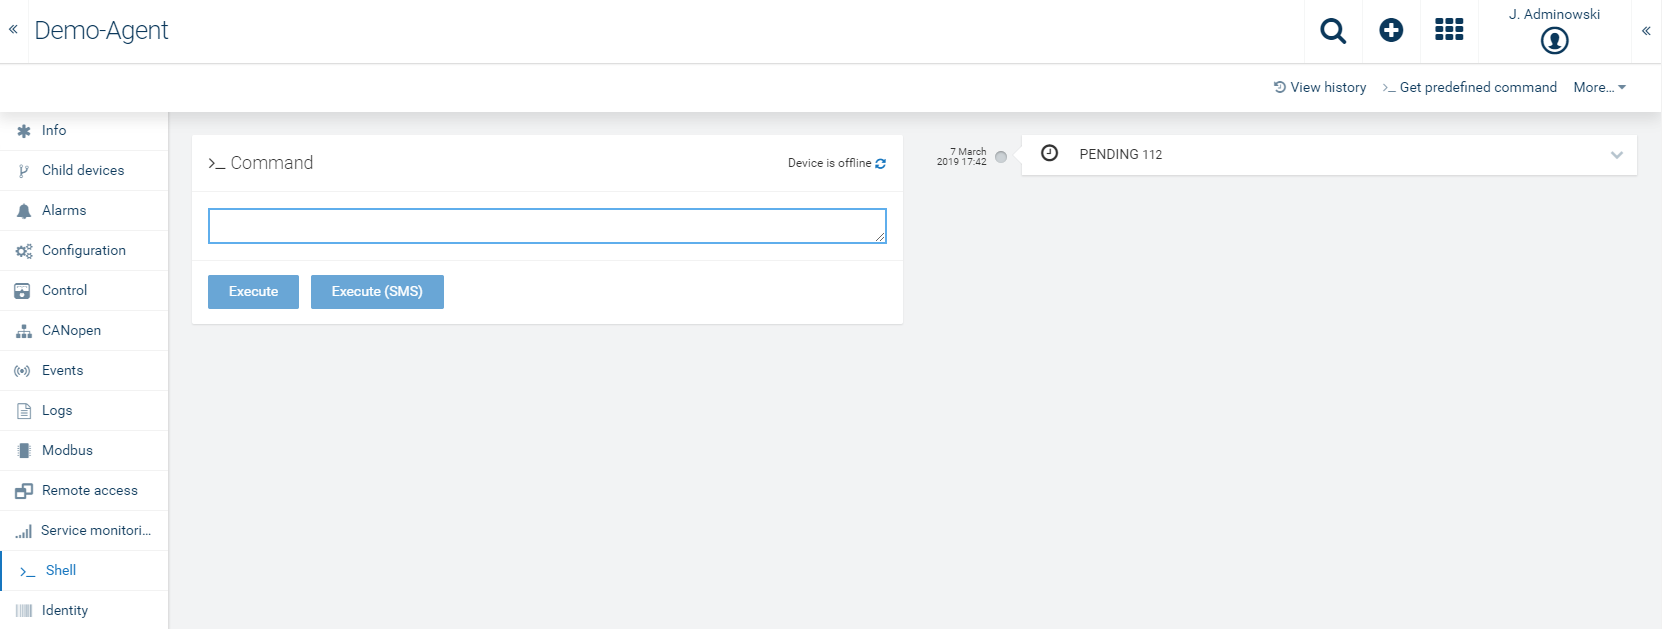
The Shell tab presents a command prompt to enter commands.
In the command prompt you can enter arbitrary command text. To send the command text to the device, click Execute. This button only is activated if the device is online.
Important:When using Cumulocity IoT to remotely operate machinery, make sure that all remote operations follow the safety standards and do not cause any harm.
Click View history at the right of the top menu bar to switch to the Control tab which displays a list of the previously executed commands. For details, refer to Monitoring and controlling devices > Working with operations.
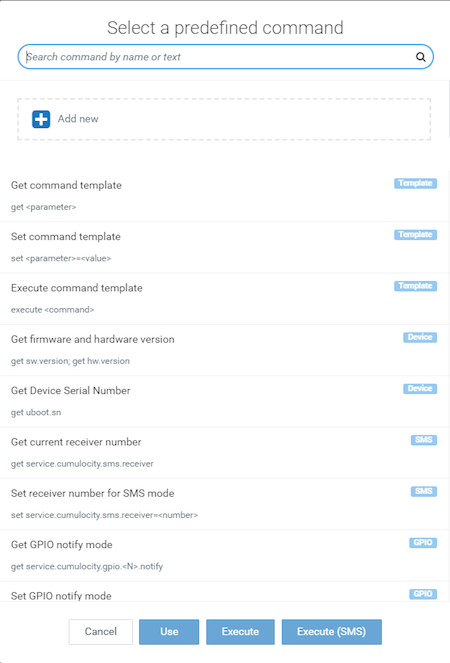
For your convenience, Cumulocity provides several frequently used commands for some devices. Click <_Get predefined commands at the right of the top menu bar to open a window containing a list of available pre-defined commands. Select the command of your choice and click Use, to copy the command to the command prompt, or Execute, to execute the command straight away. You may also add new commands here for re-use.
Devices can record the history of their movements in Cumulocity. This movements may be viewed in the Tracking tab.
Note that the Tracking tab only shows up when a device contains c8y_Position property.
In the dropdown list at the top right you can select a time period (or specify one by selecting “Custom- from the list) and visualize the movements of the device during this period. Movements are shown as red lines in the map.
![]()
Next to the map, the individual recordings with their time are listed (“location update events”). When you click a recording, a “pin” on the map will show the location at the time of the recording.
Depending on the type of device and the integration into Cumulocity, you can configure device-side geo-fencing and motion detection.
Info: When this feature is activated and the device is compatible, Cell ID information can be used to determine the position of the device. Currently, the services from Combain and Google are supported. The user can see the tracks based on both data, or filter out GPS based data or Cell ID-based data.
Cumulocity can associate devices and assets with multiple external identities. For example, devices can often be identified by the IMEI of their modem, by a micro-controller serial number or by an asset tag. The Identity tab lists all the identities recorded for a particular device.
This is useful, for example, when you have non-functional hardware and need to replace the hardware without losing the data that was recorded. Just connect the new hardware to your account and modify the identity entry of the old hardware, to contain the identity of the new hardware.
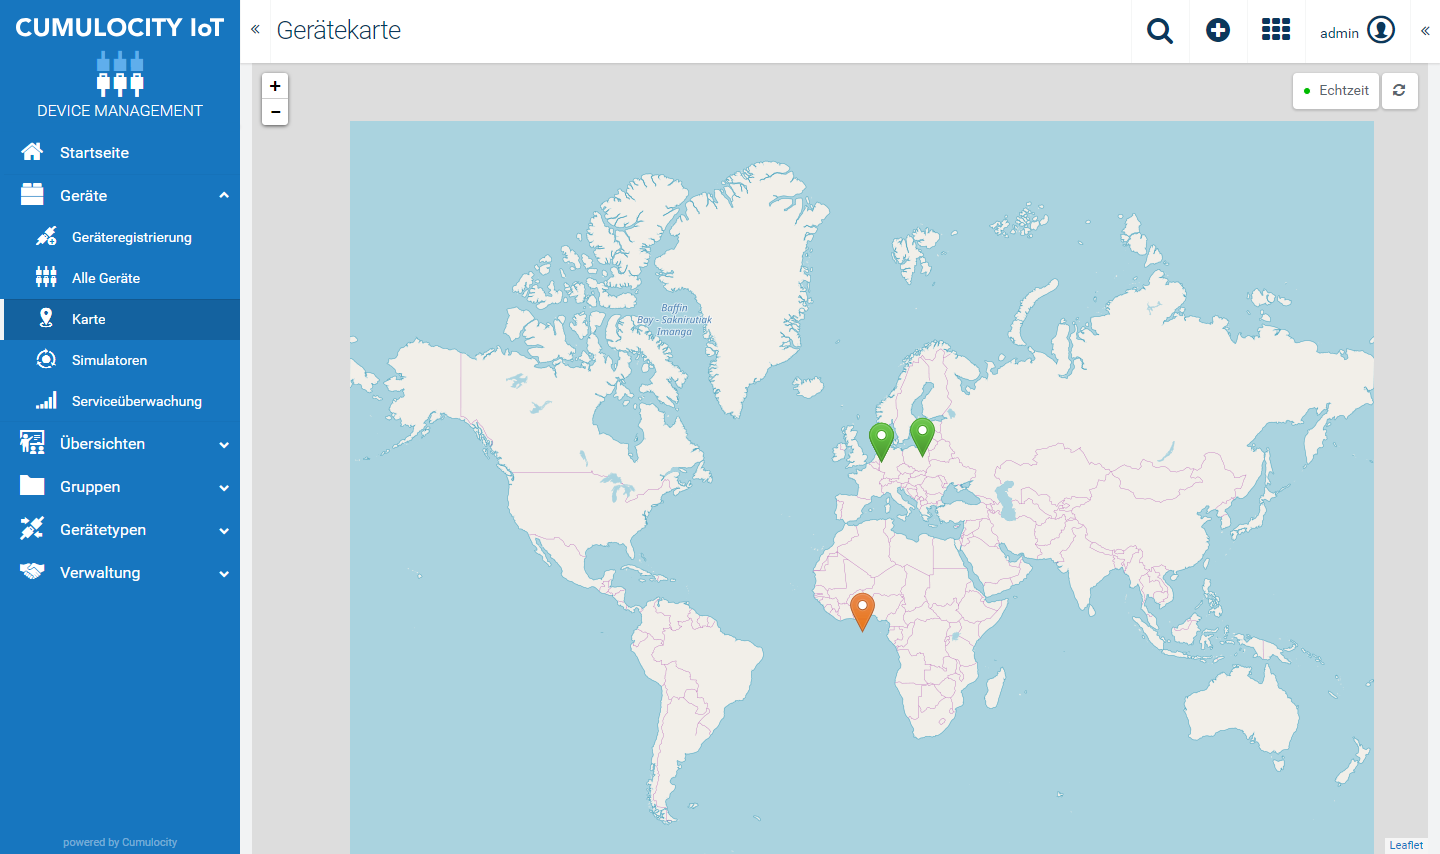
Cumulocity provides the option to view all devices in your account on a map.
Click Map in the Devices menu in the navigator to display a map showing all devices in real time.
Devices are represented as “pins”. Click a pin to see the name of the respective device. Click the device name to switch to its device details.
In the Device Management application you can monitor the connections to your devices.
This can be done at the level of individual devices (see below) or across multiple devices in a list.
Open a device list to monitor the connections for multiple devices.
The connection status is represented by arrows in the Status column in the device list.
Send connections
The top arrow represents the send connection (traffic from the device to Cumulocity). The status for the send connections may be one of:
Hovering over the arrow displays the timestamp of the last request from the device to the server.
When a device is detected to be offline (stops sending data within required interval and top arrow changes to red color), an unavailability alarm is created for the device: “No data received from device within required interval”.
Push connections
The bottom arrow represents the push connection (from Cumulocity to the device). The status for the push connections may be one of:
Push connection means the connection from Cumulocity to /devicecontrol/notifications API, not to real-time API.
Info: Connection monitoring is not real time. This means that the displayed connection status will not change immediately after switching off a device. Depending on the used protocol for push connection monitoring this can take a couple of minutes.
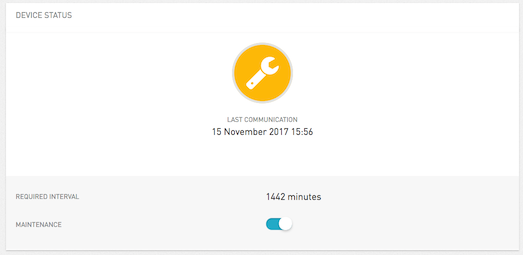
Moreover, the device may be in “Maintenance” mode, indicated by the tool icon in the Status column. This is a special connection status indicating that the device is currently being maintained and cannot be monitored. While a device is being maintained, no alarms for that device are raised.
You can turn the maintenance mode on or off for a device through a toggle in the Connection monitoring card in its Info tab, see below.
Navigate to the Info tab of a particular device to monitor the connections of this device. Under Device status, the connection status for the device is displayed.
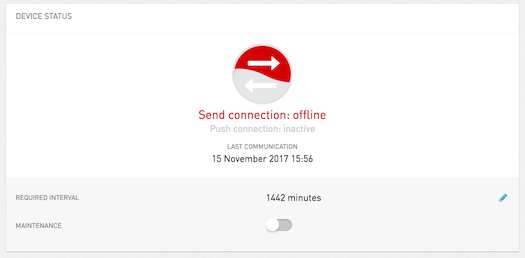
Below the send connection and push connection status, the time of the last communication is displayed.
Info: “Last communication” and “Last updated” are two entirely different time stamps. “Last communication” indicates when a device has last sent data. “Last updated” indicates when the inventory entry of the device was last updated. This update may have originated from the device, from the web user interface or from another application.
In the Required interval field you can specify an interval. This parameter defines how often you expect to hear from the device. If, for example, you set the required interval to 60, you expect the device at least to communicate once in an hour with Cumulocity. The interval is either set by the device itself, based on the device’s knowledge how often it will try to send data, or it is set manually by you.
If an interval is set, you will find the Maintenance toggle below it.
With the Maintenance toggle you can turn the maintenance mode for the device on or off which is immediately reflected in the connection status.
Cumulocity distinguishes between connection monitoring and service monitoring. Connection monitoring, as described in the previous section, only indicates if the device is communicating with Cumulocity, it does not automatically indicate if it is functional or not.
Service monitoring indicates if a device is in service. For example, a vending machine is in service if it is ready to sell goods. A vending machine can sell goods using cash money without a connection to Cumulocity. From the perspective of a merchant, it is in service. Similar, if you switch off the power on a gateway, the devices behind the gateway can still continue to work.
Cumulocity considers a device to be in service while there is no critical, unresolved alarm present for the machine. This is displayed as a share of time such an alarm was present. If a machine didn’t have any critical alarms whatsoever during a time period, it was 100% in service. If half of the time there was some critical, unresolved alarm, the machine was 50% in service.
While a machine is offline, Cumulocity assumes by default
There may be exceptions from this rule. If your vending machines rely exclusively on cashless payment, losing the connection to the network means that your machine is out of service and stops selling. In this case, unavailability alarms must be set in the Administration application which have CRITICAL severity instead of MAJOR severity.
Cumulocity displays service availability at the level of individual devices and across all devices.
Click the Service monitoring tab in the details of a particular device to check the service monitoring of this device.
Click Service monitoring in the Device menu in the navigator to display the overall service across all devices.
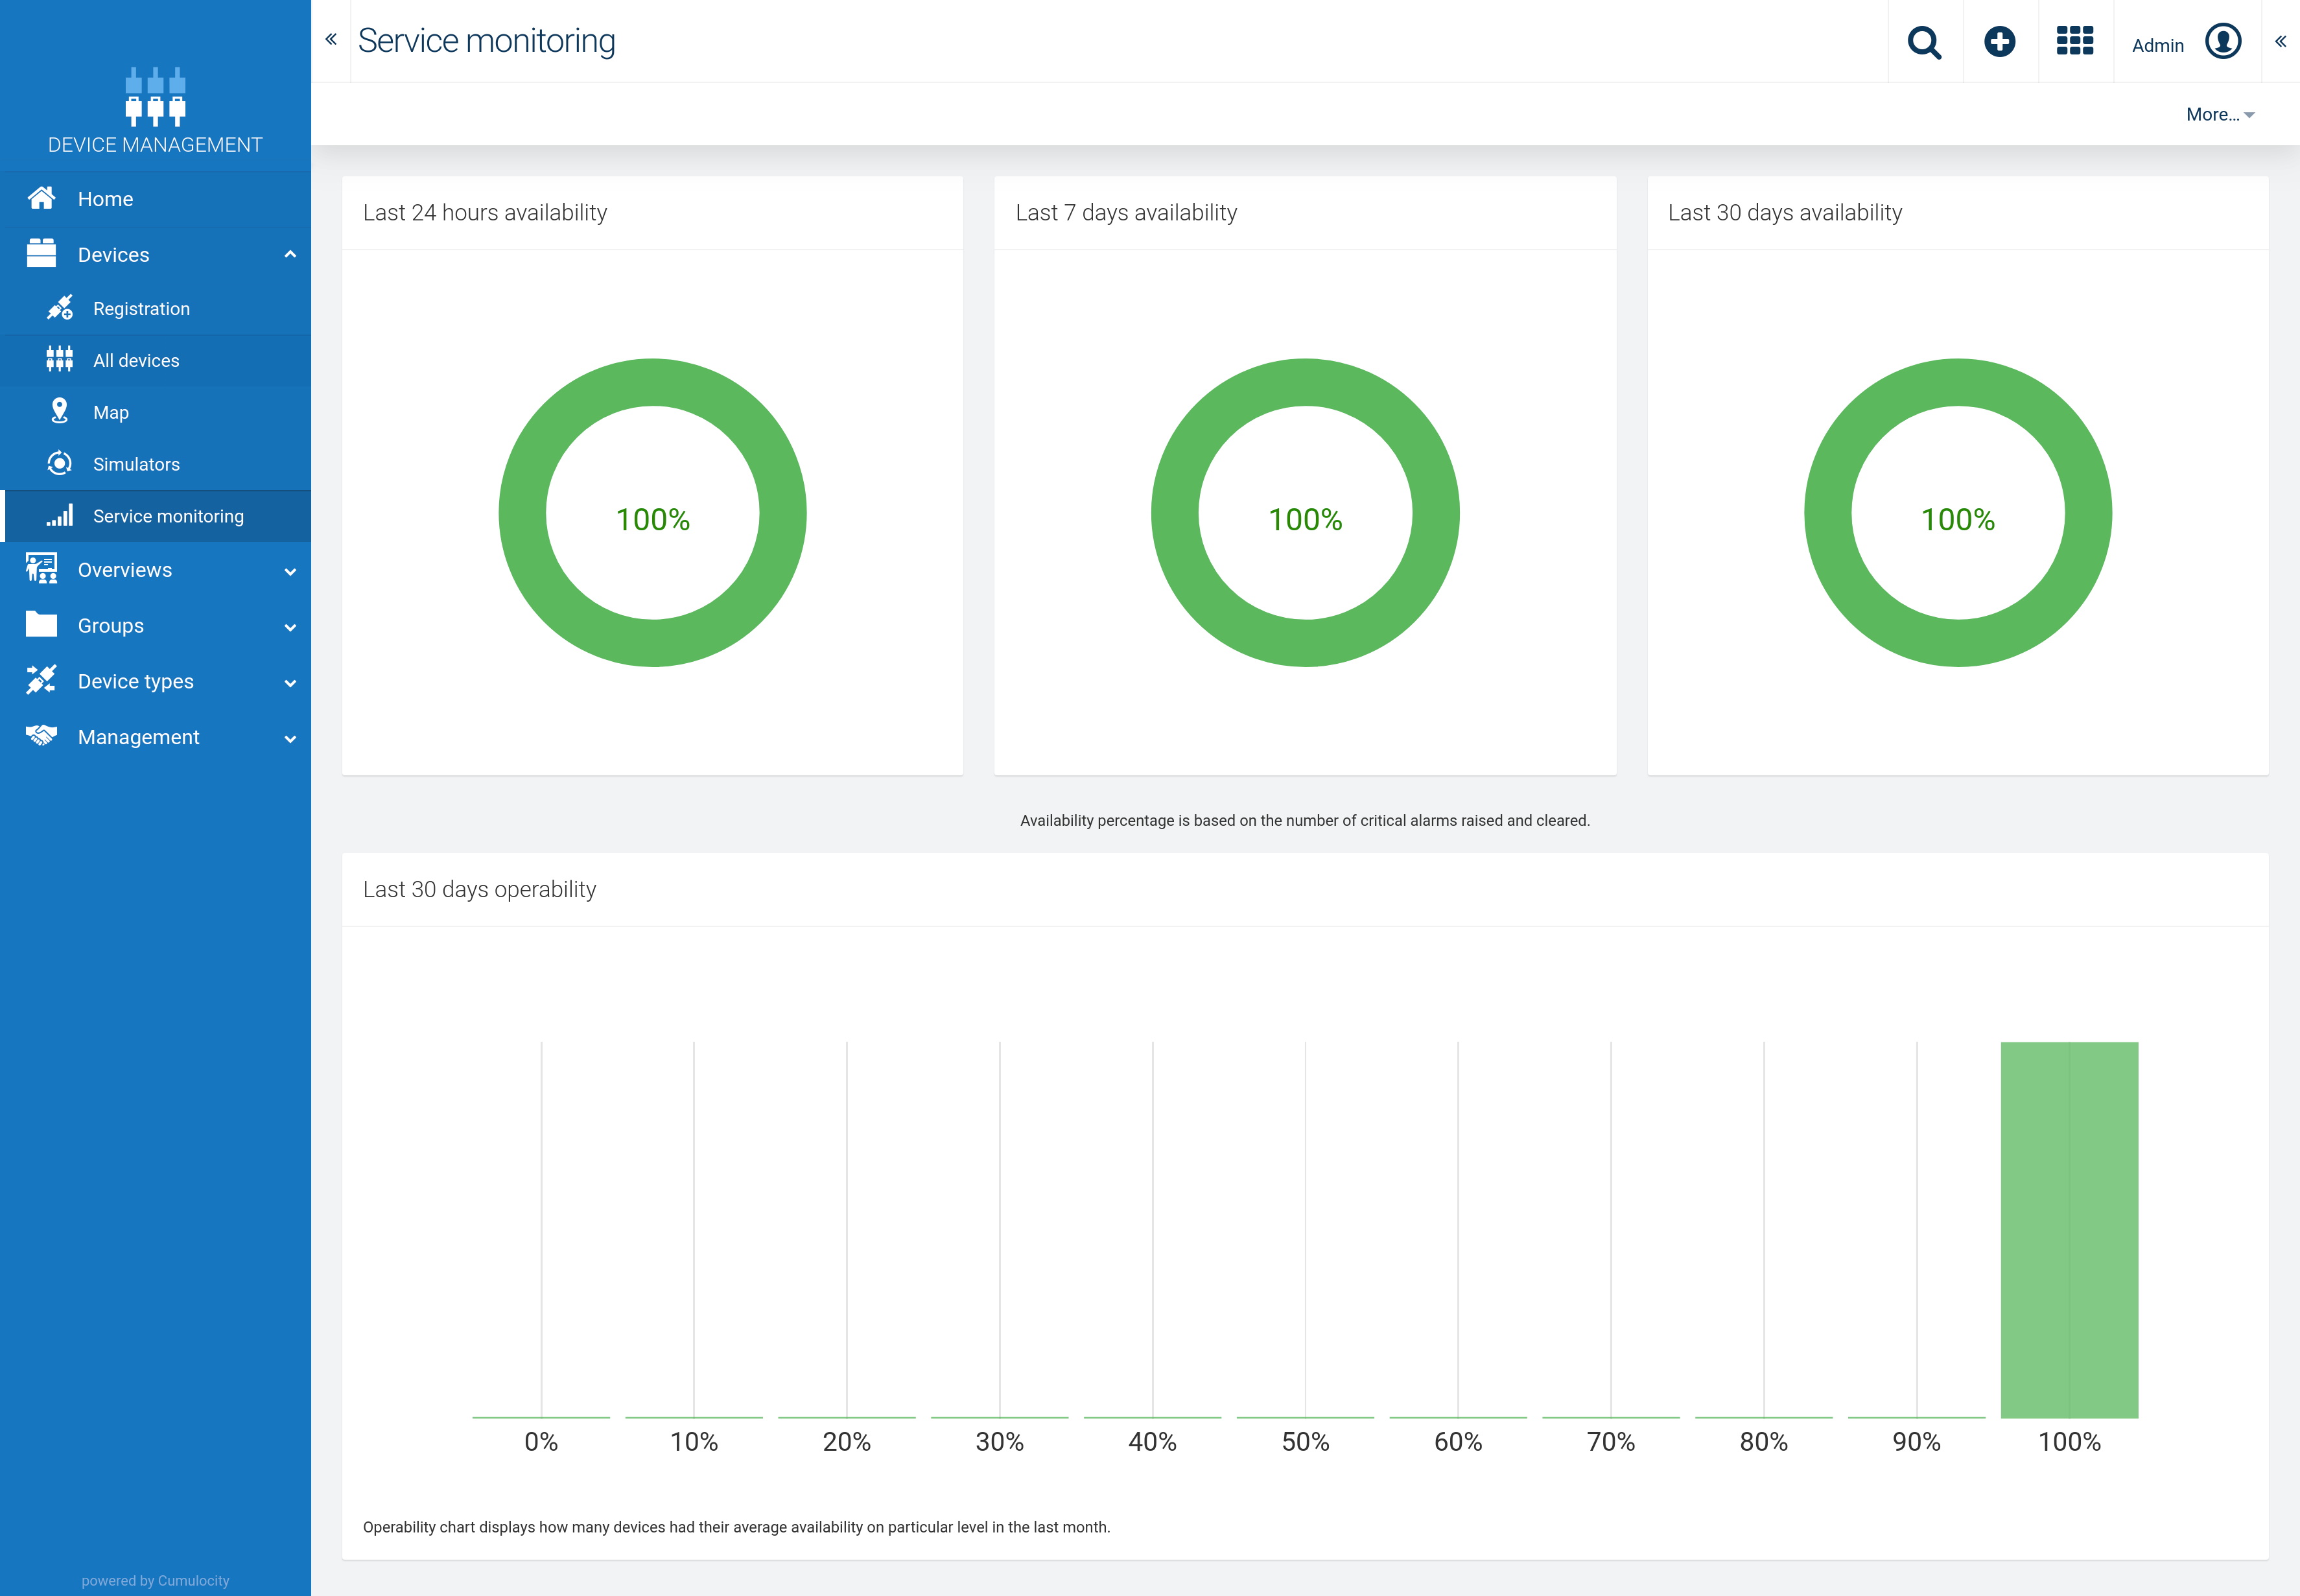
The Service monitoring page shows the availability percentage of devices for the last 24 hours, last 7 days and last 30 days.
Devices can raise alarms to indicate that there is a problem requiring an intervention.
Cumulocity displays alarms at the level of individual devices and across all devices:
By default,
Alarms are classified according to their severity. Cumulocity includes four different alarm types:
| Severity | Description |
|---|---|
| CRITICAL | The device is out of service and should be fixed immediately. |
| MAJOR | The device has a problem that should be fixed. |
| MINOR | The device has a problem that may be fixed. |
| WARNING | There is a warning. |
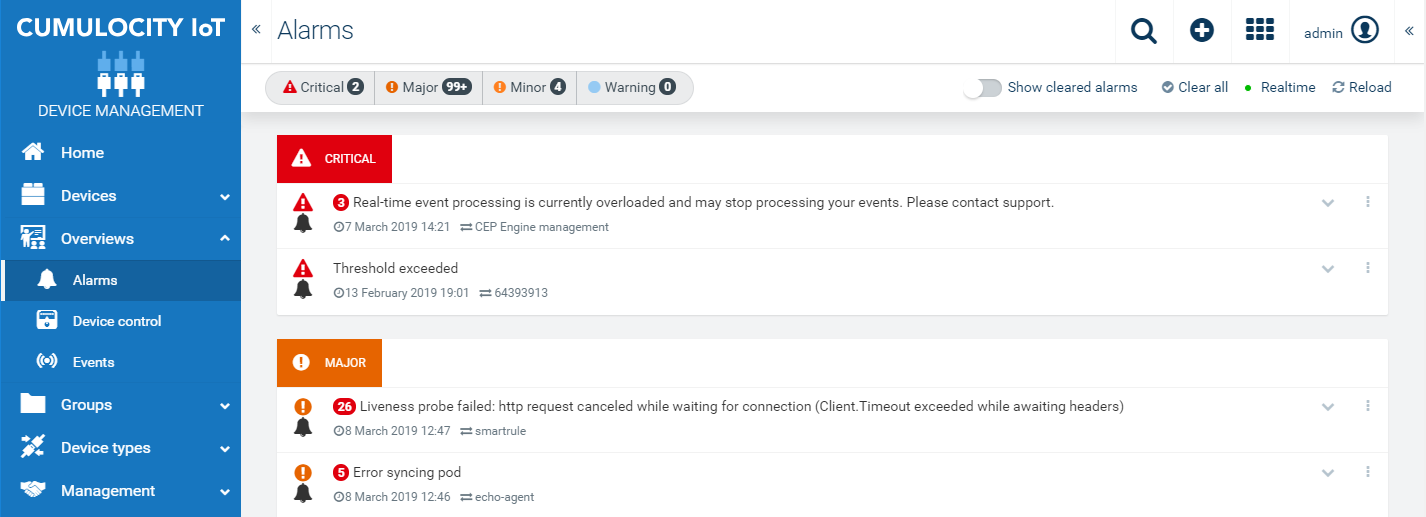
The Alarm tab is split into four sections corresponding to these alarm types.
By clicking one of the buttons at the top, the corresponding section will be hidden. Click it again to show the section again.
Within each section, the alarms are sorted by their occurrence, displaying the most recent alarm first.
In each row, the following information for an alarm is provided:
| Info | Description |
|---|---|
| Severity | One of CRITICAL, MAJOR, MINOR, WARNING (see above). |
| Count | The number of times this alarm was sent by the device. Only one alarm of a particular type can be active for a certain device. If another alarm of the same type is sent by the device, the number is increased by 1. |
| Description | An arbitrary text describing the alarm. |
| Status | The status of the alarm. An alarm can be: Active: When it was raised and nobody is so far working on the alarm. Acknowledged: When someone changed the status to “Acknowledged” to indicate that someone is working on the alarm. Cleared: When either someone manually set the status to “clear” or when the device detected by itself that the problem has gone. |
| Last occurrence | Timestamp of the last occurrence of the alarm (device time). |
| Device | The name of the device. Clicking the name leads you to the detailed view of the device. |
Click the arrow on the right of a row to expand it and display further details on the alarm.
To change the status of an alarm, hover over it and click the button for the desired status or click the menu icon and select the desired status.

It is also possible to change the status of all alarms to “clear” at once. Click Clear all in the top menu bar, to clear all alarms of the selected severities.
Operations are used to remotely control devices.
You can view operations at the level of individual devices and across all devices:
Operations can be in one of the following four states:
| State | Description |
|---|---|
| PENDING | The operation has just been created and is waiting for the device to pick it up. |
| EXECUTING | The operation has been picked up by the device and is being executed. |
| SUCCESSFUL | The operation has been successfully executed by the device. |
| FAILED | The operation could not be executed by the device.For each operation, the following information is provided: |
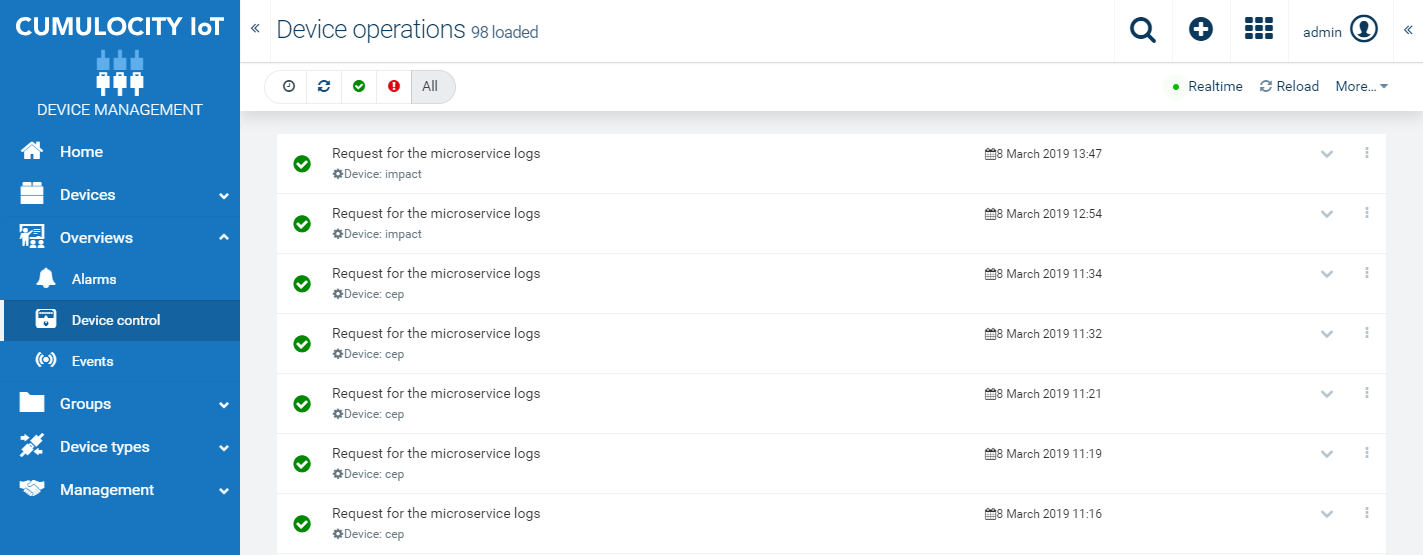
In each row, the following information for an operation is provided:
| Info | Description |
|---|---|
| Status | One of PENDING, EXECUTING, SUCCESSFUL, FAILED (see above). |
| Name | Name of the operation. |
| Device | The name of the device. Clicking the name leads you to the detailed view of the device. |
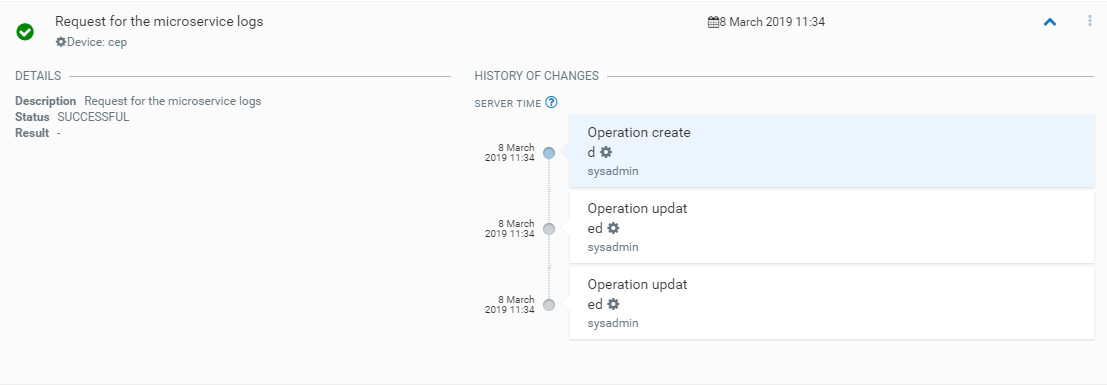
Clicking a row expands it and displays further details on the operation.
By clicking one of the state buttons at the top, the corresponding operations will be hidden. Click it again to show the operations again.
Click Realtime at the right of the top menu bar to see operations coming in from the devices in realtime.
Info: Operations are listed in descending time order. Operations are executed strictly according to this order.
Operations for a specific device are created and executed in the Shell tab of the device, see Device details > Shell.
Important:When using Cumulocity IoT to remotely operate machinery, make sure that all remote operations follow the safety standards and do not cause any harm.
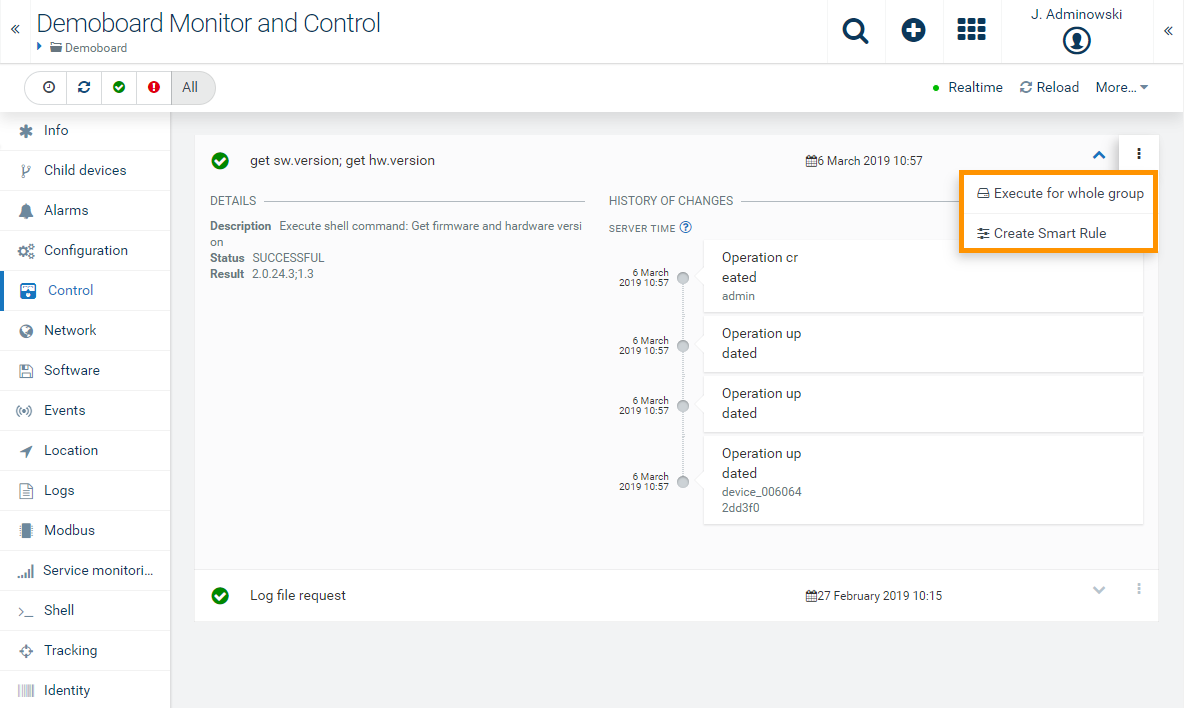
For easier handling of devices, Cumulocity offers bulk operations. With bulk operations you can at once execute operations for each device within one group.
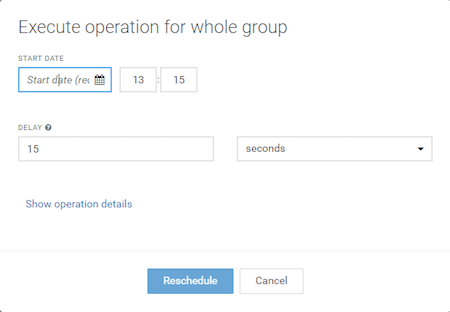
To execute bulk operations for a group, follow these steps:
The operation will be executed for all devices in the group.
In order to view the status and progress of your operations, simply select the desired group and click the Bulk operations tab.
The changes will be applied to the bulk operation accordingly.
Hover over the bulk operation you want to delete, click the menu icon, and then click Cancel operation.
Troubleshooting devices at a more detailed level can be done with the help of events. Events are low-level messages sent by devices that are usually used for application-specific processing. For example, a vending device sends its real-time sales in the form of events.
Cumulocity displays events at the level of individual devices and across all devices:
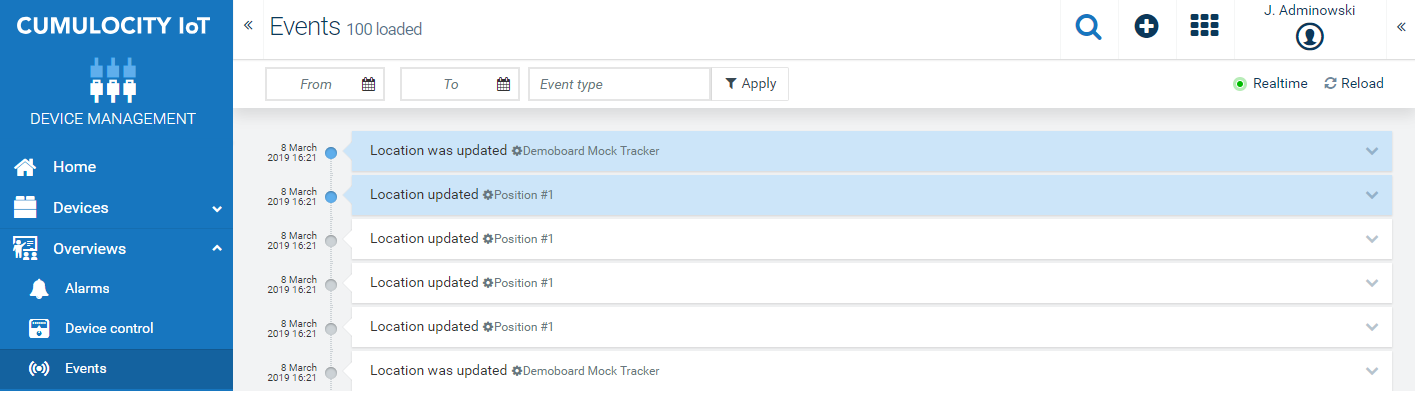
Per default, events are shown as coming in from the devices in real time. To disable real-time updates, click Realtime at the right of the top menu bar.
For each event, the following information is provided:
| Info | Description |
|---|---|
| Timestamp | Timestamp when the event has been executed. |
| Name | Name of the event. |
| Device | The name of the device sending the event. Clicking the name leads you to the detailed view of the device. |
In the event list, the latest entry is displayed on top.
Clicking a row expands it and displays further details on the event (as type and position of the device).
Since devices may send large amounts of event data, you can filter the data to be displayed by date.
Select a start date and an end date from the fields in the top menu bar and click the Filter button to apply the filter. Click the Clear button to clear the filter again.
To process data from various device types, Cumulocity uses so-called “device protocols” which are stored in a device database.
Click Device database in the Device types menu in the navigator.
In the Device database page you will find a list with all device protocols available in your account.
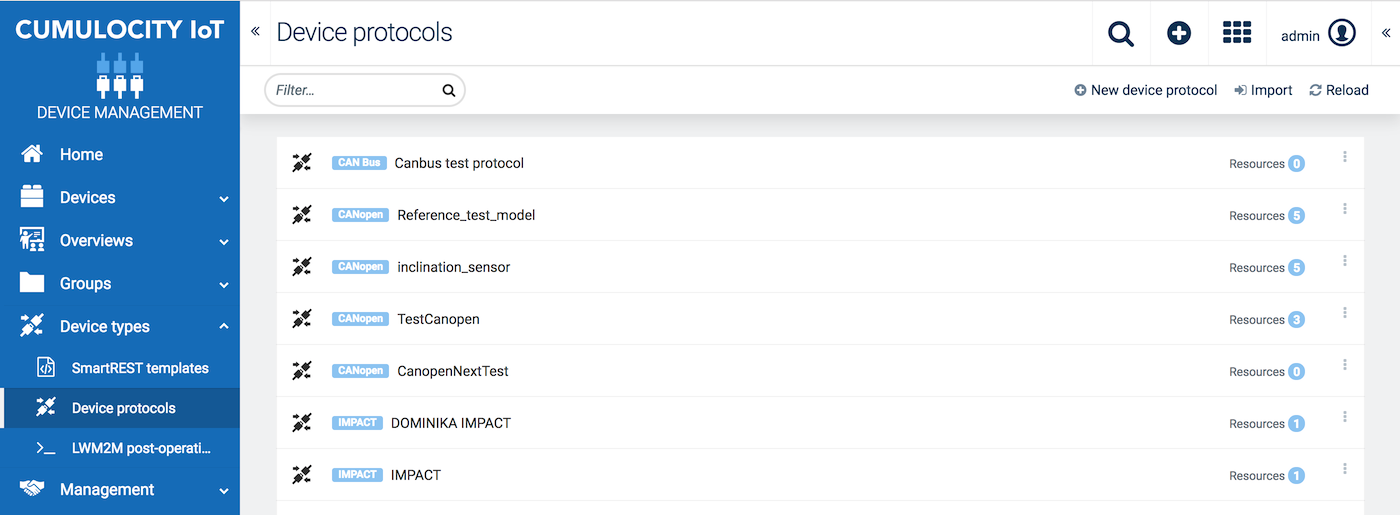
The device protocol list shows the following information:
Click New device protocol in the top menu bar.
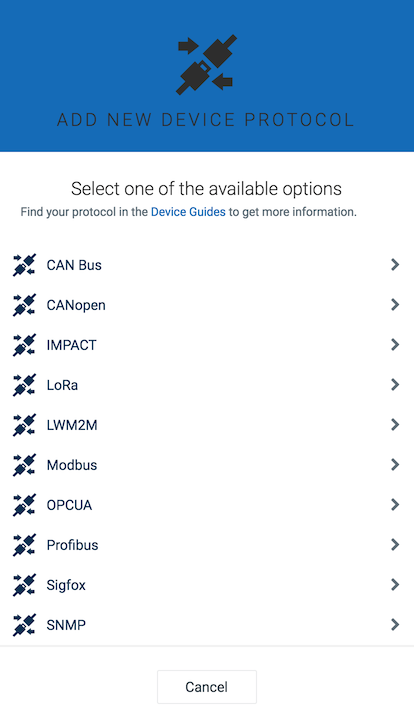
Select one of the available device protocol types from the list.
In the resulting dialog box, enter a name and an optional description for the device protocol and click Create.
Enter the configuration for the device protocol. The configuration of the device protocol depends on the protocol type.
For details on configuring device protocols, follow the documentation of the particular device type you want to create, see Optional services.
Click Save.
The device protocol will be added to the device database.
To add a device protocol from an existing protocol, perform the following steps:
Click Import in the top menu bar.
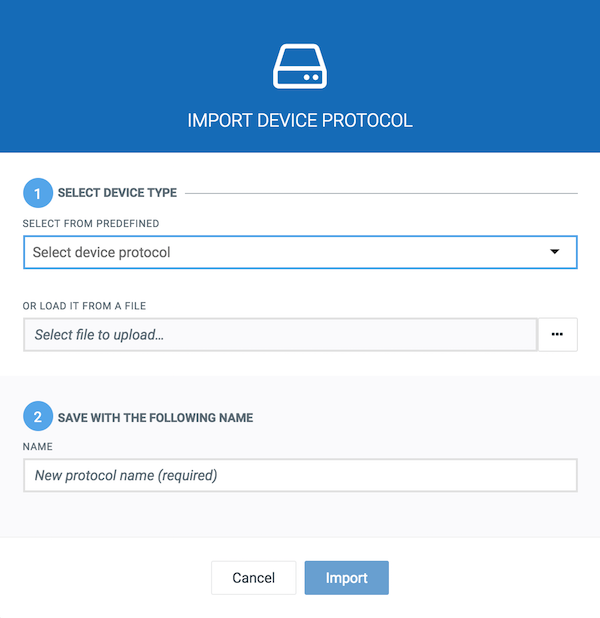
Either select the device protocol to be imported from a list of predefined protocols or load it from a file by browsing.
Provide a name for the new protocol and click Save.
The device protocol will be added to the device database.
To edit a device protocol, just click on the protocol or click the menu icon at the right of the row and then click Edit.
Details on the fields can be found in the documentation of the particular device type, see Optional services.
To remove a device protocol, click the menu icon at the right of the row and then click Remove.
The device protocol will be removed from the device database.
To export a device protocol, click the menu icon at the right of the row and then click Export.
The device protocol will be exported to your file system.
In the firmware and in the software repository, Cumulocity offers to collect reference firmware and software for devices respectively.
Info: The descriptions below refer to firmware but also apply to device software.
Click Firmware repository in the Management menu in the navigator.
The available firmware objects will be displayed, presented as cards in a grid.
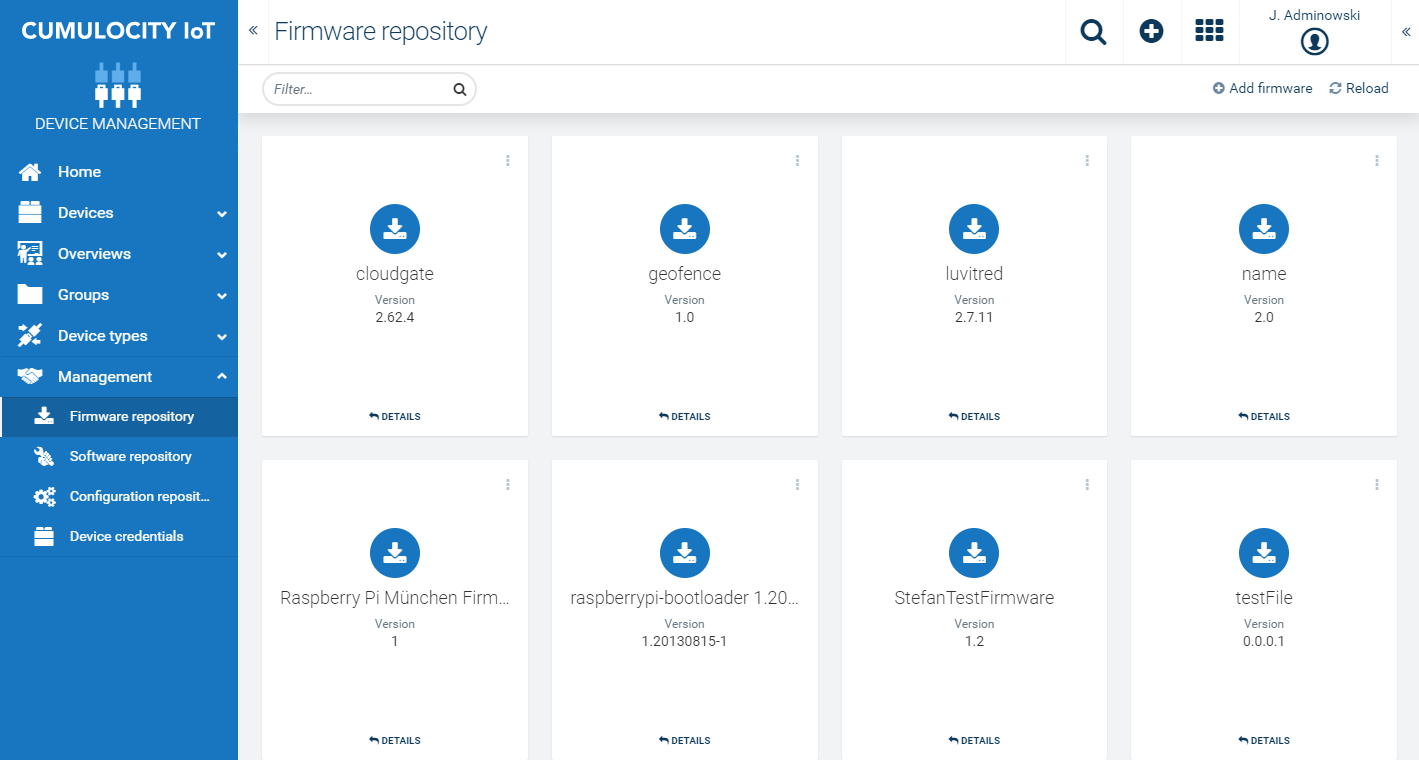
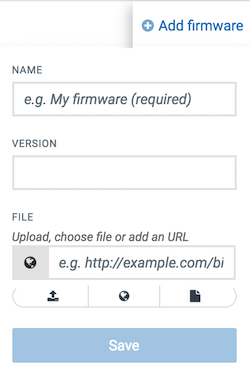
Click Details on a specific object to “turn around” its card and display details.
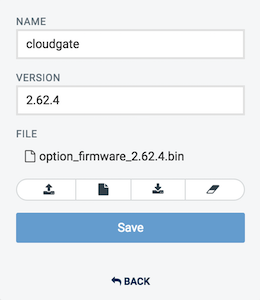
In addition to the object name and version, you will here find the name of the file containing the firmware.
Moreover, several action buttons are provided which are explained below.
The firmware object will be added to the firmware list.
Similarly, you can add a new software object to the Software repository.
The object will be updated.
The object will be downloaded to your file system.
Info: To store other types of binaries in Cumulocity, switch to the Administration application.
Cumulocity offers the option to execute firmware or software updates for multiple devices at once. To do so, follow these steps:
The operation status can be viewed in the Bulk operations tab of the selected group, see Bulk operations.
Click the menu icon at the top right of a firmware/software card and click Delete firmware (or Delete software).
The object will be deleted from the list.
Cumulocity allows to retrieve configuration data and store and manage it in a configuration repository. The configuration data contains the parameters and the initial settings of your device.
Configuration snapshots help you, for example, to apply the same configuration to multiple devices as described below.
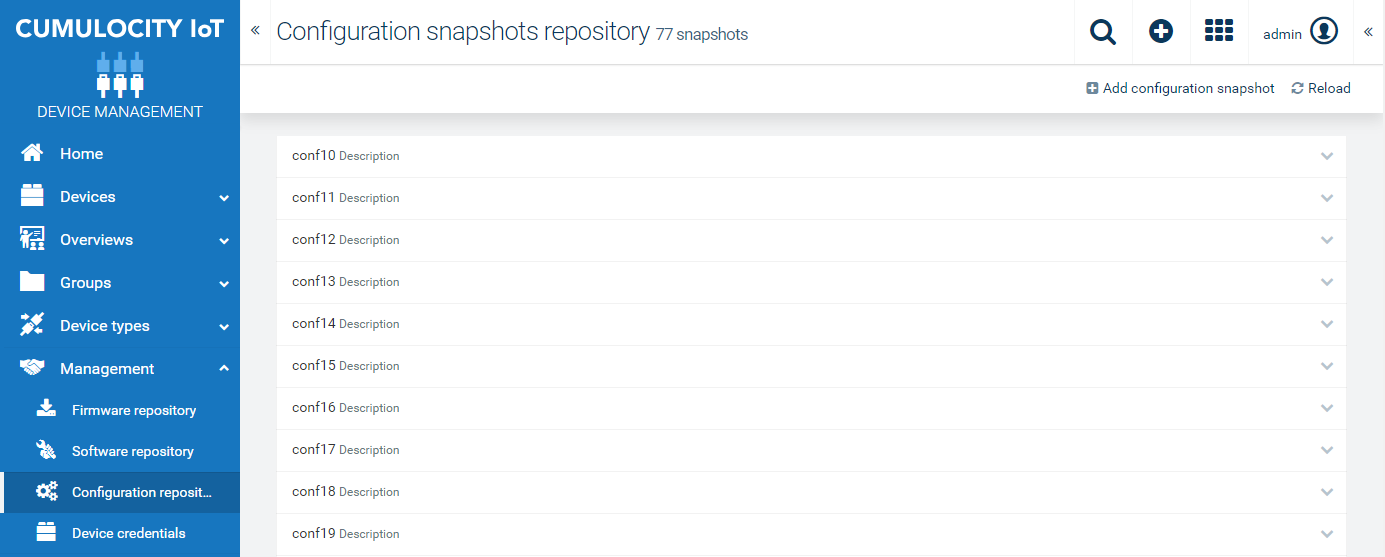
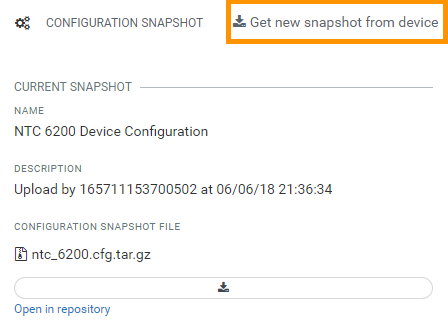
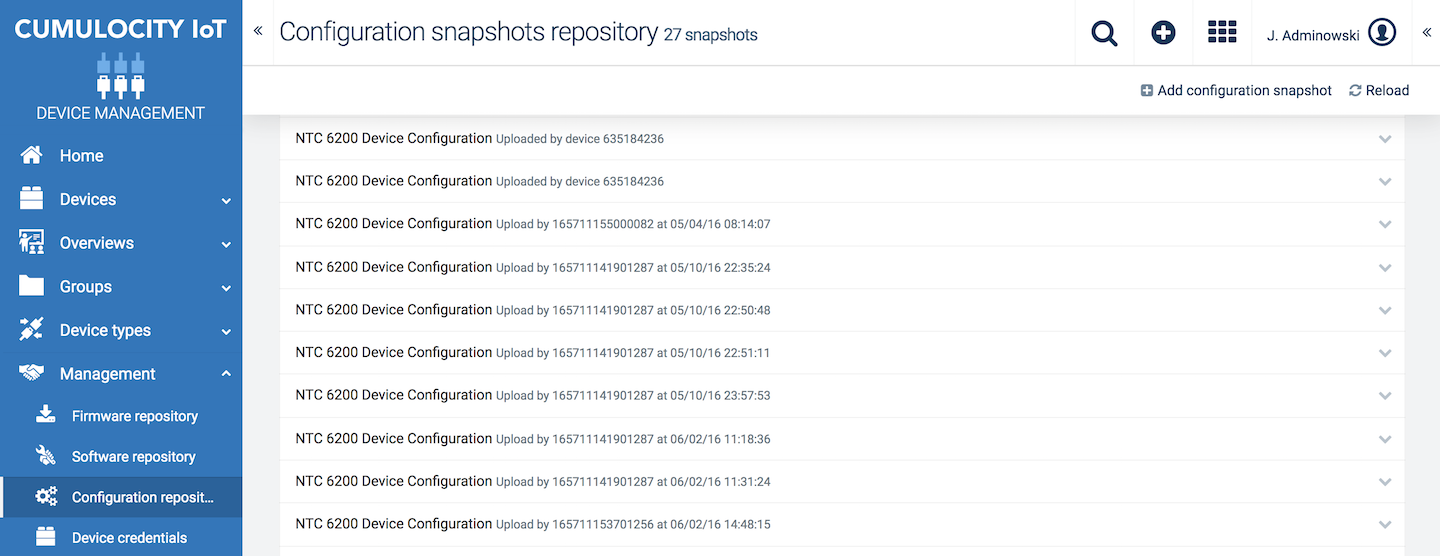
Click Configuration repository in the the Management menu in the navigator. In the Configuration repository page, all available configurations are listed. Each entry shows the configuration name, the device from which it has been uploaded and the upload timestamp.
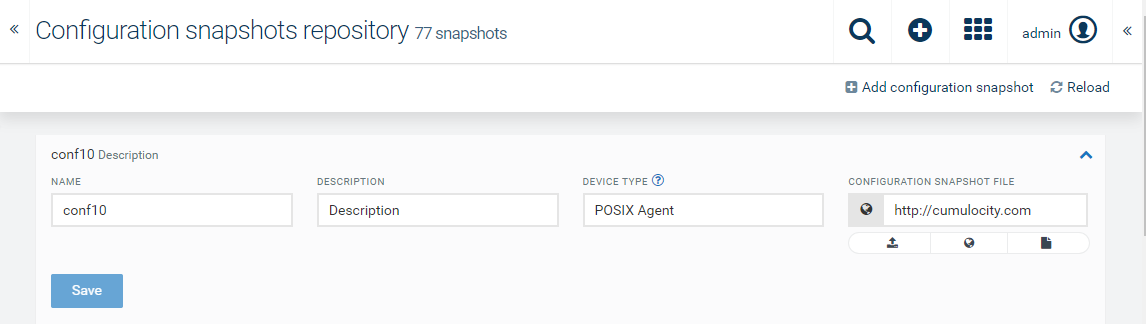
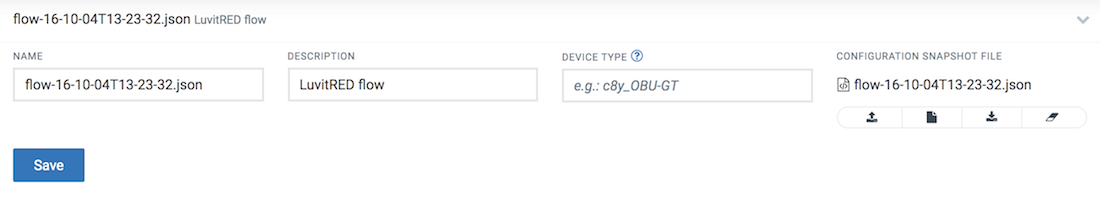
Click a configuration in the list to open it. You may modify the settings here and apply them by clicking Save. Refer to the section below for details on the fields.
The snapshot will be added to the configuration repository.
In addition to adding configurations from a file you can also add configurations by retrieving them from a device.
In order to retrieve a current configuration snapshot from a device, follow these steps:
The retrieved snapshot can be found in the Configuration repository, under Management menu in the navigator.
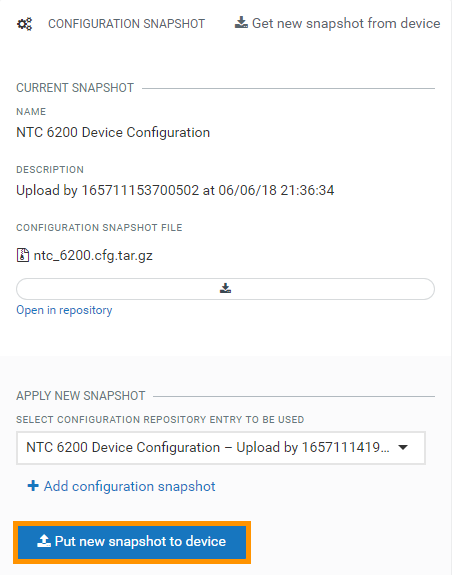
Info: When you apply a snapshot configuration from one device to another, the configuration may contain data which is device-specific.
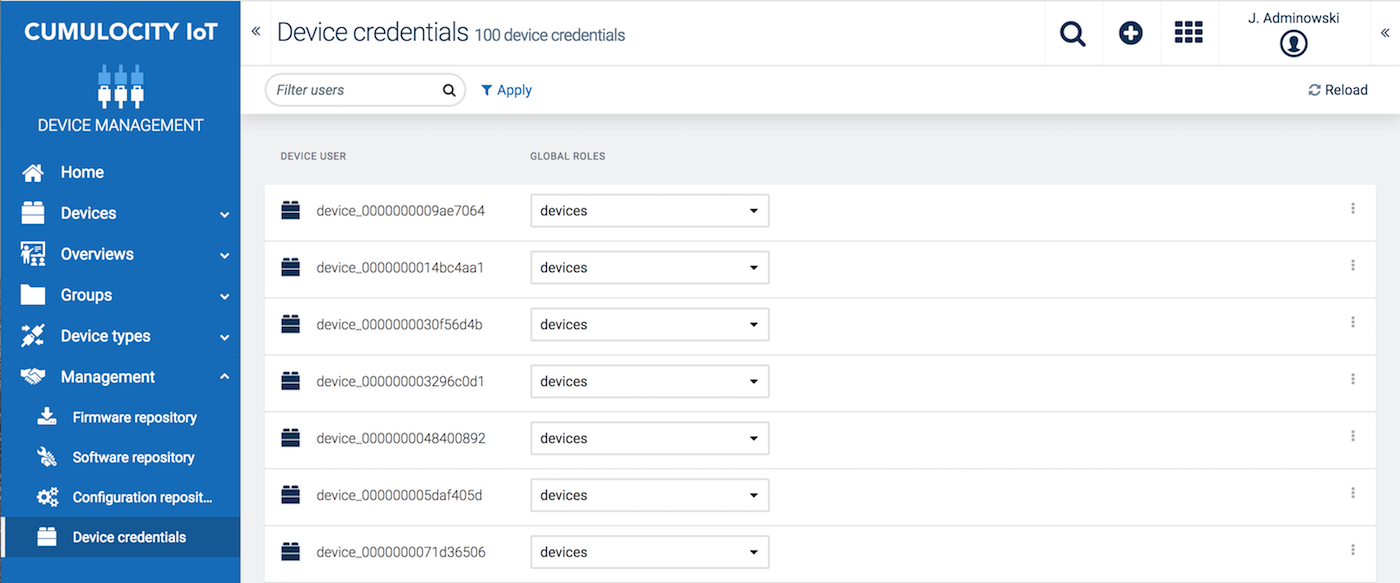
The Device credentials page lists all credentials that have been generated for your connected devices. Each device that has been registered shows up here with the naming convention “device_<id>”.
The roles for the device will be updated accordingly.
Click the menu icon at the right of a device credentials entry and then click Edit to open the device details.
In the details page, you may disable/enable a device by clicking the Active toggle, change the password for a device, or assign or remove permissions by selecting/deselecting roles in the Global roles list.
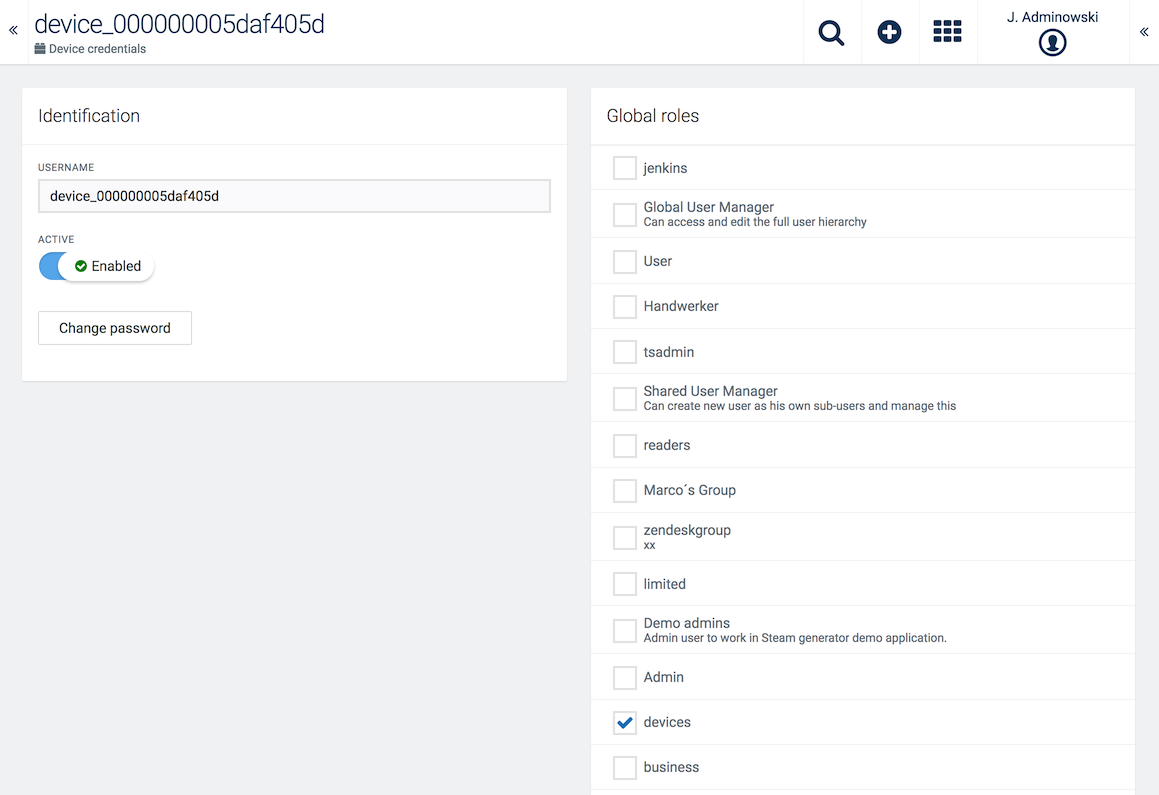
Click Save.
The device credentials will be updated accordingly.
Click the menu icon at the right of a device credentials entry and then click Disable.
The device credentials will be temporarily disabled.
Click the menu icon at the right of a device credentials entry and then click Delete.
The device credentials will be permanently deleted.
Deleting device credentials might be required if you have carried out a factory reset on a device. In this case, the device will often loose its assigned credentials. Delete it and continue with the normal registration process to re-register the device.
Cumulocity allows to retrieve configuration data and store and manage it in a configuration repository. The configuration data contains the parameters and the initial settings of your device.
Configuration snapshots help you, for example, to apply the same configuration to multiple devices as described below.
For details on configuration management also refer to Device management library > Configuration management in the Reference guide.
In the Configuration repository page which you open from the Management menu in the navigator, all available configurations are listed. Each entry shows the configuration name, the device from which it has been uploaded and the upload timestamp.
Click a configuration in the list to open it. You may modify the settings here and apply them by clicking Save. Refer to the section below for details on the fields.
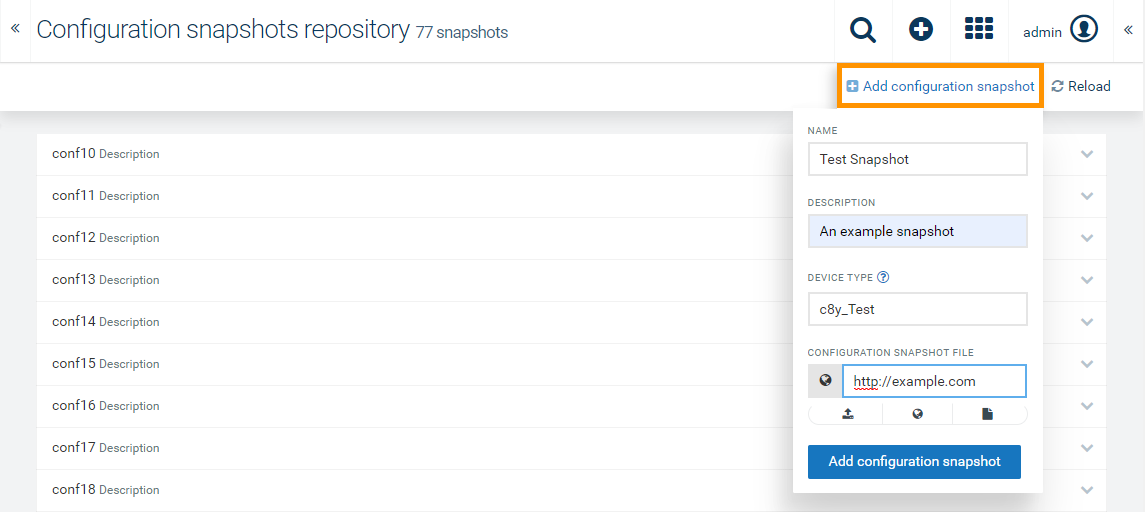
Click Add configuration snapshot at the right of the top menu bar.
In the resulting dialog box, enter a unique name and optional description for the configuration.
In the Device type field, enter a device type. The device type can be found in the Info tab of the target device.
Under Configuration snapshot file click one of the available options to select the file:
Click Add configuration snapshot to save your settings.
The snapshot will be added to the configuration repository.
In addition to adding configurations from a file you can also add configurations by retrieving them from a device.
The retrieved snapshot will be added to the configuration repository.
Info: When you apply a snapshot configuration from one device to another, the configuration may contain data which is device-specific.
SmartREST templates are a collection of request and response templates used to convert CSV data and Cumulocity Rest API calls. For example, you can use SmartREST templates to easily add devices to the platform instead of manually writing the requests each time.
To ease the device integration, Cumulocity supports static templates that can be used without the need for creating your own templates. These templates focus only on the most commonly used messages for device management. For further information on static templates, refer to the Device SDK guide.
Open the SmartREST template page from the Device Types menu in the navigator.
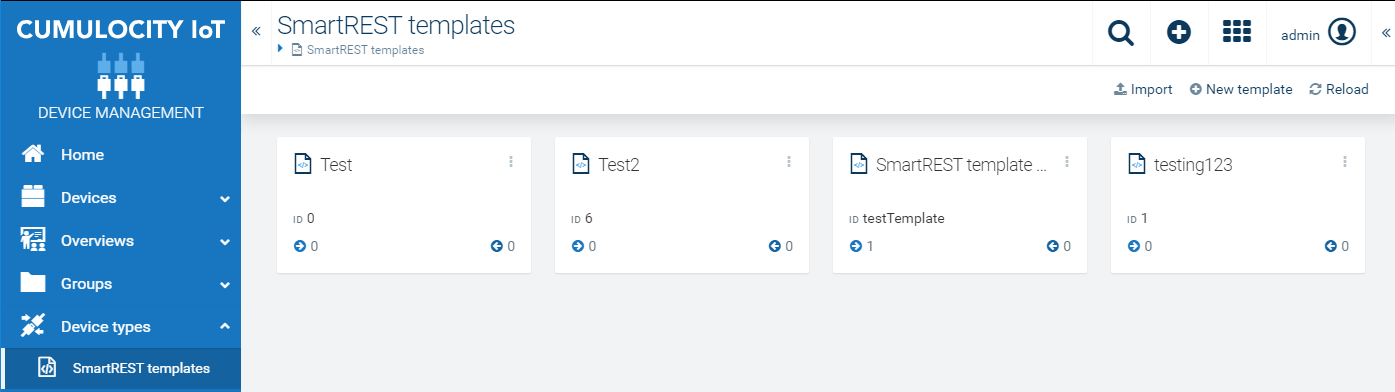
For each template, the following information is provided:
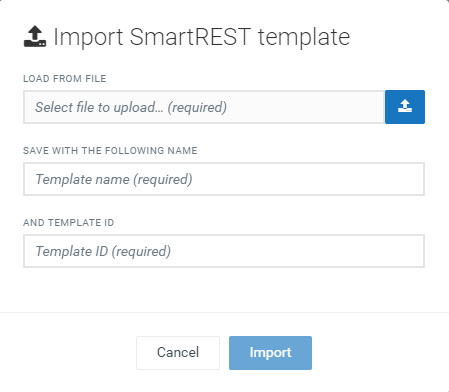
There are two ways to add a SmartRest template:
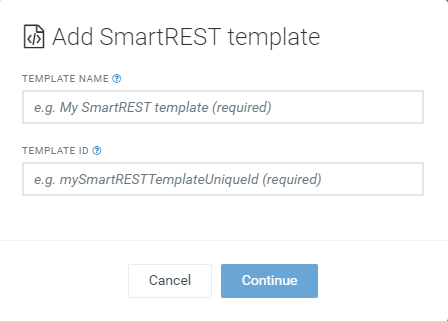
The message template contains all necessary information to convert the SmartRest request into a corresponding Rest API call which is then sent to the platform.
To add a new message, navigate to the Messages tab in your desired SmartREST template and click Add message.
Complete the following fields:
| Field | Description |
|---|---|
| Message ID | Unique integer that will be used as a message identifier. It must be unique among all message and response templates. |
| Name | Name for the message. Mandatory. |
| Target REST API | REST API for the target. Dropdown list. May be one of Measurement, Inventory, Alarm, Event, Operation. |
| Method | Request method. May be one of POST, PUT, GET, depending on the selected Target REST API. |
| Include Responses | Select this checkbox if you want to process the results of the request with response templates. |
| REST API built-in fields | These fields are optional and vary depending on the target REST API selected. In case no value is provided, a device will be able to set it when sending an actual message. |
| REST API custom fields | Additional fields can be added by clicking Add field. Enter the API key and select the desired data type. |
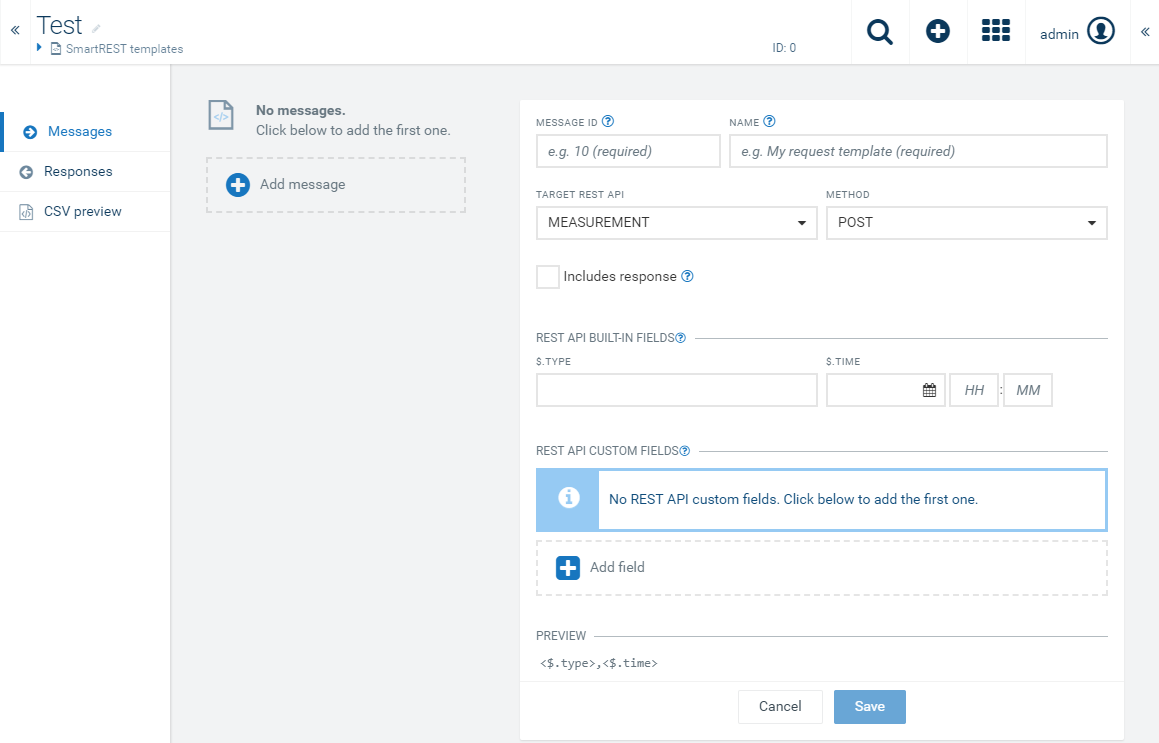
Under Preview you can see a preview of your request message.
Click Save.
The message will be added to the SmartREST template.
To remove a message, open it and click Remove at the bottom.
The message will be removed from the SmartREST template.
A response template contains the necessary information to extract data values from a platform REST API call response, which is then sent back to the client in a CSV data format.
To add a new response, navigate to the Response tab in your desired SmartREST template and click Add response.
Complete the following fields:
| Field | Description |
|---|---|
| Response ID | Unique integer that will be used as a response identifier. |
| Name | Name for the response. Mandatory. |
| Base Pattern | Base pattern for the response. |
| Condition | Condition value of the response. |
| Pattern | At least one pattern is required. Click Add pattern and enter a pattern value. |
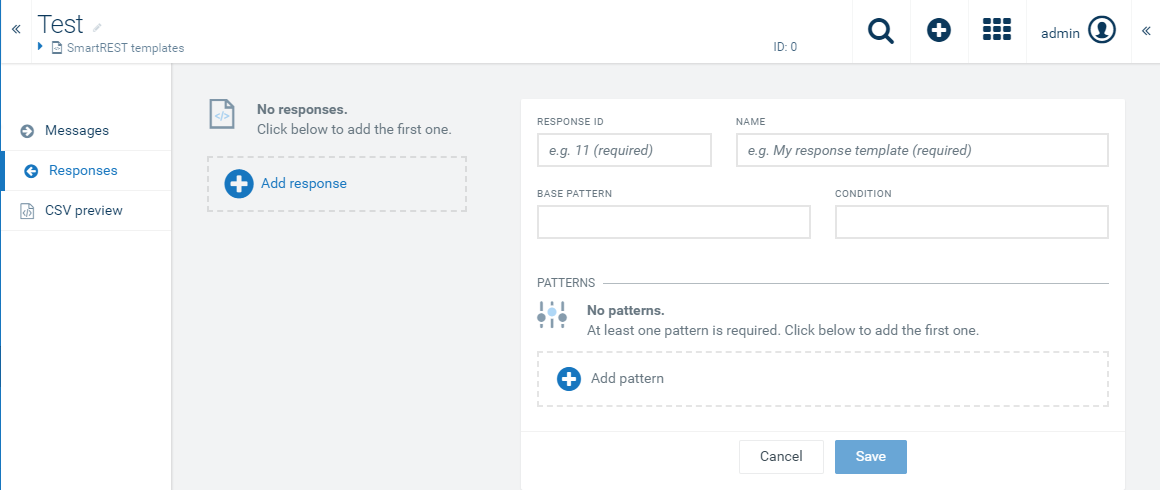
Click Save.
The response will be added to the SmartREST template.
To remove a response, open it and click Remove at the bottom.
Either click the desired template or click the menu icon at the top right of the respective template card and then click Edit.
After editing the template, click Save to save your settings.
Click the menu icon at the top right of the respective template card and then click Remove.
Click the menu icon at the top right of the respective template card and then click Export.
The template will automatically be downloaded to your file system.
To export a SmartREST template as CSV file follow these steps:
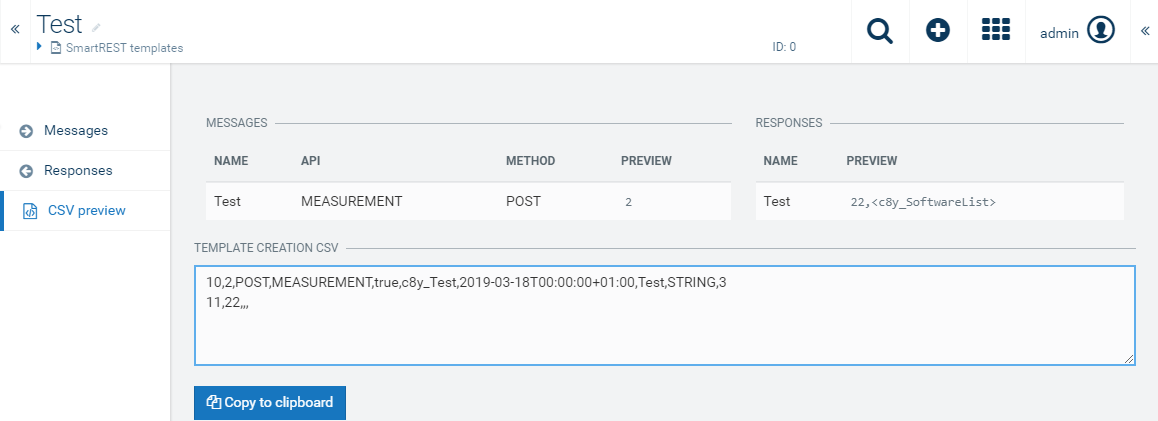
The SmartREST template will be exported as CSV file.
With the Cumulocity simulator all aspects of IoT devices can be simulated, as
With the simulator you can create artificial devices that have the same level of functionality as connected hardware devices.
A simulator uses a playlist to simulate messages that the device sends to the Cumulocity IoT platform. A playlist is a series of instructions that the simulator executes one after the other. When the last instruction is reached, the simulator starts again with the first one.
An instruction can either send a message (measurements, alarms, events and inventory) or wait for a specified time (sleep).
A message is defined by choosing a message template (like sending a temperature) and providing the values for this template (e.g. 23.0 degrees). Many predefined message templates are provided, e.g. for creating a measurement, sending an event, creating and cancelling an alarm. These templates are based on MQTT static templates. Additionally, custom message templates can be defined using the SmartREST template editor.
Click Simulators in the Devices menu in the navigator to open the Simulators page.
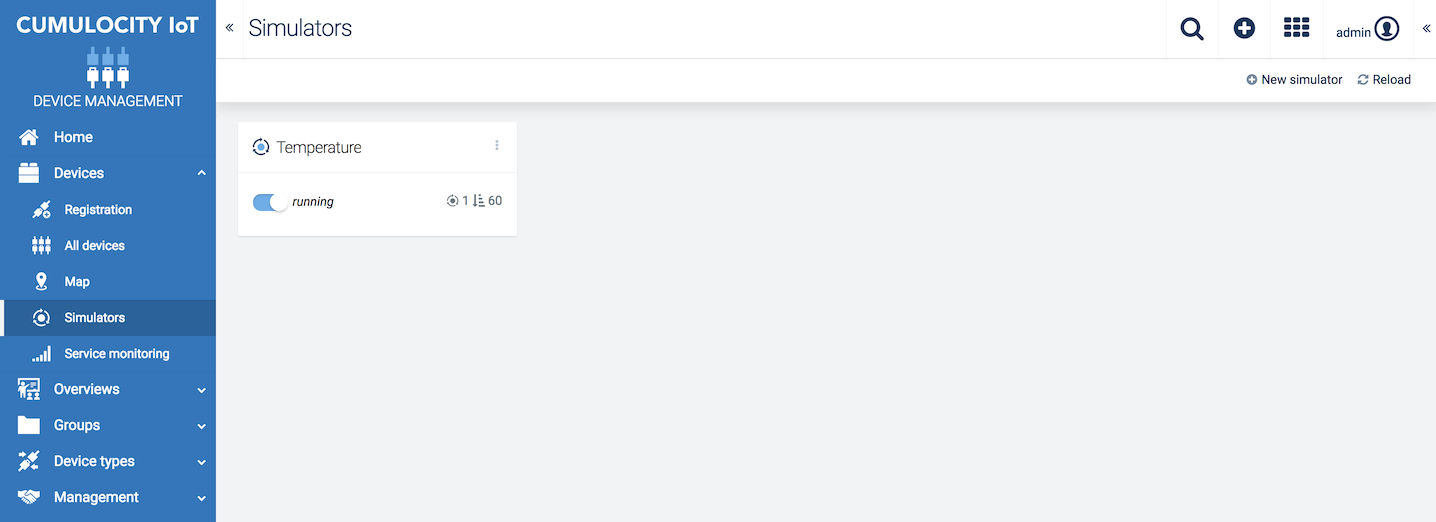
All simulators which you can access will be listed here.
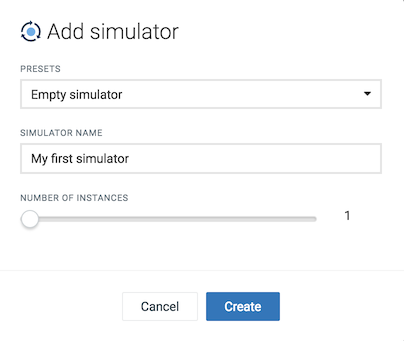
The simulator will be created and added to the list.
The new simulator will be added to the list.
The simulator will be removed from the list.
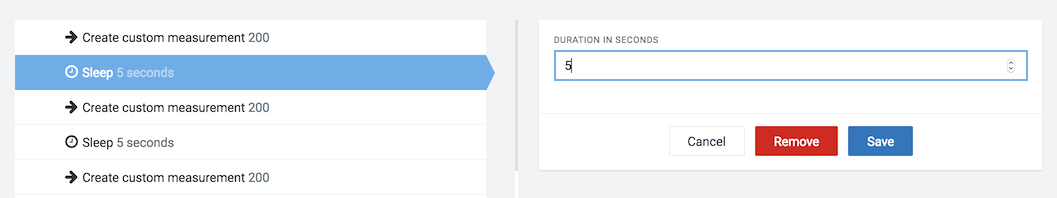
For each simulator, you can create instructions specifying what the simulator is supposed to do. Instructions are single tasks added to a playlist through which the simulator will work.
Instructions can be viewed and edited on the Instructions tab of the simulator.
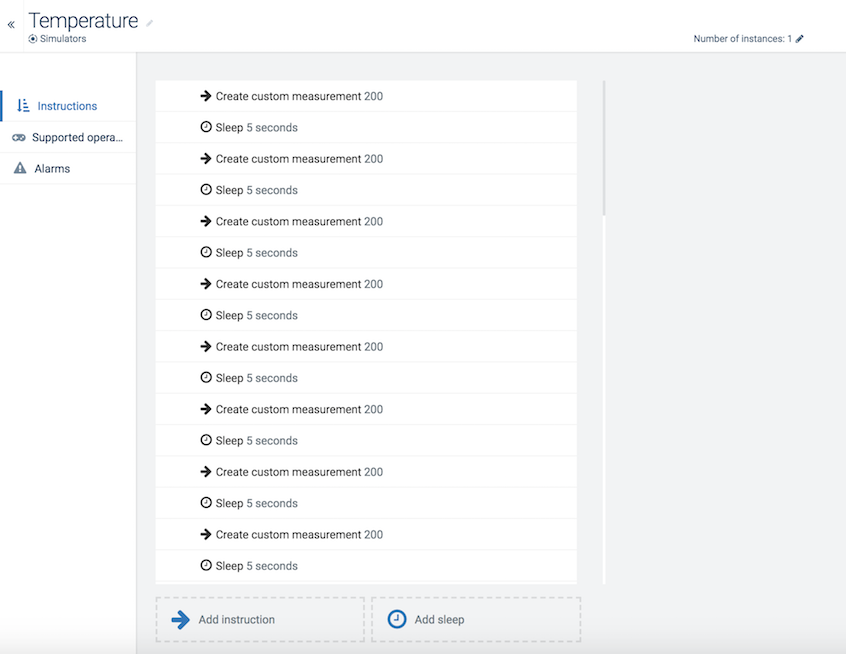
Examples
The simulator presets already contain sample instructions. For example, the “Temperature measurement” preset contains instructions for the steps “Create measurement” and “Sleep”, see image above.
The panel on the right changes according to the type of instruction selected on the left.
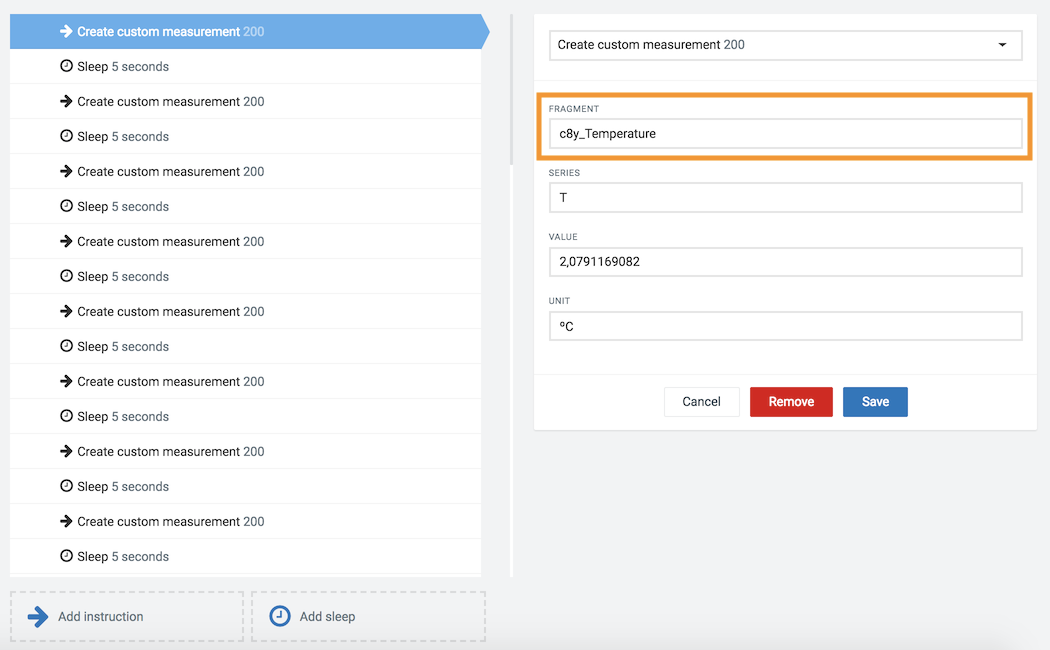
The measurement instruction refers to a fragment. Fragments are used to identify capabilities of a managed object. Find more details about fragments in
Sensor Library in the Reference guide.
The “Sleep” instruction requires one value for its duration in seconds.
The new instruction will be added to the simulator.
The new sleep instruction will be added to the simulator.
Hover over the instruction or the sleep you want to remove and click the remove icon.
The instruction will be removed from the simulator.
In the Supported operations tab of a simulator you can find specific operations like configurations or software/firmware updates.
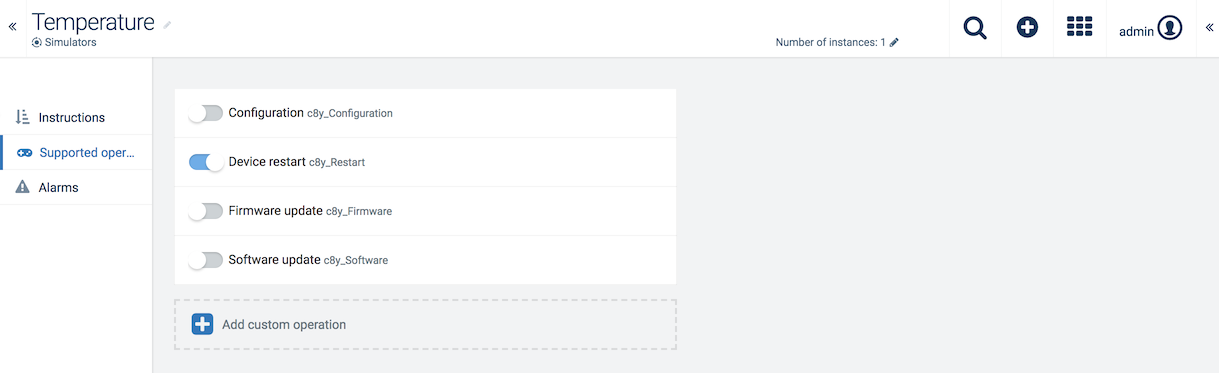
Click the toggle to turn the respective operation on or off.
The custom operation will be added to the operation list.
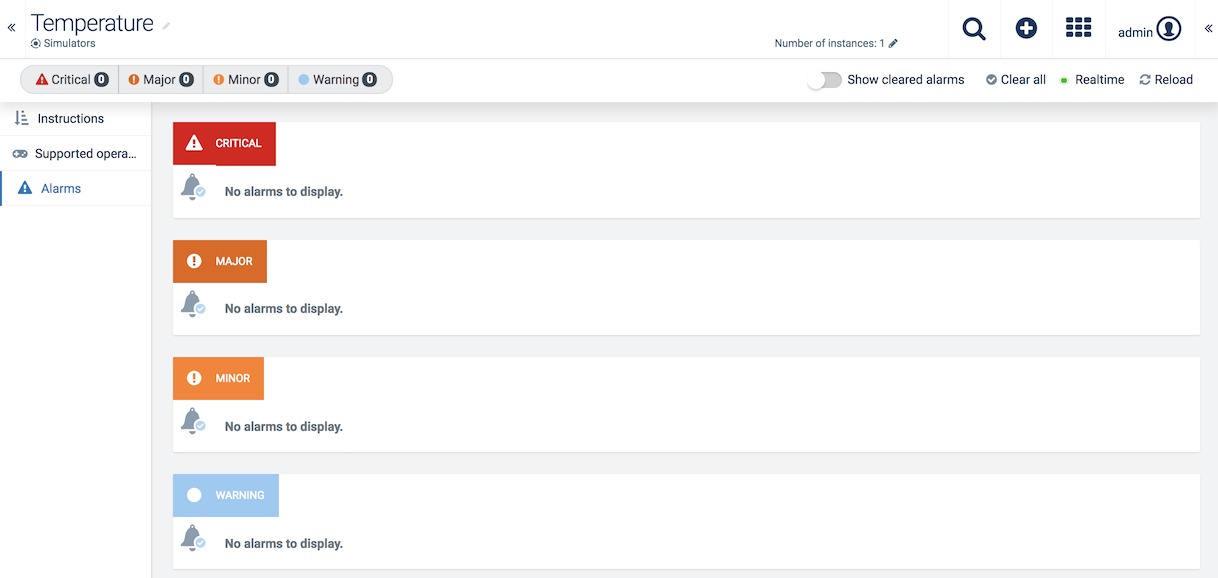
The Alarm tab of a simulator displays alarms related to the simulator itself, not related to the simulated device, i.e. if the simulator itself does not work correctly. See Working with alarms for information on alarms.