Cockpit
The Cockpit application provides you with options to manage and monitor Internet of Things (IoT) assets and data from a business perspective.
The Cockpit application provides you with options to manage and monitor Internet of Things (IoT) assets and data from a business perspective.
The following sections will walk you through all functionalities of the Cockpit application in detail.
For your convenience find an overview on the content of this document below.
| Section | Content |
|---|---|
| Managing assets | Organize assets in hierarchies by creating groups and assigning devices. |
| Visualizing data using the Data Explorer | Interactively explore, compare and visualize IoT data. Describes how to access and use the data explorer, add data points to the data explorer, customize data point properties, modify the visualization, store the data explorer as widget, and export the data. |
| Working with dashboards | Create your own analytics and monitor pages by adding and arranging widgets. Share dashboards among all devices of the same type. |
| Widgets collection | Use various types of widgets from the Widgets collection that comes with Cumulocity and configure them according your needs. |
| Working with alarms | Monitor problems of your assets using severities and workflows. Since working with alarms in the Cockpit application is actually the same as working with alarms in Device Management, refer to Working with alarms in Device Management. |
| Managing reports | Handle reports based on dashboard layouts, create reports for exporting data in CSV or excel format and schedule the export. |
| Using the Data Point Library | Manage default settings (“profiles”) of your devices and apply them automatically using the Data Point Library. |
| Working with Smart Rules | Create and manage business rules to work on incoming data in realtime and to perform actions based on this data. |
| Smart Rules collection | Use pre-defined global Smart Rules to configure rules for geofencing, thresholds or alarm escalation and notifications (SMS/email/voice). Describes each SmartRule and its configurable parameters in detail. |
If you want to learn more about general aspects of the Cumulocity platform and its applications, refer to Getting Started.
The Home screen of the Cockpit application is a dashboard which shows data for the general tenant.
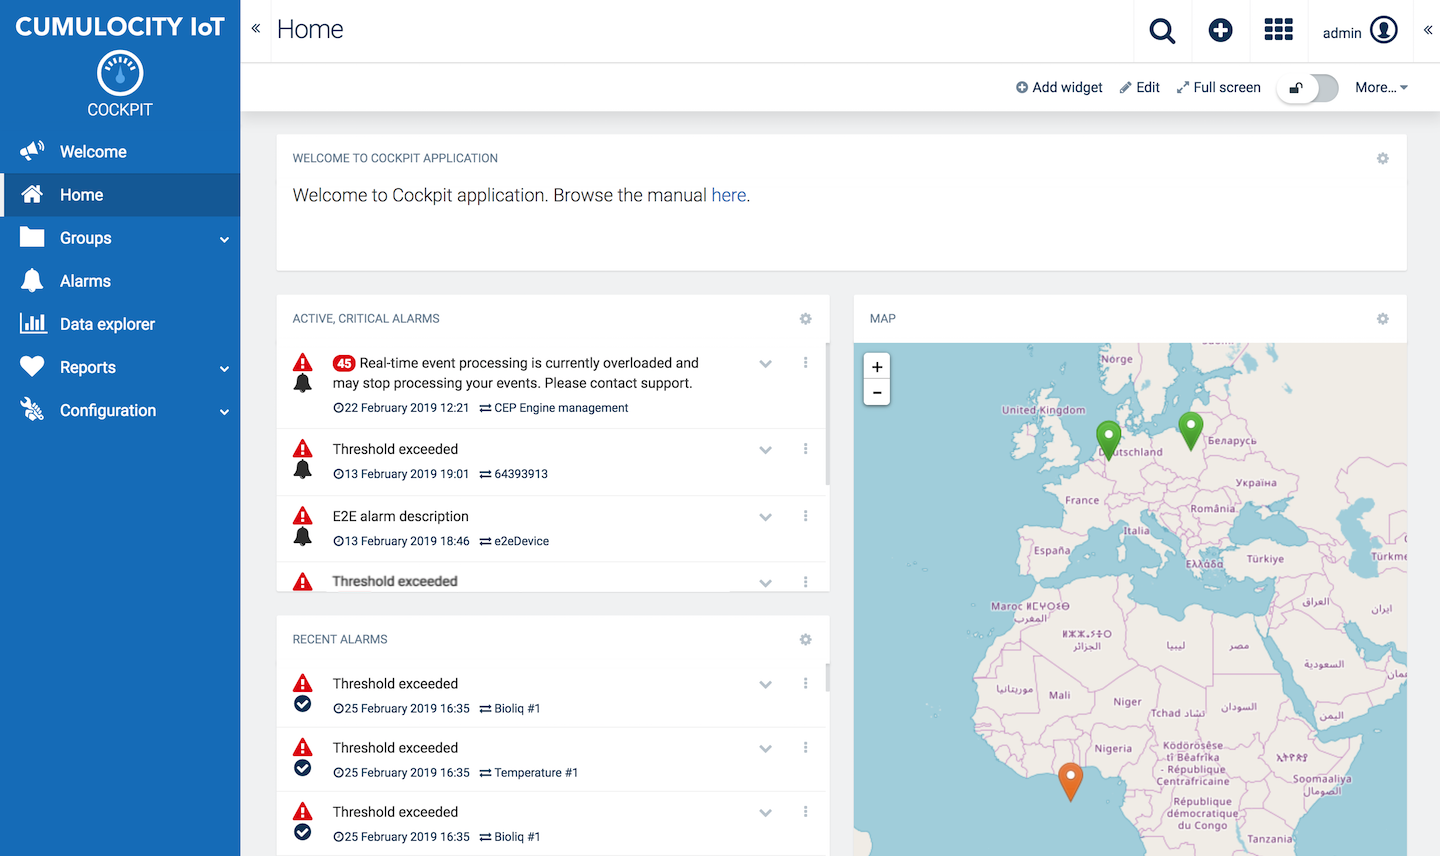
The data shown on the Home dashboard is shared by all users of the tenant. By default, the Home dashboard includes a welcome message, the active critical alarms, recent alarms and a map of all objects.
The Home dashboard can be edited and designed individually according to your needs. You can add, remove or change widgets being displayed here.
For details on editing a dashboard, refer to Working with dashboards.
To reset the Home dashboard to its original content, click More… at the right of the top menu bar and then click Restore dashboard.
Assets represent business objects in general like buildings, machines, production units or cars.
Assets are organized in hierarchies. For example, an energy monitoring application might have the following asset hierarchy:
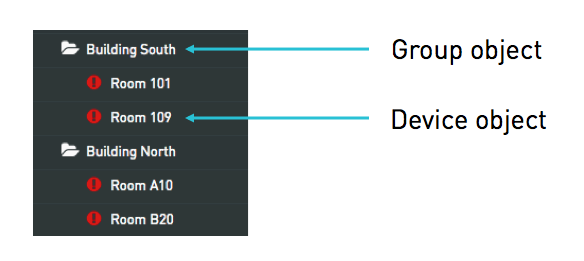
The asset hierarchy is composed of two types of objects:
Groups: Objects which group single devices or other groups. Groups can either be created in the Cockpit application or in the Device Management application.
Devices: Devices which are linked into the asset hierarchy. Before you can use devices in the Cockpit application, they need to be connected to Cumulocity. This is done in the Device Management application. For details on connecting devices refer to Connecting Devices in the Device Management section.
In this example, the group objects represent a building asset. The device objects represent the room asset. The group names and hierarchy can be defined individually by the user. The hierarchy can have multiple levels, like region level, city level, street level, building level, floor level and room level. Any device can be part of multiple and different hierarchies, like part of regional hierarchy and part of customer hierarchy.
To position a device in the asset hierarchy, you have to “assign” the device to the respective group. See description below for details.
Info: Single devices are not managed in the Cockpit application. They are managed in the Device Management application.
Cumulocity supports two types of hierarchies: a device hierarchy and an asset hierarchy.
The device hierarchy tracks how devices are linked to Cumulocity from a communications point of view. The asset hierarchy structures the assets that are being remotely supervised and controlled through the M2M devices. For details, refer to Cumulocity’s domain model in the Concepts guide.
In the Cockpit application, you construct your asset hierarchy by creating group objects and by linking devices into the hierarchy. The asset hierarchy depends on the IoT devices used. There are many types of IoT devices, but these two types are very common:
Smart devices are self-contained devices that include sensors, actuators and a communication module. They are typically connected to a single asset. Smart devices are trackers, weather stations or general “smart” sensors with a built-in communication module.
Gateway devices establish the communication from other devices to Cumulocity but do not include sensors or actuators. Typical gateway devices include Zigbee, Modbus, M-Bus or KNX gateways.
The following section explains how to work with smart devices and gateway devices in the Cockpit application.
The first example shows how smart devices are linked into the asset hierarchy:
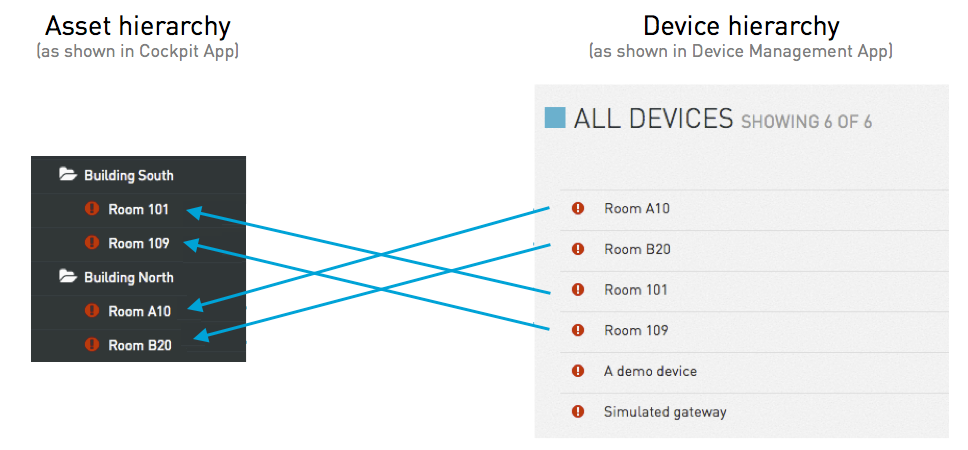
Smart devices are represented in the Device Management application as top-level devices. In the Cockpit application, you can organize smart devices into groups, as the arrows indicate in the above diagram.
The second example shows how gateway devices can be used in the Cockpit application.
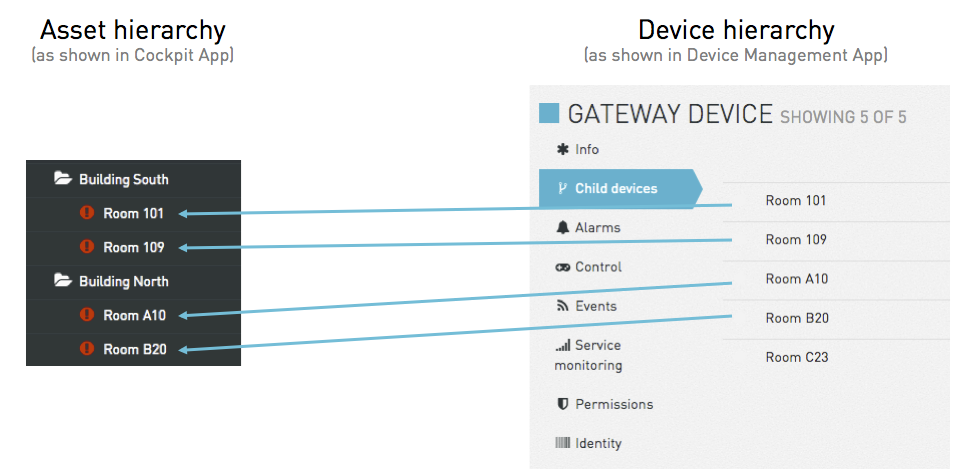
In the Device Management application, gateway devices are represented as top level devices. Their attached devices (like for example Modbus or KNX devices) are shown as child devices. These child devices can be organized in the asset hierarchy in the Cockpit application as shown above.
As you can see from the example, devices can have completely different hierarchies in the Device Management application and in the Cockpit application: While inside Device Management all child devices are below the gateway device, the same child devices are organized in two different buildings in the Cockpit.
The mapping of objects in the Cockpit asset hierarchy is a virtual hierarchy.
If you manage trucks within the Cumulocity platform, then each truck is represented via its individual tracking device communicating with Cumulocity.
For building management, it is most common that a group of sensors inside a building represents the building as a group communicating with the Cumulocity platform.
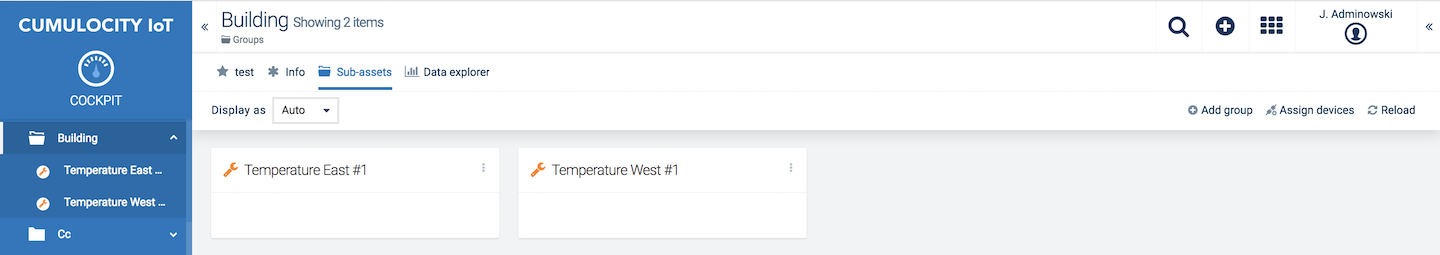
In the asset hierarchy, Cumulocity distinguishes between top-level groups and subgroups, so called sub-assets.
In the navigator, top-level groups are shown in the Group menu at top-level. Sub-assets are shown in the navigator under the top-level groups or in the Sub-asset tab of a particular group.
When selecting an object in the asset hierarchy, details on the selected object are displayed at the right.
If you add a gateway device, the child devices are not shown. To show child devices, you must add them to the related asset. Details related to the child hierarchy are visible and editable in the Device Management application.
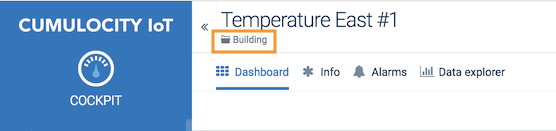
To navigate further in the asset hierarchy, use the navigator or select an object in the Sub-Asset tab. To navigate up in the asset hierarchy, use the breadcrumb entry below the name of the asset.
Several tabs are available for each object, dependent of the object type:
| Tab | Description | Availability |
|---|---|---|
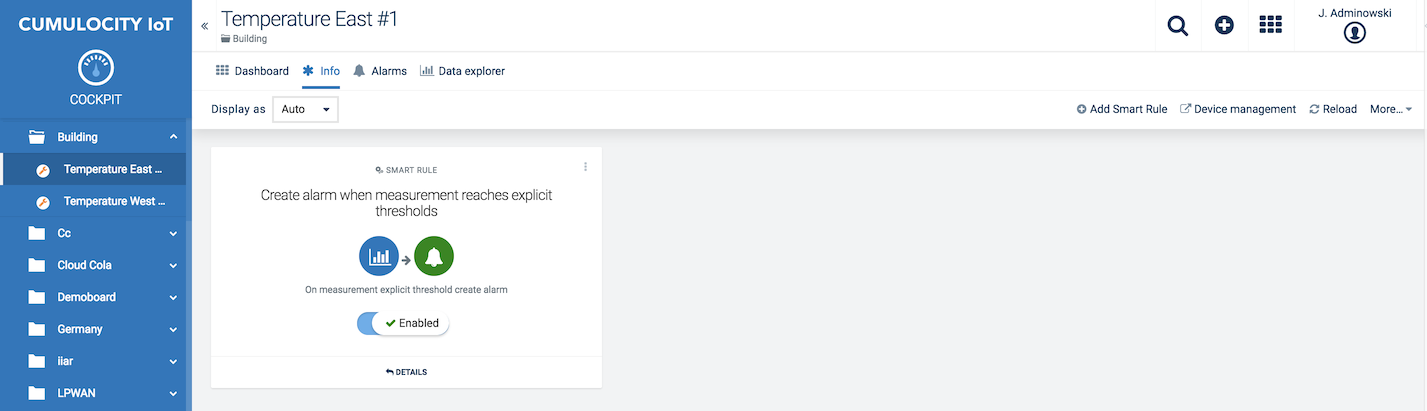
| Info | Shows a list of Smart Rules created for the object. | Group, Device |
| Alarms | Displays alarms for the device. For details on alarms, refer to Working with alarms in Device Management. | Device |
| Sub-assets | Shows the sub-assets of a group. | Group |
| Data explorer | Shows all data points of the children. For details refer to Visualizing data using the data explorer. | Group, Device |
| Location | Shows the current location of a device. | Device |
If dashboards have been created for an object, they will also be added as a tab. See Working with Dashboards for details.
Moreover, additional tabs may be displayed here in case the application has been extended with plugins. See Web SDK for plugins for details.
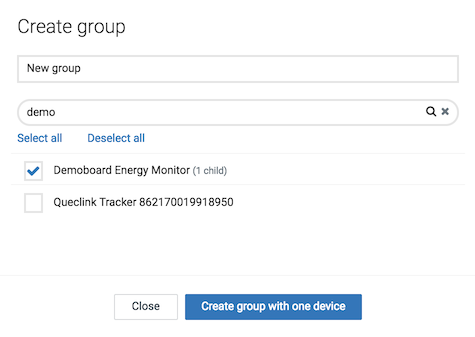
Info: A group can also be created with “0” devices in it.
To add a new group as a child of an existing asset, navigate to its Sub-asset tab and click Add Group in the top menu bar.
Before adding a device to the asset hierarchy, it must be connected to Cumulocity. Connecting devices to the platform is done in the Device Management application. For details on connecting devices refer to Device Management.
To assign a device to a group, follow these steps:
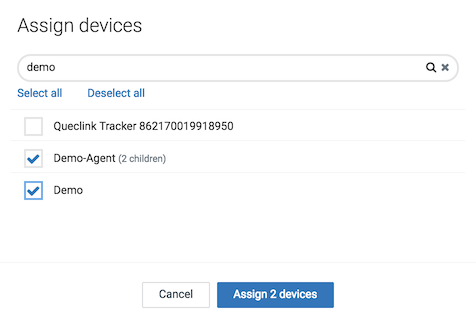
The devices will be shown as sub-assets in the Sub-assets tab.
To delete a top-level group from the navigator, follow these steps:
To delete a group from the Sub-assets tab of another group, follow these steps:
Unassigning a device does not remove the device, sub-devices or any associated data. The device is only removed from its location in the asset hierarchy. It can be assigned to this group or other groups later.
In the data explorer, data points, i.e. measurements or sensor data, can be visualized.
The data explorer is available for all assets or just for a particular asset.
Click Data explorer in the navigator to visualize all data points of all assets.
Navigate to a particular asset and switch to the Data explorer tab to visualize all data points of this particular asset and its sub-assets.
In the data explorer, you see a list of available data points on the right. The first five data points of the selected device or group are shown by default. For details on how to add data points see Adding data points.
On the left, in the main card, you see its visualization.
The visualization is generated based on data point properties.
The data points properties are pre-filled as follows:
If these properties have been customized previously, these values are used, see Customizing data point properties.
If the data points have a matching definition in the Data Point Library, the values from the Data Point Library are used.
There can be more than one matching data point entry in the Data Point Library. In this case, the first one is selected automatically by the system. You can overwrite this selection by clicking the menu icon of the respective data point and selecting Load [NAME] from Library.
For details on modifying the visualization in general, see Changing data point visualization. For details on customizing the properties of a particular data point, see Customizing data point properties.
Info: Data points are visible to all authenticated users of the tenant, regardless of their inventory role permission.
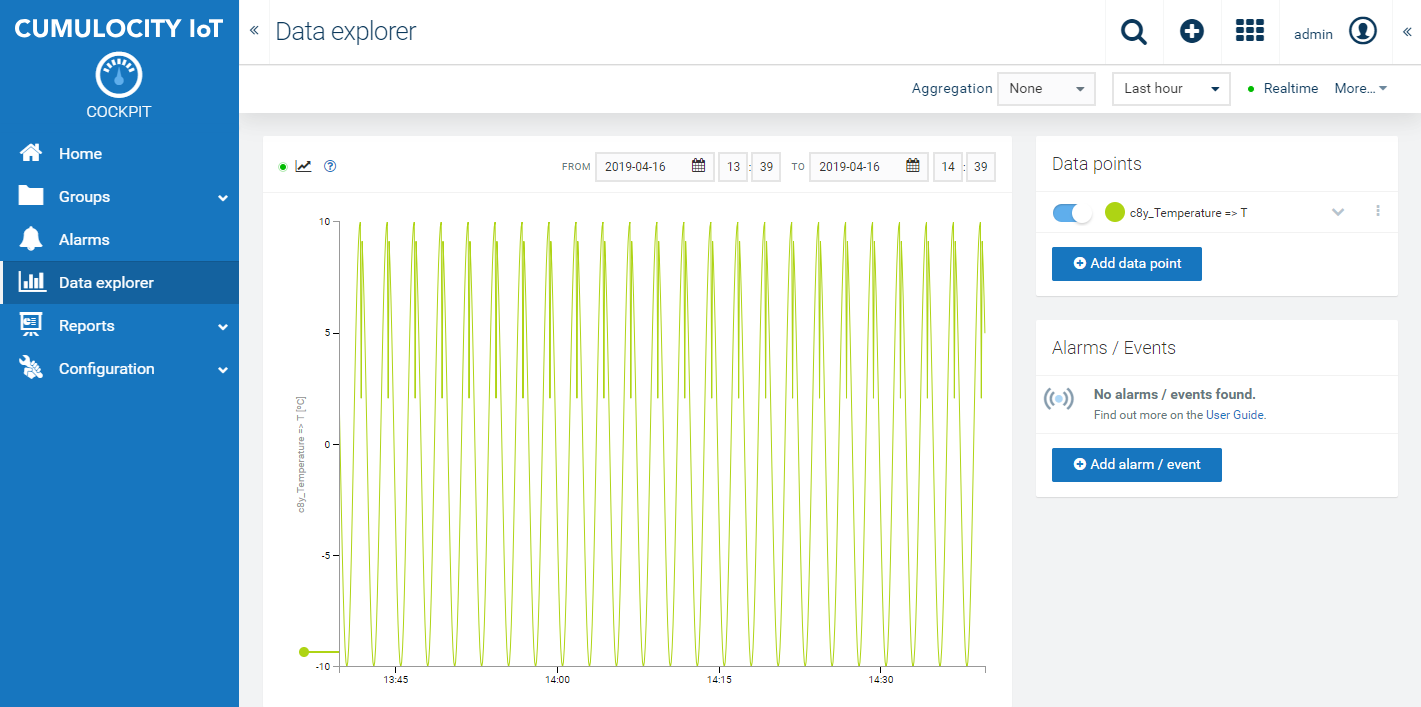
To change the visualization in the data explorer, you can modify several properties.
Time range
You can change the time range being shown. By default, you see the values for the last hour.
To change the time range on the X-axis,
Info: Real-time updates will be switched off if you set a time range in the past.
Aggregation
You may aggregate the data being displayed to get an efficient overview over larger time periods.
By default, aggregation is set to “None”. This value may be changed in the Aggregation field in the top menu bar. Available values are “Minutely”, “Hourly” or “Daily”, depending on the selected time range.
Realtime updating
By default, realtime updating is enabled which means that the data being shown is updated as new data flows into the system from the connected devices.
To turn realtime updating on or off, click Realtime in the top menu bar. A green light indicates, that realtime updating is enabled.
Data point visibility
For each datapoint, its visibility can be switched on or off by using the slider left from the data point name.
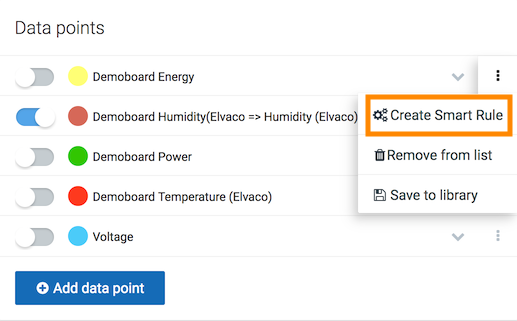
To add a data point to the data explorer, click Add data point at the bottom of the Data points card.
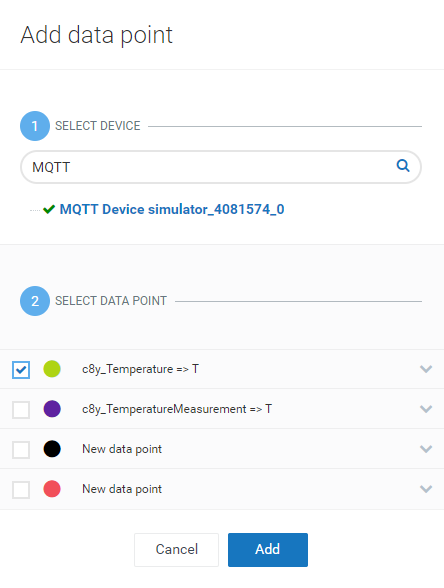
In the top of the dialog, select a device from the asset hierarchy. Only the asset hierarchy below the objects selected in the navigator is visible. If Data explorer in the navigator was selected, the complete asset hierarchy is visible.
The bottom of the dialog shows all data points of the selected object. Select the data points you want to show in the data explorer. Click Add to add all selected data points to the list of data points.
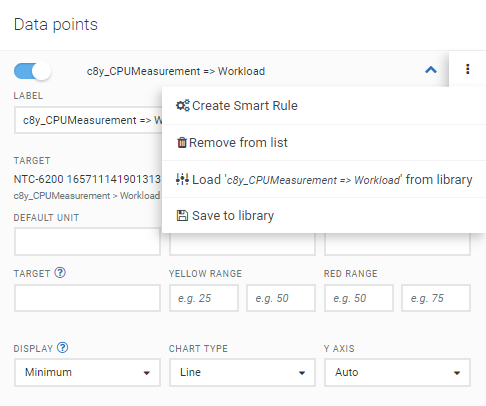
To save the data point to the Data Point Library, click the menu icon of the data point and from the context menu select Save to library.
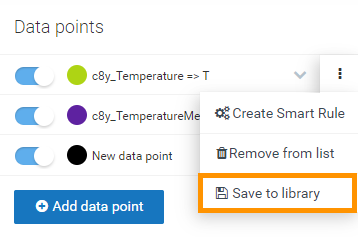
For details on the Data Point Library refer to Using the Datapoint Library.
To remove a data point from the data point list, click the menu icon and select Remove from list.
You can customize the visualization of a particular data point to your preferences. To do so, expand the data point entry in the data point list.
The following fields my be modified:
| Field | Description |
|---|---|
| Label | Name of the data point, displayed on the y-axis to identify the data point. Below the label, the target is displayed, showing the name of the asset and the internal name of the data point (measurement fragment and series). This information is not editable. |
| Unit | Unit used on the y-axis. |
| Min/Max | Range shown on the y-axis. |
| Target | The target value is currently not shown in the diagram. The value is used in the "Data Point List" widget. |
| Yellow range min/max | Defines the range when MINOR alarms should be raised by threshold rule. |
| Red range min/max | Defines the range when CRITICAL alarms should be raised by threshold rule. |
| Display | Value displayed when data is aggregated. May be "Minimum", Maximum", Minimum and maximum". |
| Chart type | The type of chart used for the visualization. May be one of "Line", "Points", "Line and points", "Bars", "Step before" (alternating between vertical and horizontal segments, as in a step function) or "Step after" (alternating between horizontal and vertical segments). Default value is "line". |
| Y axis | Defines where the y-axis is shown. May be one of "Auto", "Left", "Right". Default value is "Auto". |
After customizing the properties of a data point, you can save the modified settings to the Data Point Library. Click the menu icon and from the context menu select Update [NAME] to library.
To return to the properties stored in the Data Point Library to a data point, select Load [NAME] from library.
Per default, the first data point is positioned to the left y-axis and the remaining data points to the right. This behavior can be changed by modifying the respective value “Y-axis” for a particular data point (to “Left” or “Right”, see above).
Each data point is shown on its own y-axis, unless the following condition is met:
In this case, both data points share the same y-axis. This y-axis only shows the unit (or multiple units, in case they are different). The label is not shown.
In addition to data points you can also add alarms or events to the data explorer.
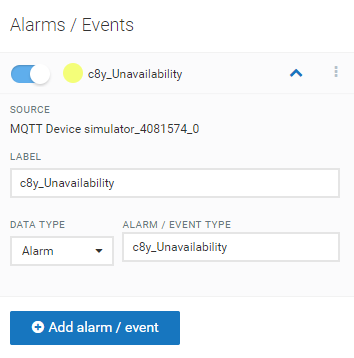
In the Alarms/ Events card, click Add alarm/ event to add an alarm or event.
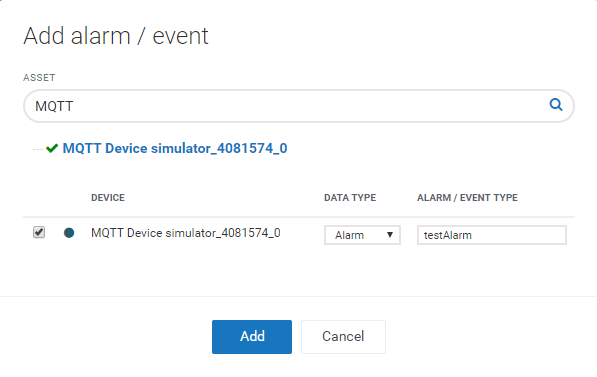
In the upcoming dialog, you can select an alarm or event from the list of recent alarms and events. Click Add, to add your selection.
Expand an event, to modify its properties.
Click the menu icon and in the context menu select Remove, to remove the entry from the list.
As with data points, you can turn the visibility of an alarm/ event in the data explorer on and off by moving the slider.
If you want to keep your current configuration in the data explorer for later usage, save it as a widget.
Send as widget to dashboard
To create a widget from the data explorer of a particular asset, click More… in the top menu bar and select Send as widget to dashboard from the context menu.
In the upcoming dialog, select one of the dashboards available for the current object and click Select to add the data explorer as widget to the selected dashboard.
Info: To use this function, first a dashboard has to be created. For details on dashboards, refer to Working with Dashboards.
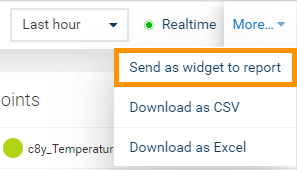
Send as widget to report
To create a widget from the data explorer of in the navigator, click More… in the top menu bar and select Send as a widget to report from the context menu.
In the upcoming dialog, select one of the reports available and click Select to add the data explorer as widget to the selected report.
Info: To use this function, first a report has to be created. For details on reports, refer to Working with Dashboard reports.
You may download measurement data as CSV or Excel files. The exported data shows the following information, divided into columns:
To export measurement data, click the More… button in the top menu bar and select either Download as CSV or Download as Excel, according to your preferences.
The download will be generated, as shown in the upcoming dialog. This make take a while, depending on the number of data points added to the data explorer. Once the loading has been completed, click Download.
Dashboards provide you with a customized visualization of your data by using a set of widgets. Widgets can display maps, images, graphs, tables and other graphic representations of data.
Cumulocity comes with a number of preset widgets, see Widgets Collection for details. You can also develop your own widgets and add them to your Cumulocity account. Refer to the Web SDK Guide for details.
Select the group or the device in the navigator for which to create a dashboard.
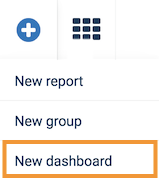
Click the Plus button in the top bar and from the context menu select New dashboard.
The dashboard editor opens.
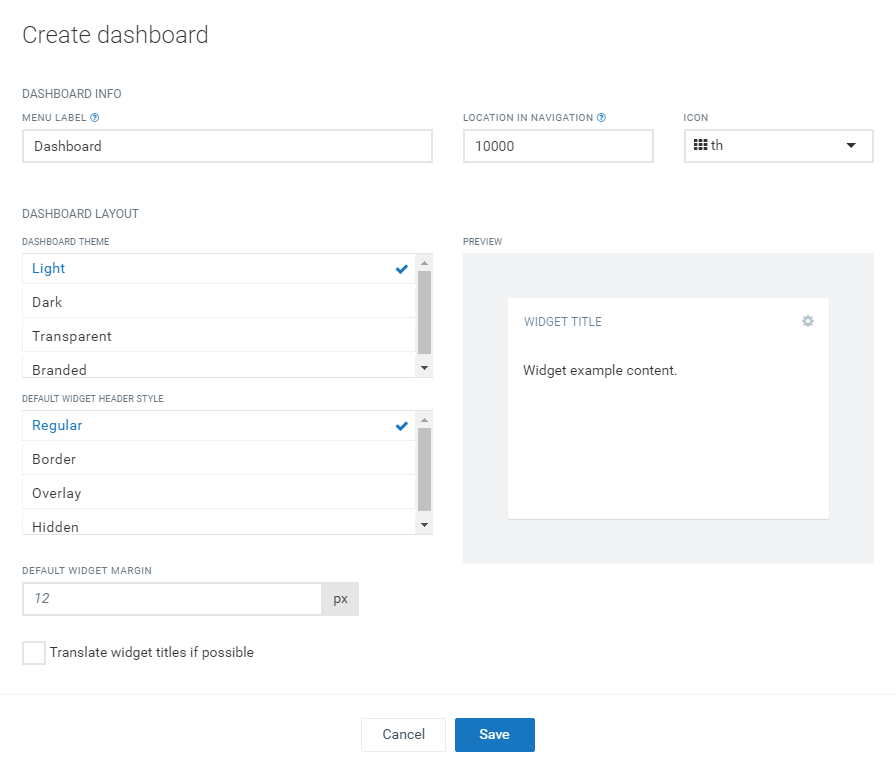
In the Dashboard info section of the dashboard editor, provide the following information:
In the Dashboard layout section you can select a theme for the dashboard (one of “Light”, “Dark”, “Transparent” or “Branded”) and a default header style for the widgets (one of “Regular”, “Border”, “Overlay”, or “Hidden”). Moreover, you can change the default widget margin (default value is 15 px).
Additionally, you can enable the option “Translate widget titles if possible”. If enabled, the widget title will be translated every time the language is changed.
Info: The widget titles will be translated only if a valid translation is available.
A preview of the selected layout settings is immediately displayed in the “Preview” section at the right to visualize your selections.
Click Save to create and open the dashboard.
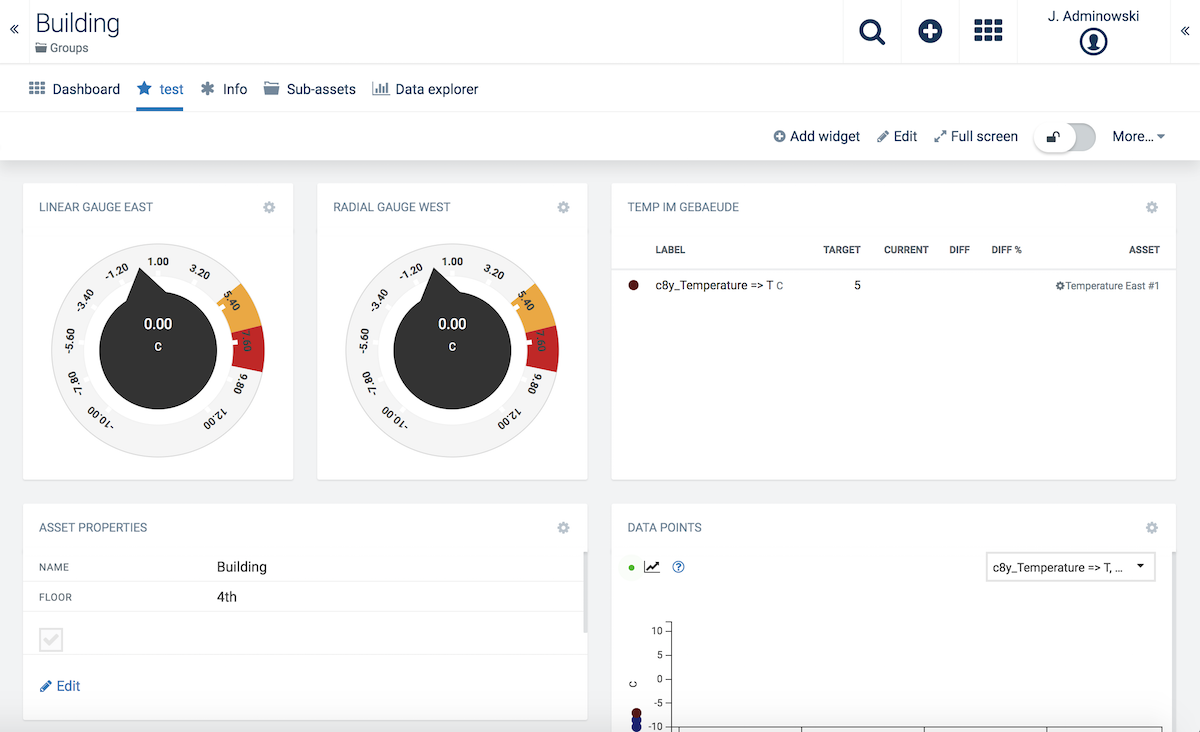
Since there will be no widgets on the dashboard yet, you will see an Add Widget button instead.
To add a widget to a dashboard, click the Add widget button (in case of an empty dashboard) or click Add widget in the top menu bar.

In the upcoming dialog, select a widget type from the dropdown list. Depending on the widget type selected, additional fields and checkboxes will be displayed to be filled in or selected. For details on all widgets refer to Widgets Collection.
Click Customize widget style to customize the content and header style for the widget individually, in the same way as specifying the general layout of the dashboard editor.
Click Save to add the widget to the dashboard.
Widgets may be rearranged on the dashboard. By dragging and dropping you can move the widget to another position.
By dragging the arrows on the bottom right corner of a widget, you can resize it.
To edit the properties of a widget on a dashboard, click the cogwheel icon at the top right corner of the widget and from the context menu select Edit.
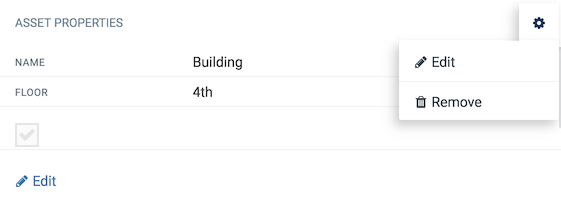
To delete a widget from a dashboard, click the cogwheel icon at the top right corner of the widget and from the context menu select Remove.
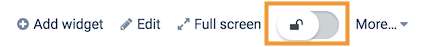
Widgets can only be modified, if the dashboard is unlocked. To lock/unlock a dashboard, use the slider with the lock icon on the top menu bar.
Info: On touch devices like smartphones or tablets some functions may not be supported.
You can create a dashboard for a specific device and share it with all devices of the same type. This is only possible though, if the type property is set for the device.
To do so, select the option Apply dashboard to all devices of type [TYPE] ([TYPE] is replaced with the type of the device that is currently selected).
A corresponding message will be displayed in the editor.
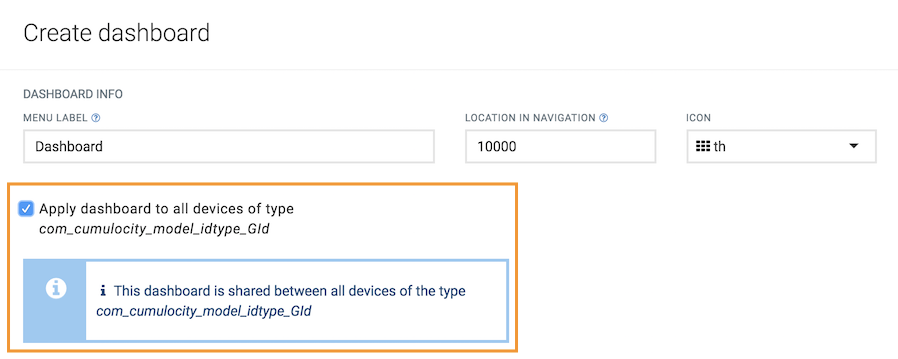
Changes made to this dashboard are automatically applied to all dashboard instances.
Info: You can only add widgets and data to the dashboard for the device itself. It is not possible to add data from child devices because the structure of these devices might be different from device to device.
To edit a dashboard, click Edit in the top menu bar.
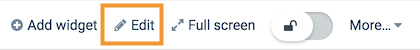
The dashboard editor will open up. For details on the fields, refer to Creating dashboards.
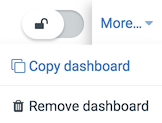
To copy a dashboard from one object to another, click More… in the top menu bar and from the context menu select Copy dashboard.
Next, navigate to the object you want to copy the dashboard to and from the context menu select Paste dashboard [NAME] to insert the dashboard.
An alternative way to copy a dashboard is to use the “dashboard per type” approach. With the “dashboard per type” approach you share the dashboard from one object with all objects of the same type.
To remove a dashboard from an object, click More… in the top menu bar and from the context menu select Remove dashboard.
The Cockpit application includes preset widget types. Each widget type provides different parameters to configure and different data to be displayed.
The following section describes, in alphabetical order, each available widget type and its configuration properties.
The “Alarm list” widget shows a list of alarms, filtered by objects, alarm severity and alarm status. For details on the information provided for each alarm, refer to Working with alarms in the Device Management section.
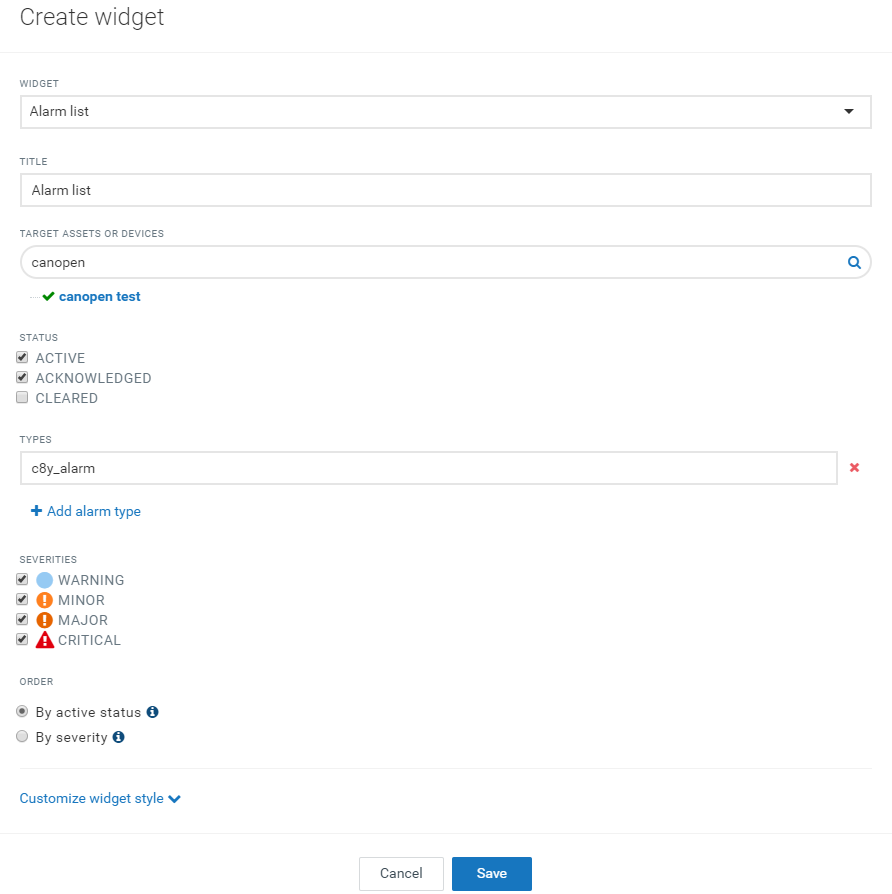
Parameters to configure
| Field | Description |
|---|---|
| Title | Widget title. By default, the widget type is used as title. |
| Target assets or devices | Select groups or devices, optional HTML expressions which should be evaluated. |
| Status | Only show devices with alarms of of the selected alarm status. |
| Type | Only show alarms of the specified type(s). Details can be seen when clicking once on an alarm. |
| Severities | Only show alarms of the selected alarm severity. |
| Order | Alarms may be ordered by the active status (followed by severity and time, the default) or the severity (followed by time). |
The “All critical alarms” widget shows all objects with a critical alarm. Apart from the title, there are no additional parameters to be configured.
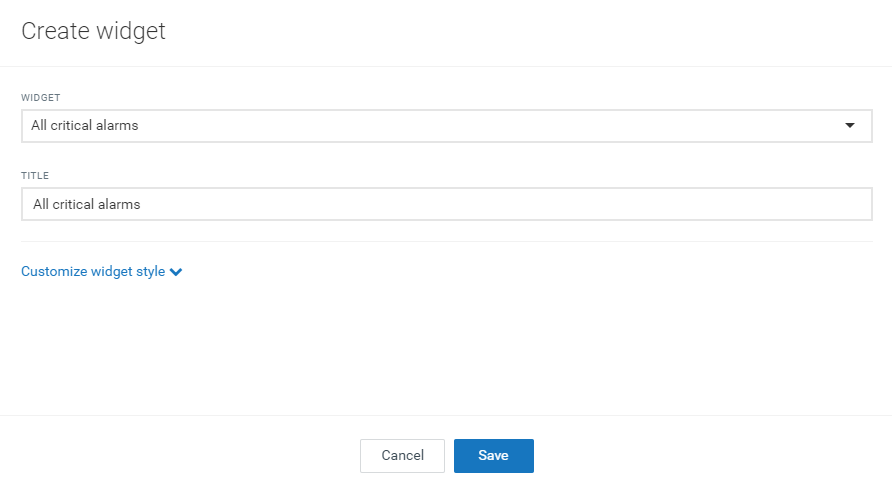
For details on alarms, refer to Device Management > Working with alarms.
The “Applications” widget shows a list of links to all available applications. Apart from the title, there are no additional parameters to be configured.
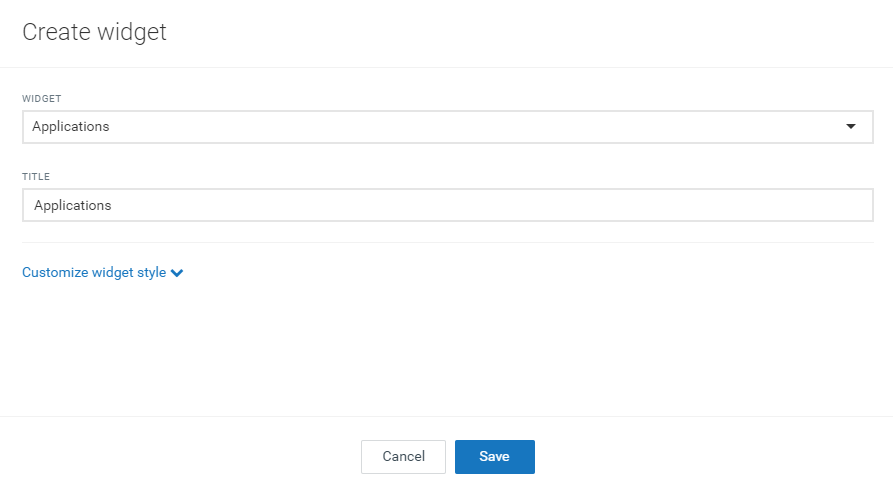
For details on applications, refer to Administration > Managing Applications.
The “Asset notes” widget displays messages provided by the administrative user to all owners of the current widget.
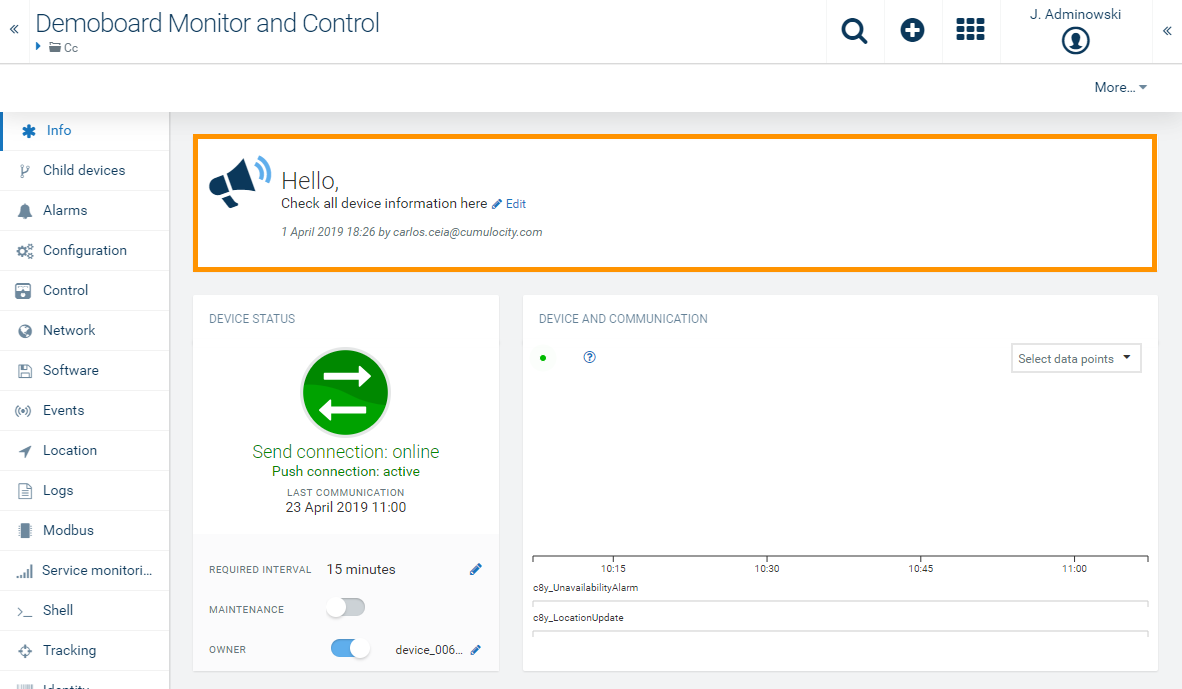
Only users with the permission to edit the home dashboard will be able to provide this message.
The “Asset properties” widget displays a user-defined list of attributes of the current object. The current object can be a device or a group.
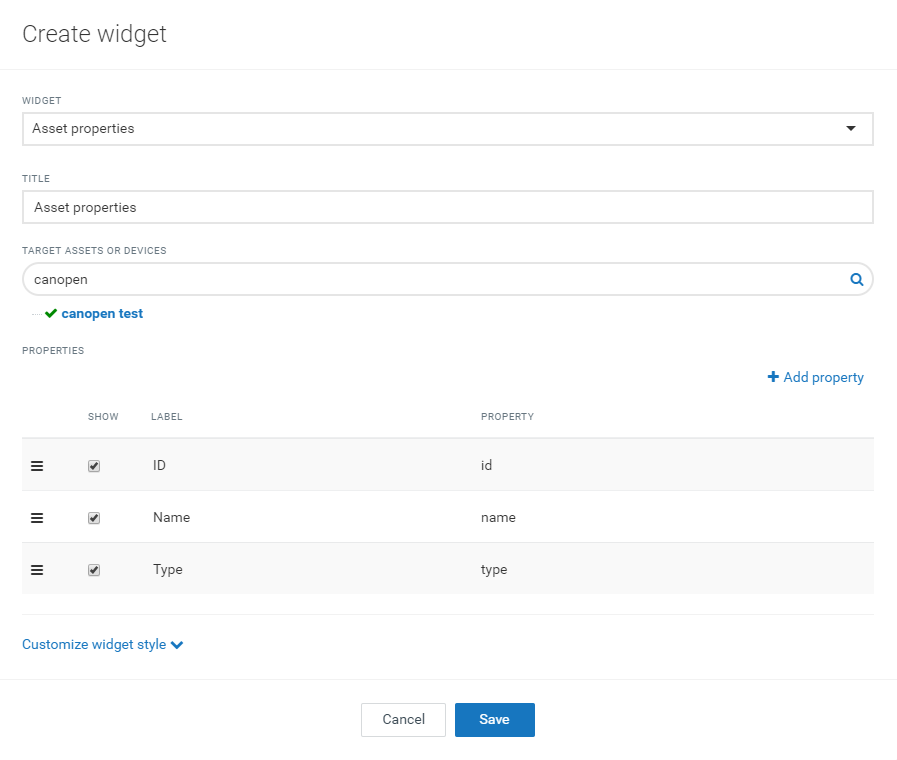
Parameters to configure
| Field | Description |
|---|---|
| Title | Widget title. By default, the widget type is used as title. |
| Target assets or devices | Select groups or devices. |
| Properties | List of properties, see Widget “Asset table”. |
Info: In the view mode, this widget only displays the properties which are not empty.
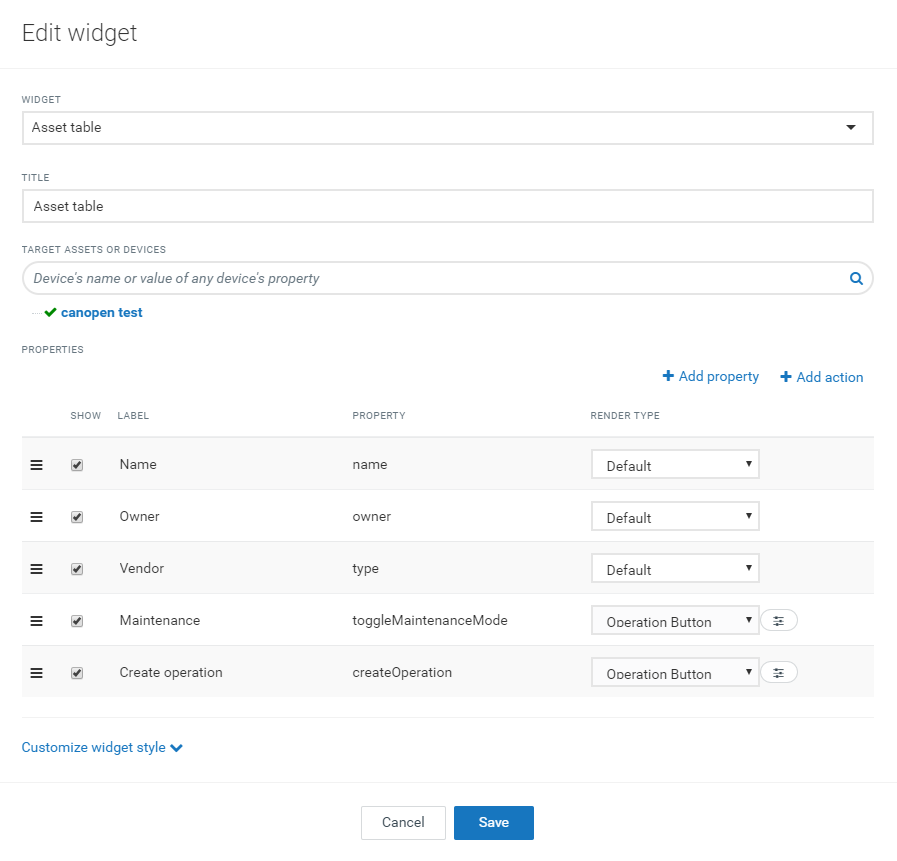
The “Asset table” widget shows details of all child devices in a table. This is a very powerful widget, allowing to arrange selected properties of objects in a table.
Parameters to configure
| Field | Description |
|---|---|
| Title | Widget title. By default, the widget type is simply used as title. |
| Target assets or devices | Select for which object all child devices should be shown. This is typically a group object. |
| Properties | Select properties or actions of an object to visualize them as columns in the table. |
Example
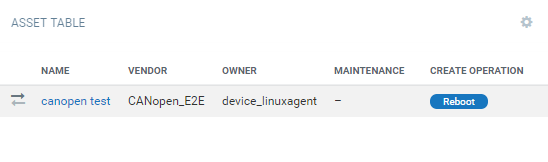
In the following screenshot, five columns are configured. Three property columns “Meter”, “Vendor”, and “Owner”, which refer to the properties “name”, type” and “owner” respectively. Additionally, there are two actions, one for toggling the maintenance mode, and one for rebooting the device.
The resulting table is visualized as follows:
Click +Add Properties and select one or more properties to be added.
Info: The property “Active alarm status” shows active alarms as icons in the table. If you select this property, you also need to configure the renderer “Active Alarm Status” in the list of columns.
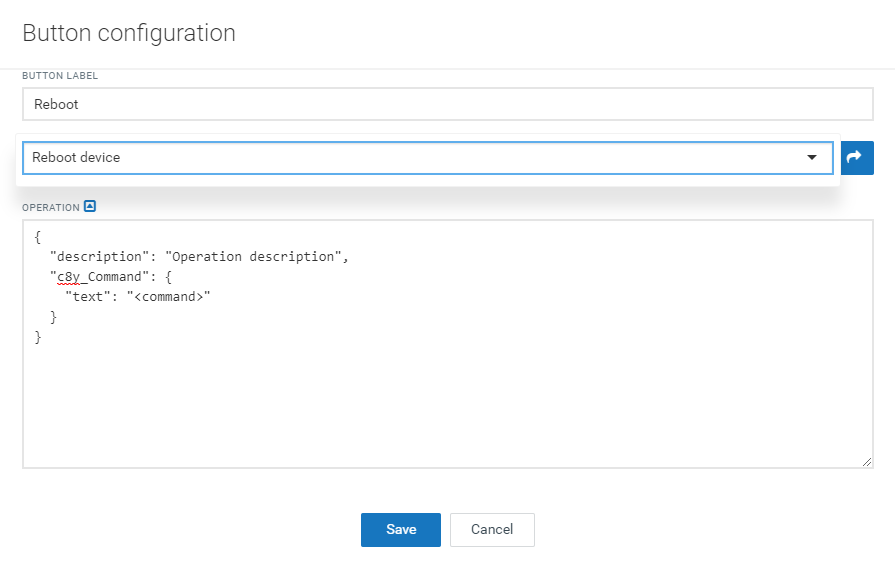
Info: The dialog shows the predefined shell commands of the first device that supports shell commands. The list is empty if there is no such device. For more details, refer to shell commands.
You can also enter the JSON format for the operation that will be sent to the device. For details, contact the device vendor for supported operations.
To edit the header of a column, click on its value in the “Label” column and edit the label.
You can rearrange the columns by clicking the icon at the very left of a row and dragging and dropping the entry.
To remove a property or an action, hover over the respective row and click Delete at the right.
The “Data point graph” widget shows a data point (measurement) in a graph. The visualization is the same as in the data explorer.
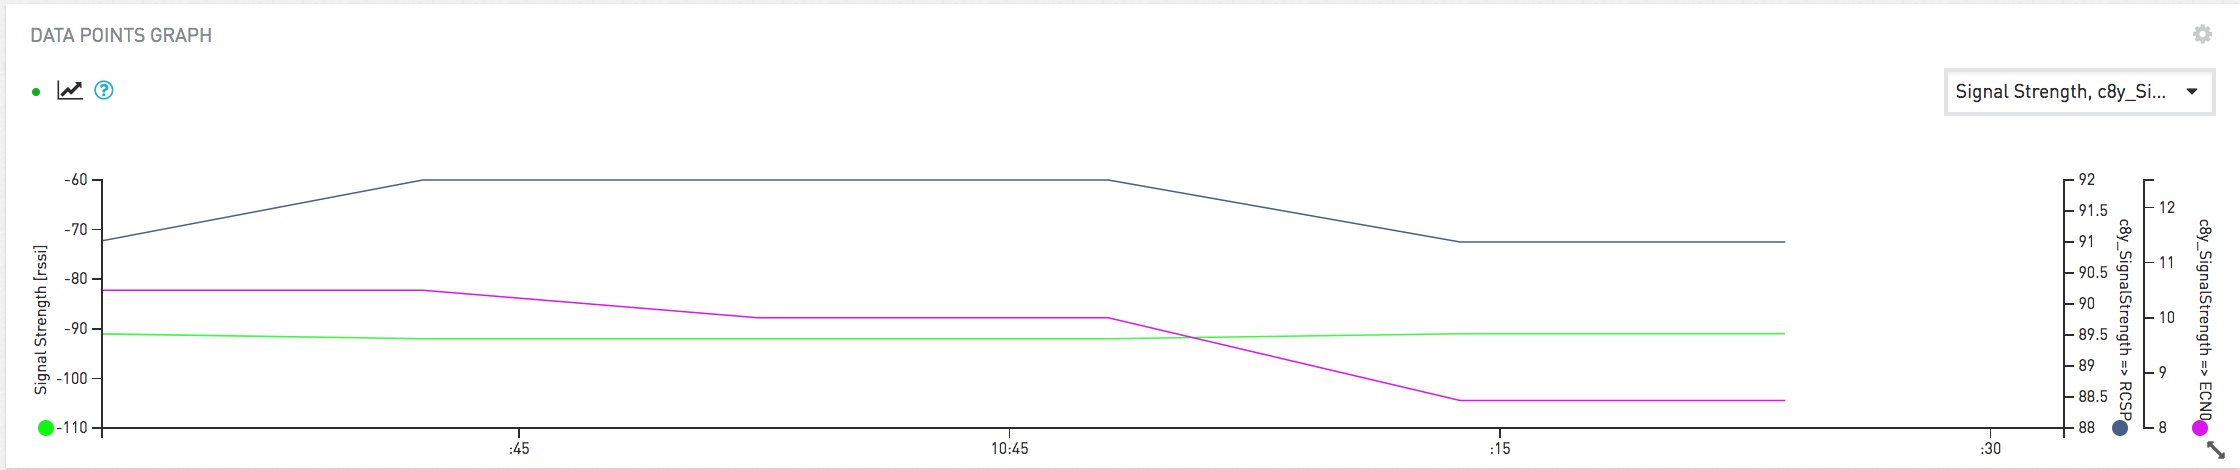
The easiest way to create a “Data point graph” widget is to navigate to the data explorer, click the More… button in the top menu bar and select Send as widget to dashboard.
Refer to Visualizing data using the data explorer for further details on the parameters to be configured.
The “Data point list” widget shows data points (measurements), one in each row, with current values and data point properties.
Parameters to configure
| Field | Description |
|---|---|
| Title | Widget title. By default, the widget type is simply used as title. |
| Data point | Shows a list of available data points. You must enable at least one data point. Click Add data point to add a data point to the list. For details on how to add data points see Adding data points. |
| Column visibility | Select which columns should be visible: Label: Label of the data point. See Visualizing data using the data explorer for details. Target: Target value. Can be configured in the data explorer or Data Point Library. Current: Current value. Diff: Absolute difference between current value and target value. Diff %: Percentage of difference between current value and target value. Asset: Name of the device or group of the data point. |
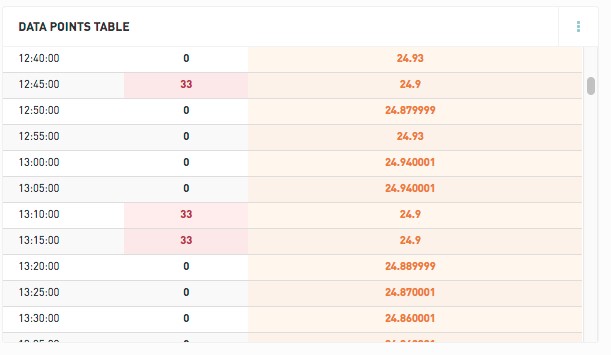
The “Data point table” widget configuration is similar to the “Data point graph” widget, but instead of visualizing the data as a line-chart, data is visualized as a table.
The “Data point table” widget displays data based on selected data points, time interval and aggregation.
Out of range values, based on configured yellow and red ranges, are highlighted in the table.
The “Event list” widget lets you monitor events for a selected device.
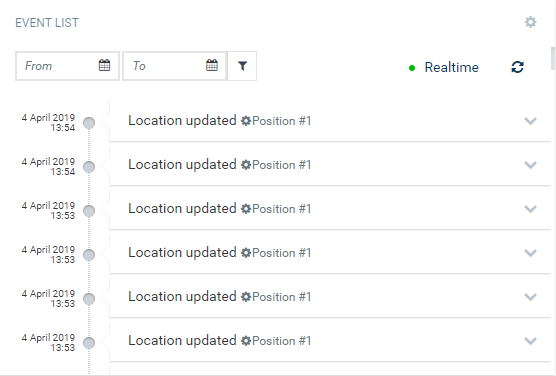
Additionally, a specific date range can be set and the events can be monitored in realtime.
The “Fieldbus device” widget lets you see the status of a modbus device and operate it.
For details on the “Fieldbus device” widget, refer to Optional Services > Cloud Fieldbus > Monitoring device status using the Fieldbus device widget.
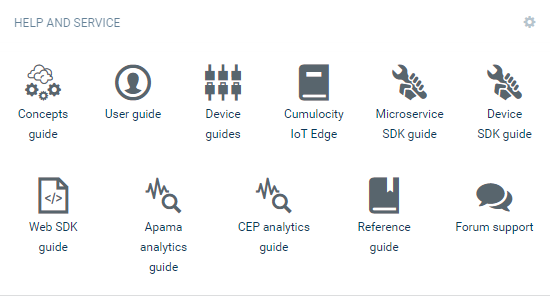
The “Help and service” widget displays links to help and service resources. There are no additional parameters to be configured.
The “Image” widget lets you display a single image to be selected from your computer by browsing. There are no additional parameters to be configured.
The “Info gauge” widget visualizes one data point in form of a radial gauge and multiple data points as labels.
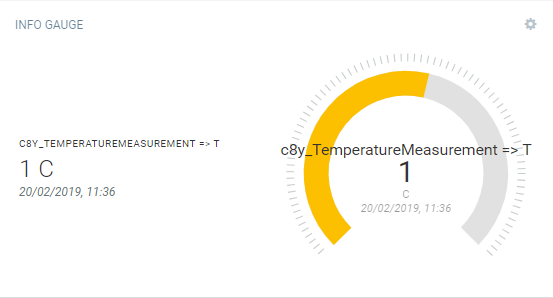
You can select one data point for the gauge, and multiple data points shown with labels on the left side.
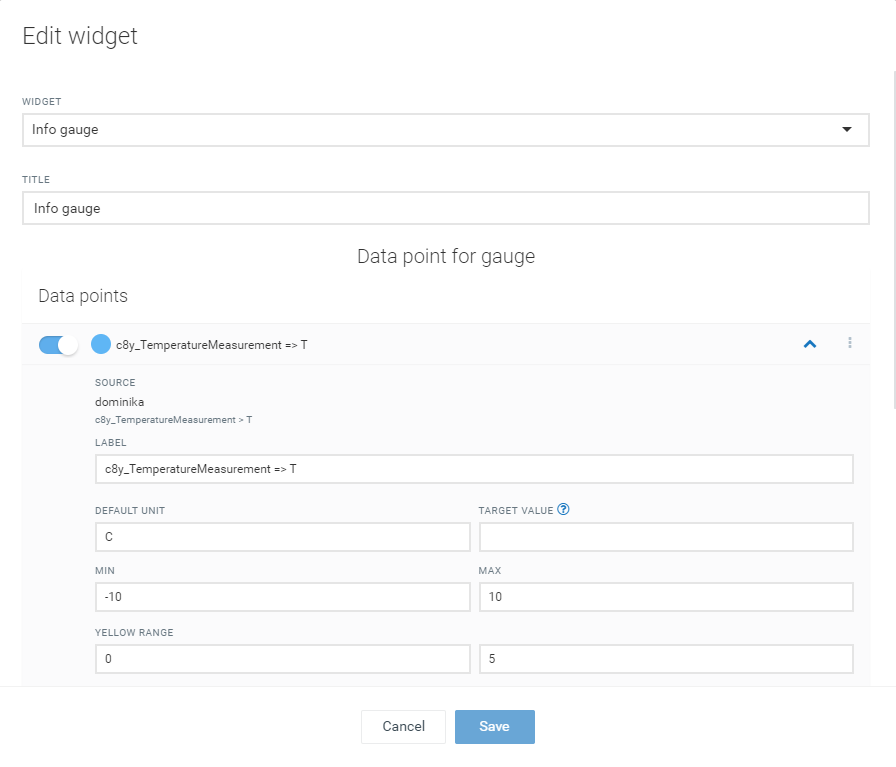
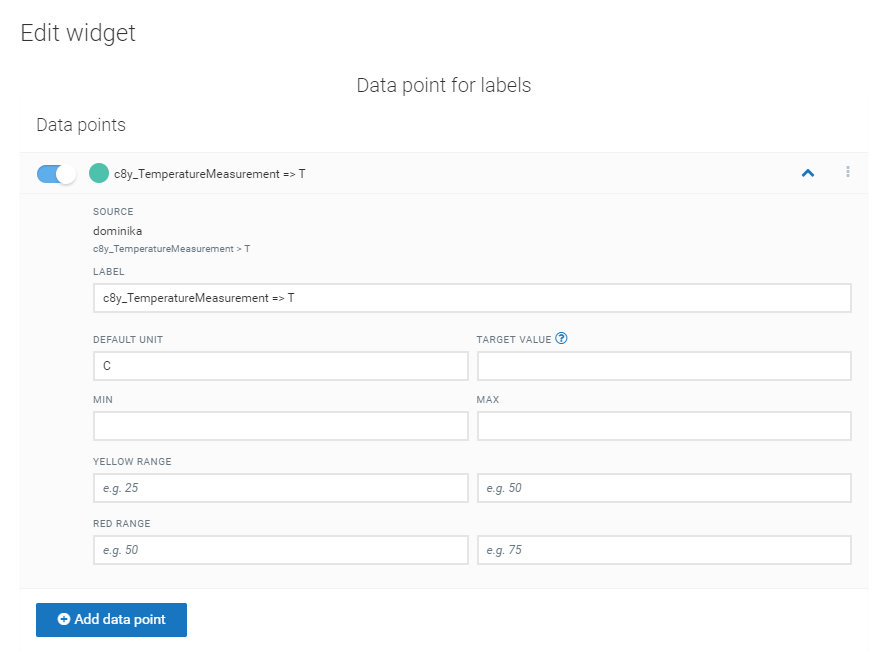
You must enable at least one data point in each section to create the “Info gauge” widget.
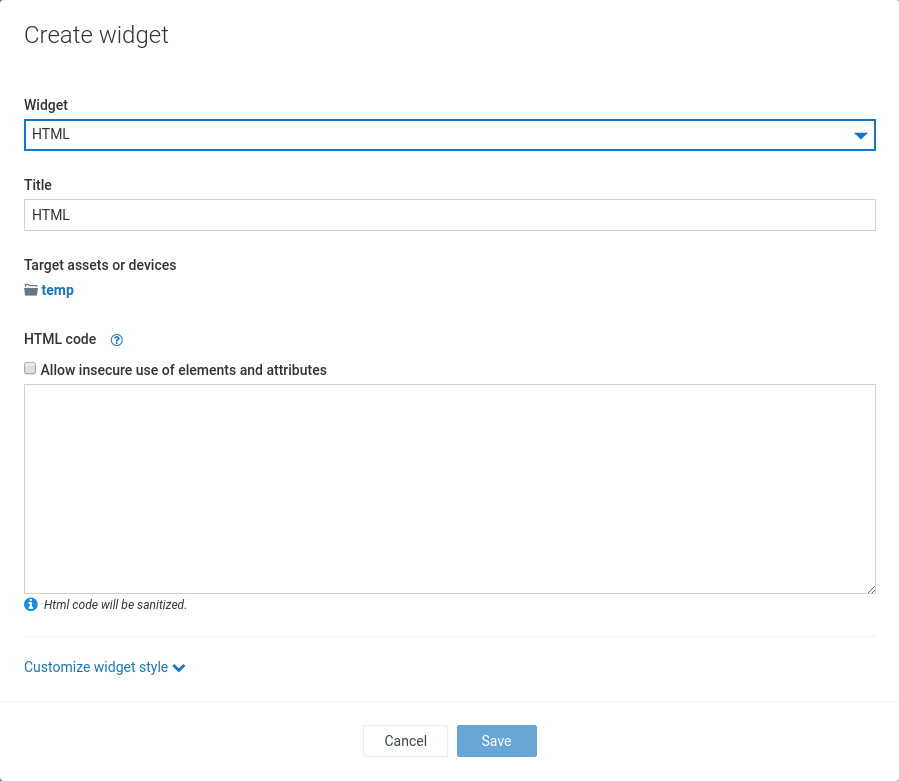
The “HTML” widget shows user-defined content. The content can be formatted using HTML.
Parameters to configure
Target assets or devices: Select the objects for which optional HTML expressions are evaluated.
HTML code
The following variables can be used inside the HTML content:
{{devicesCount}}: Total number of devices.
{{usersCount}}: Total number of users.
{{deviceGroupsCount}}: Total number of groups.
{{device.name}}: The name of the device.
{{device.property}}: More general form of the above. You can address any property of the device.
{{device.c8y_Hardware.model}}: The model of the device.
{{device.fragment.property}}: More general form of the above. You can address any property of any fragment of the device.
“Device” refers to the target device, as selected in the widget configuration parameter.
“fragment.property” refers to the properties of the respective device. To see the available property names, you can use the “Asset property” or “Asset table” widget and click +Add property in the widget configuration. This will show a table of supported properties. You can copy and paste the values from the column “Property”. Generated properties of these widgets are not available in the HTML widgets.
The “Linear gauge” widget visualizes data points in form of a linear gauge. Min and max target values are shown on the gauge as well.
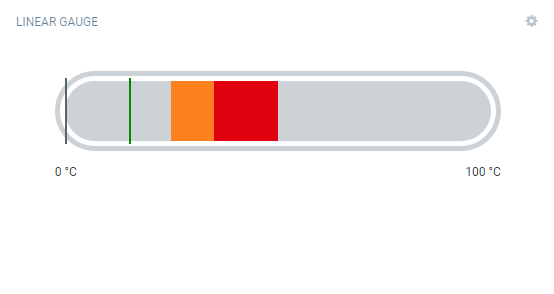
Info: If a label is not properly readable, you can help yourself by increasing the min and max value of the data point to move the label into the readable range.
You must enable at least one data point to create the “Linear gauge” widget.
The “Map” widget shows the location of a device or all devices of a group.
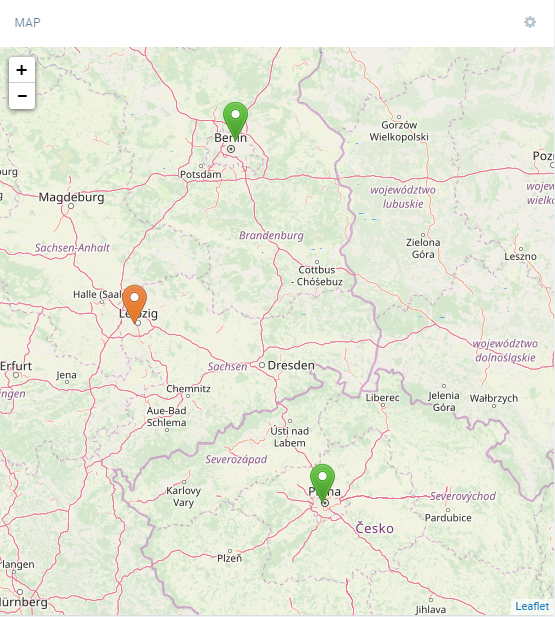
You can drag the map and move its content, and you can zoom in and out by using the Plus and Minus buttons.
The icons representing the devices are color-coded. The color used follows these rules:
Click a device icon, to open popup with the following information:
Parameters to configure
Target assets or devices: Select which devices are shown on the map. If a group is selected, all devices in that group (but not in any subgroups) are visible.
Info: If none of the target device(s) has a known location, then the widget shows a world map without icons.
The “Message sending” widget sends a message to a device. The behavior of the device itself is device-dependent. Only available for devices that support this type of operation.
The “Pie chart” widget displays data points (measurements) with current values in a pie chart presentation.
Parameters to configure
| Field | Description |
|---|---|
| Title | Widget title. By default, the widget type is simply used as title. |
| Pie chart options | Select from the options to show tooltips, percentages, legends in the pie chart. |
| Data point | Shows a list of available data points. You must enable at least one data point. Click Add data point to add a data point to the list. For details on how to add data points see Adding data points. |
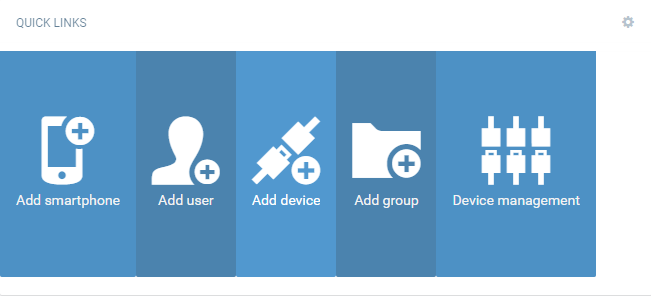
The “Quick links” widget displays several quick links to relevant operations. There are no additional parameters to be configured.
The “Radial gauge” widget visualizes data points in form of a radial gauge.
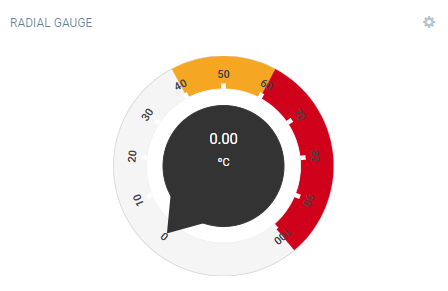
You must enable at least one data point to create the “Radial gauge” widget.
The “Recent alarms” widget shows all alarms of all severity sorted by time. There are no additional parameters to be configured.
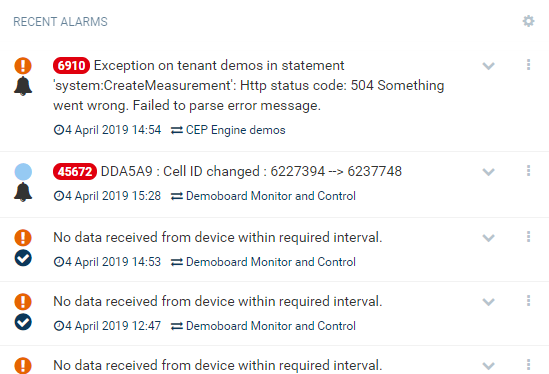
For details on alarms, refer to Device Management > Working with alarms.
The “Relay array control” widget lets you switch relays on or off independently in an array of relays. Only available for devices that support this type of operation.
The “Relay control” widget allows you to switch a device relay on or off. Only available for devices that support this type of operation.
The “Rotation” widget lets you render an object model of a device.
Parameters to configure
| Field | Description |
|---|---|
| Title | Widget title. By default, the widget type is simply used as title. |
| Target assets or devices | Select group or device to be displayed. |
| Object model for rendering | Select an object model type for rendering. May be one of “Box model” or “Phone model”. |
| Wireframe | Turn “Wireframe” on or off (default = on). The “wireframe” mode displays the object in a skeletal representation. |
| Camera type | Select the type of camera to be used. May be one of “Orthographic camera” or “Perspective camera”. |
In the “Rotation” widget you can rotate the object by dragging and moving it around. Zoom in and out by using the mouse.
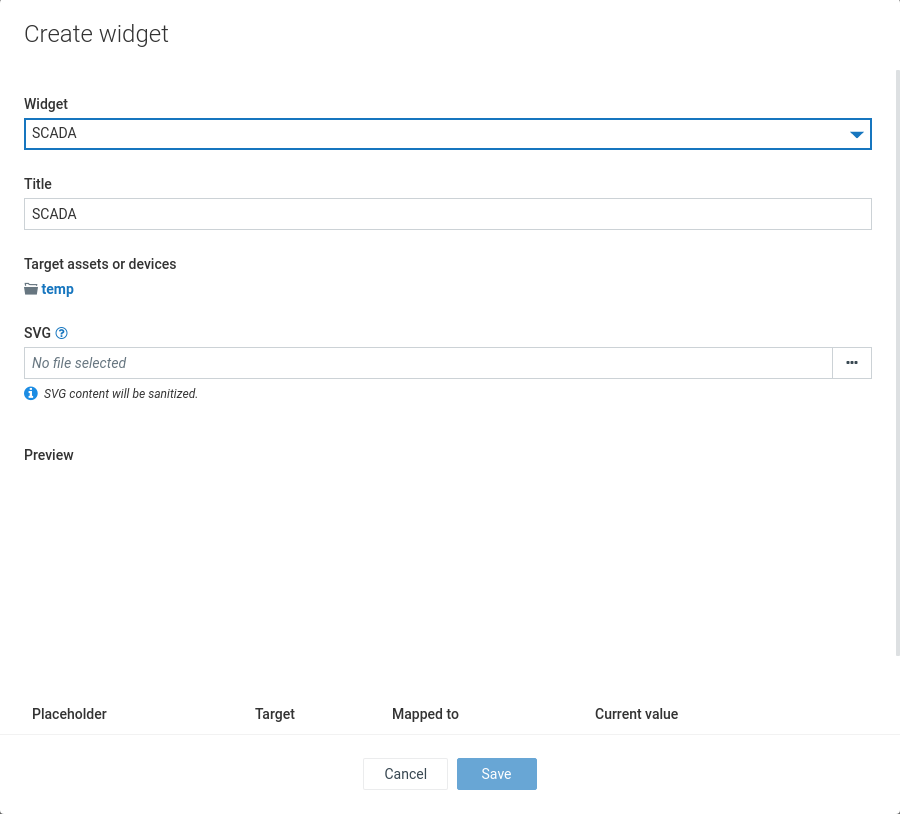
The “SCADA” widget provides a graphic representation of the status of a device.
For details on the “SCADA” widget, refer to Optional Services > Cloud Fieldbus > Monitoring status using the SCADA widget.
Info: All “svg” files are sanitized in order to remove malicious code.
The “Silo” widget displays data points (measurements) with current values in a silo presentation.
Parameters to configure
| Field | Description |
|---|---|
| Title | Widget title. By default, the widget type is simply used as title. |
| Data point | Shows a list of available data points. You must enable at least one data point. Click Add data point to add a data point to the list. For details on how to add data points see Adding data points. |
The “Traffic light” widget visualizes the states of a device as traffic light.
Parameters to configure
| Field | Description |
|---|---|
| Title | Widget title. By default, the widget type is simply used as title. |
| Target assets or devices | Select group or device to be displayed. |
| States mapping | Select a property for each light. The value of the property has to be one of the following to have the respective light on: true, 1, any non-empty string, any non-null number. |
The “Twitter news” widget displays tweets from Twitter’s embedded timeline widget.

Parameters to configure
| Field | Description |
|---|---|
| Title | Widget title. By default, the widget type is simply used as title. |
| Twitter’s username | User name for the Twitter account being displayed. |
| Twitter’s widget ID | ID for the Twitter widget. You can obtain the ID from widgets settings. |
| Options | Select if you want to display a header, footer, borders or transparency. |
Dashboard reports enable you to track applications, alarms, assets, events and many other widgets.
Dashboard reports are global dashboard pages, regardless of the asset hierarchy.
To see all existing reports, expand the Reports menu in the navigator.
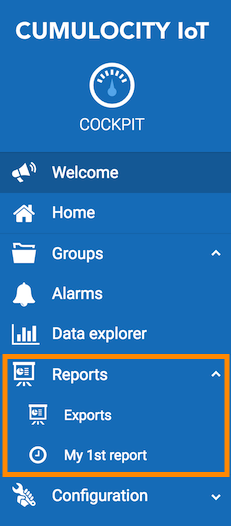
Click a report in the navigator to open it.
Next, widgets can be added to the report.
You can add widgets to reports in the same way as adding widgets to dashboards.
For details on all widgets types available, refer to Widgets collection.
The export functionality lets you export specific data to either CSV or Excel files.
With this feature, you can request data for the whole tenant. Additionally, you can choose to filter for specific devices, time ranges or fields. The export data contains information about all specified filters and enabled fields.
Info: The maximum number of documents that can be exported into a single file is 1 million. If the number of documents for defined filters exceeds this limit, only the first 1 million documents will be taken.
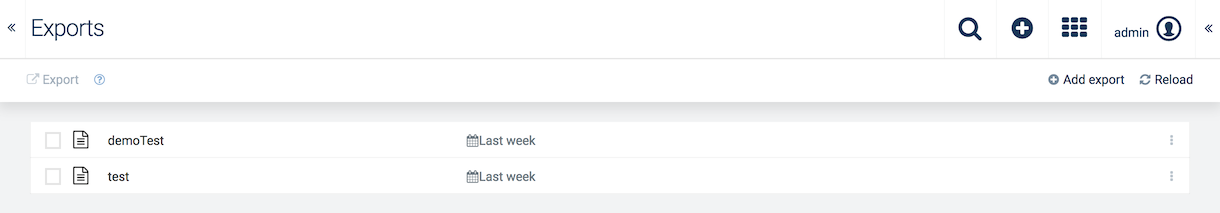
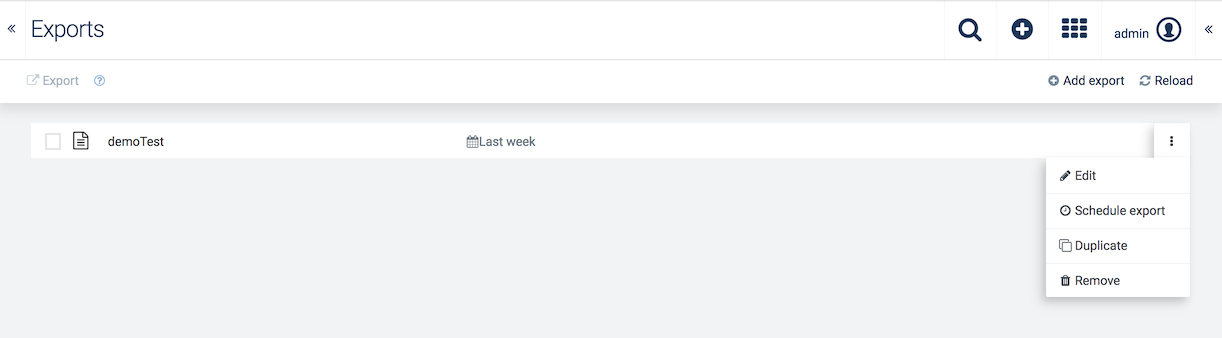
To show all exports, click Export in the Reports menu.
In the Export page you will find a list displaying all exports with their names and time range.
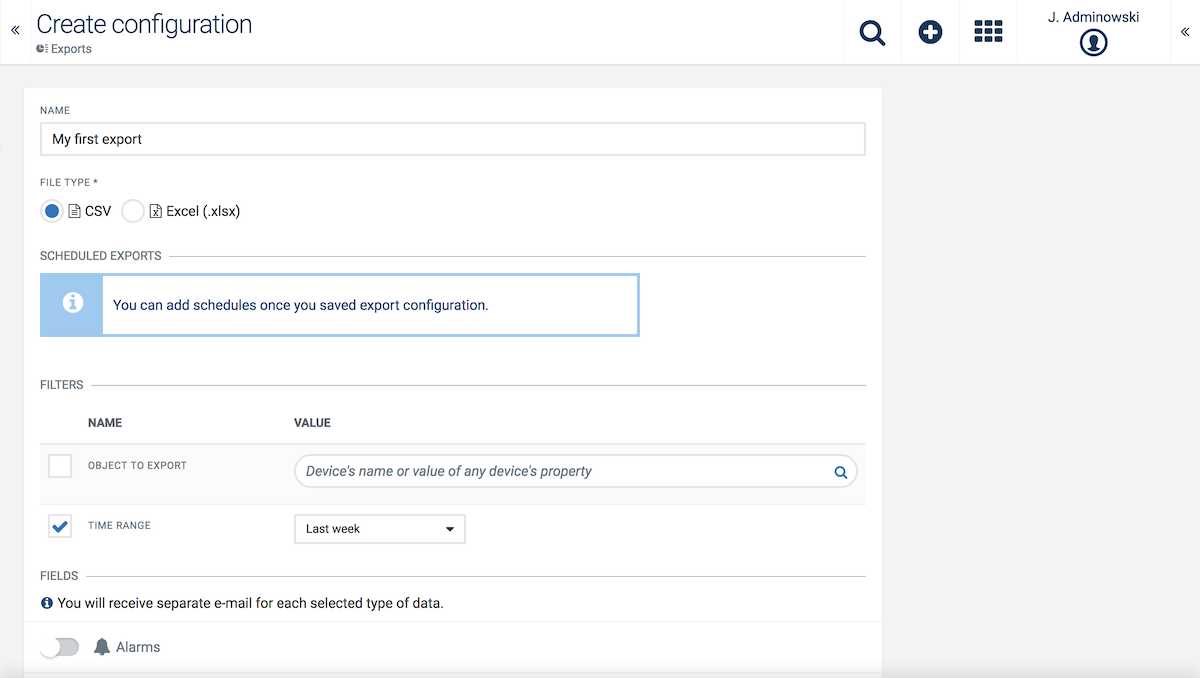
Filters
In the Filter section, you can select filters to request object- or time-specific data.
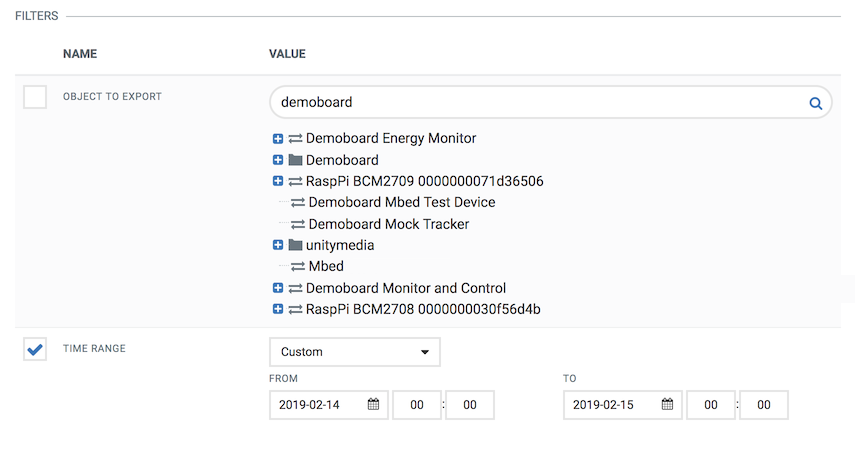
To filter for a particular object, enter a name or property value into the search field and click the search icon. All matching devices or groups will be displayed below the Value field. Click a device to select it (highlighted in green).
The Time range filter can filter data for a specific time range. Select a time range from the dropdown field. This may be one of “Last year”, “Last month”, “Last week” or select “Custom” and enter a custom from/to range in the additional fields.
Select the Object to export and Time range checkboxes to enable the respective filters.
Fields
Apart from object- and time-specific filtering you may filter data for specific fields:
Use the toggle to enable/disable a field.
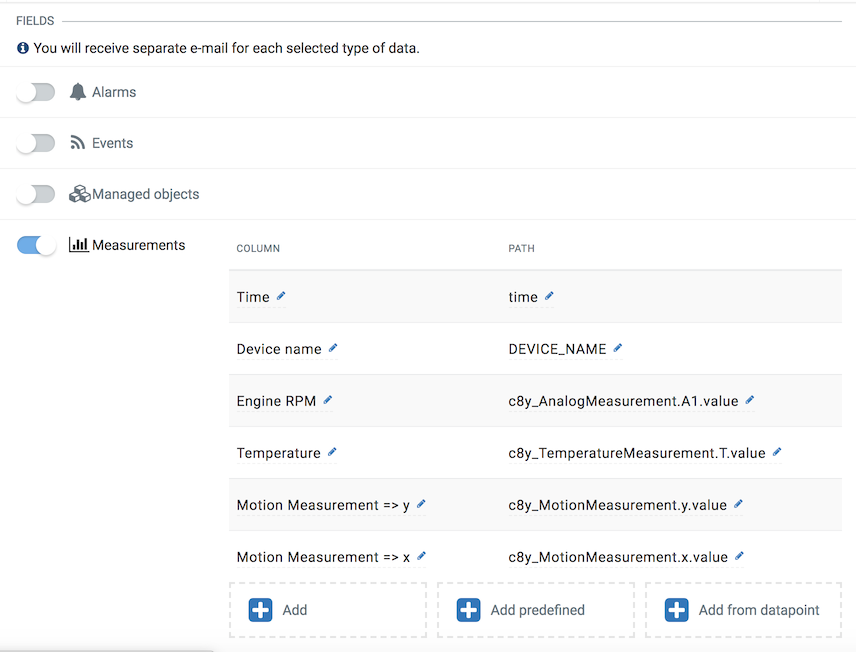
Info: The time range filter only applies to alarms, events and measurements but not to managed objects. If selected, managed objects will appear in the export, regardless of any specified time range.
When a field is enabled, predefined or empty properties can be added.
Click Add to add empty properties. To enter a label or path, click Column or Path and edit the field. For example, if you enable the Alarms field you could enter “Severity” in column and path to receive data for alarm severities.
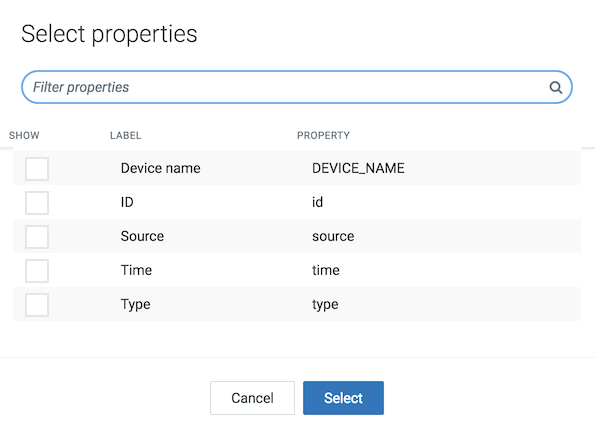
Click Add predefined, to add predefined properties. Simply select the desired properties from the list and click Select. Use the search field at the top to search for a specific property.
If you have at least one field that is not originating from the “Add predefined” list but defined as a custom property, then you need to set up at least one property for the custom values to appear in the export.
Example: An export has 4 fields defined: time range, device name, type and c8y_SpeedMeasurement.speed.value. The first 3 are predefined properties, while the last one is a custom property. If any measurement for export does not have a custom property c8y_SpeedMeasurement.speed.value, then it will not appear in the export file.
If your field is a valid.key.with.dot then refer to it as [‘fragment.key.with.dot’] in the path, e.g.: [‘fragment.key.with.dot’].series.value
In case of measurements enabled, you can also choose Add from data point. For details on how to add data points see Adding data points.
To schedule the export to a CSV or XLSX file to any point in time, click the menu icon at the end of the row and then click Schedule export.
In the resulting dialog box you can customize the Smart Rule “On timer send export via email” according to your needs.
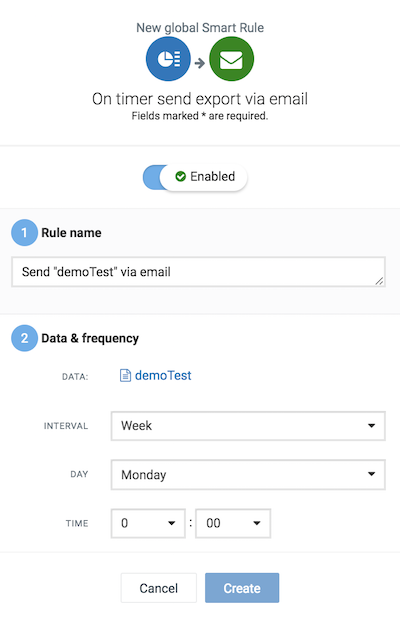
1 - Rule name
The rule name is pre-filled, providing the name of the export, but may be modified.
2 - Data & frequency
Define the frequency for sending the export, i.e. every hour, day, week, month or year. Depending on the frequency selected, provide additional timing information. For example, if you have selected “every month”, provide the day of month, hour and minute.
3 - Send email:
Complete the email information.
In the Send to field, provide the email address of the receiver. This field is mandatory. Optionally, you can provide email addresses for sending CC or BCC and add the email address of the sender for reply.
Specify the subject of the email. This field is pre-filled, but may be modified.
Enter the actual email message. Available placeholders are {host}, {binaryId}. The default value is “File with exported data can be downloaded from {host}/inventory/binaries/{binaryId}”.
Click Create to create the customized Smart Rule “On timer send export via email”.
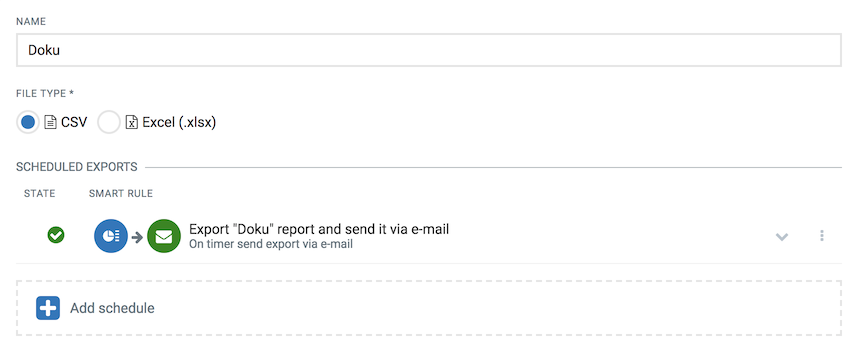
The Smart Rule will be added to the export details.
To export data to a CSV or XLSX file, select the checkbox in front of the export in the list and at the left of the top menu bar click Export.
You will receive an e-mail containing links to each export file.
Standard time properties of documents (like time or creationTime in alarms) are exported to
Only CSV time contains milliseconds and timezone.
Just click the respective row or click the menu icon at the end of the row and then click Edit.
For details on the fields see To add an export.
Click the menu icon at the end of the row and then click Remove.
The Data Point Library provides a collection of data points with default values for data point properties.
Data point properties are similar to “paragraph formats” in word processing applications: You do not want to format each paragraph individually. Instead you want to define a set of default formats and apply them to your paragraphs in your document.
The Data Point Library provides the same functionality for data points: It provides a number of default data point “templates” that can be applied easily to your data points from different devices.
How does the Cockpit application use the Data Point Library? To find the default visualization for a data point like color or label, Cockpit searches the Data Point Library and tries to find a matching entry. An entry is considered as “matching”, if the values for fragment and series in the Data Point Library match those of the measurement. If a matching entry is found, the corresponding data point properties are used for a default visualization.
Additionally, the properties of the Data Point Library are used by threshold business rules: The red and yellow values configured in the Data Point Library are used by the threshold rules to raise alarms.
To open the Data Point Library, click Data Point Library in the Configuration menu of the navigator.
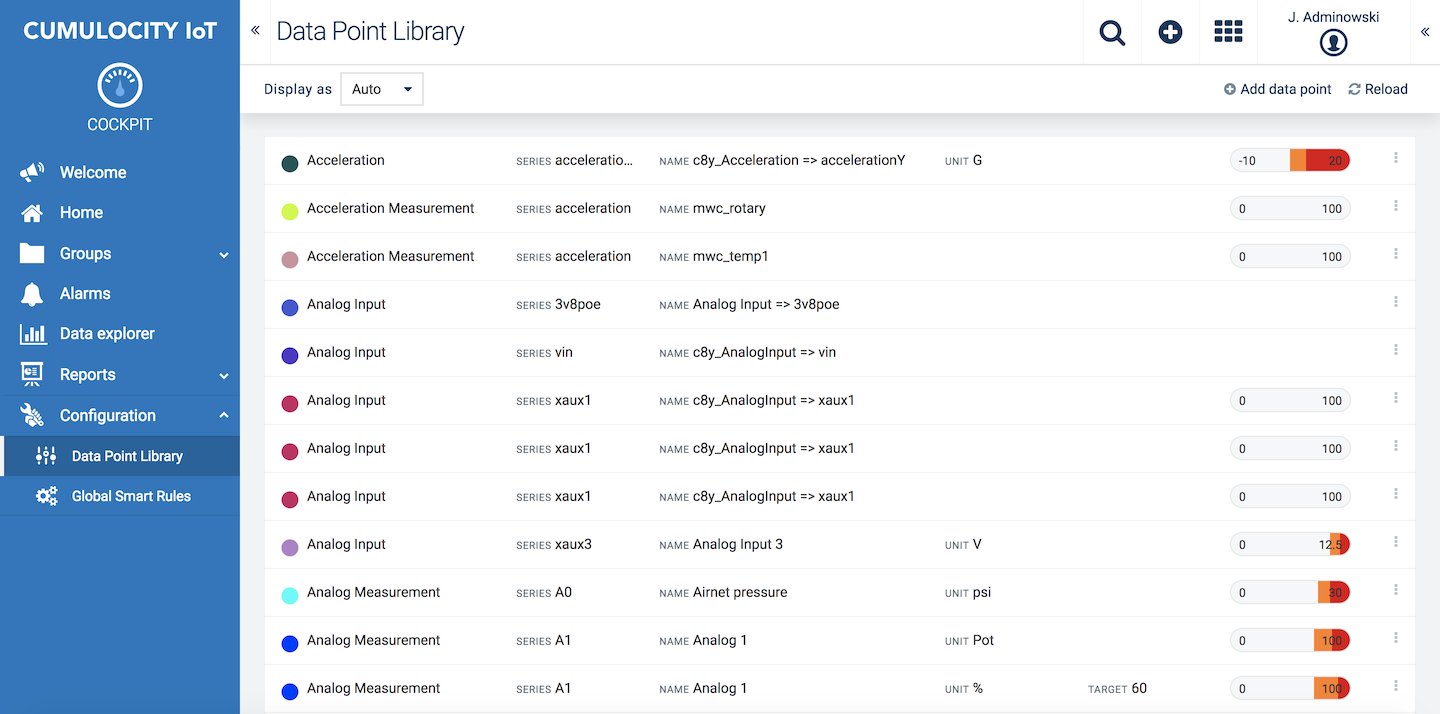
A list of available data points will be opened. For each data point, the following information is provided in the list:
Click Add data point in the top menu bar.
Provide the following information:
| Field | Description |
|---|---|
| Color | Color for the data point visualization |
| Label | Label to identify the data point |
| Fragment | Name of the fragment |
| Series | Name of the series |
| Unit | Unit used for the measurement |
| Target | Target value |
| Minimum | Minimum value shown on the y-axis |
| Maximum | Minimum value shown on the y-axis |
| Yellow range | Min/max values for the yellow range (MINOR alarms) |
| Red range | Min/max values for the red range (CRITICAL alarms) |
Click Save to add the data point to the library.
Simply click the respective entry in the list or click the menu icon at the right of an entry and then click Edit.
Click the menu icon at the right of an entry and then click Remove.
Cumulocity includes a rule engine to analyze data in realtime and to perform actions based on data. These rules are specified in a scripting language and are managed in the Administration application.
To easily create rules, the Cockpit application includes a Smart Rules builder which allows you to create rules from templates (so-called smart rule templates).
Info: Smart Rules are only visible, if the tenant is subscribed to the Smartrule application. To manage Smart Rules, the user has to have CREATE permission for Inventory and either Smartrule permission or CEP management permission.
Smart Rules are parameterized. There are two sources for parameters:
Rule Parameters are provided by the user when creating a Smart Rule from a template. Examples are email addresses and alarm texts.
Object Parameters are stored in the group or device. These parameters can be edited after the Smart Rule has been created. An example includes min and max values for thresholds.
Smart Rules can be seen
in the Info tab of a device or group.
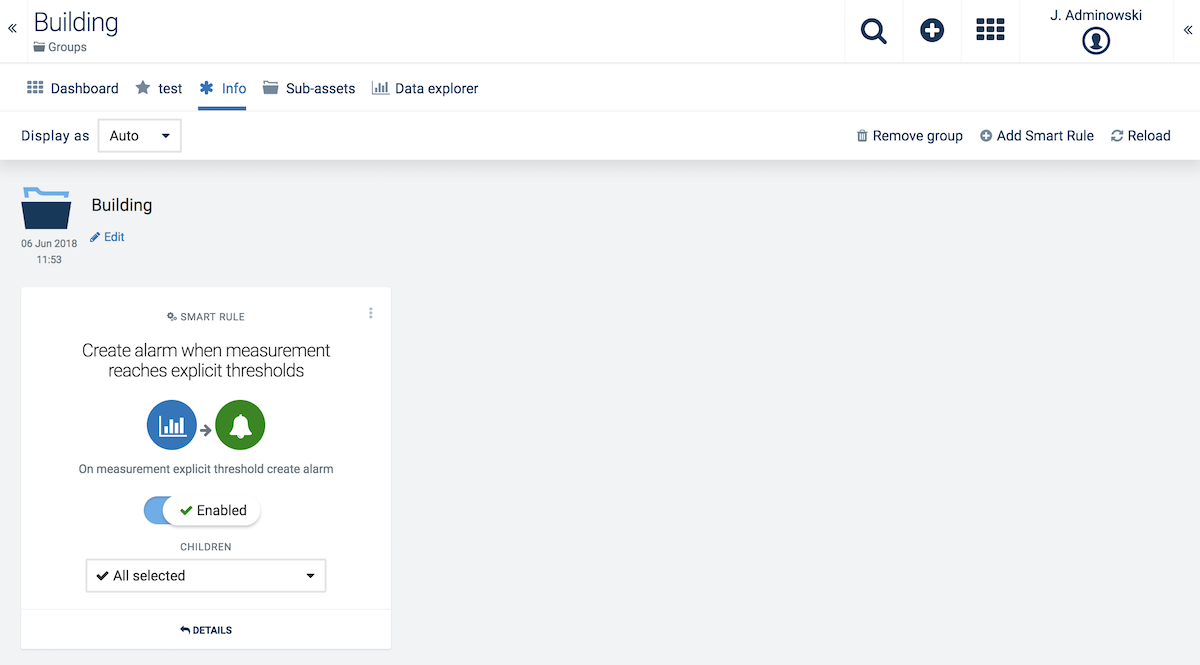
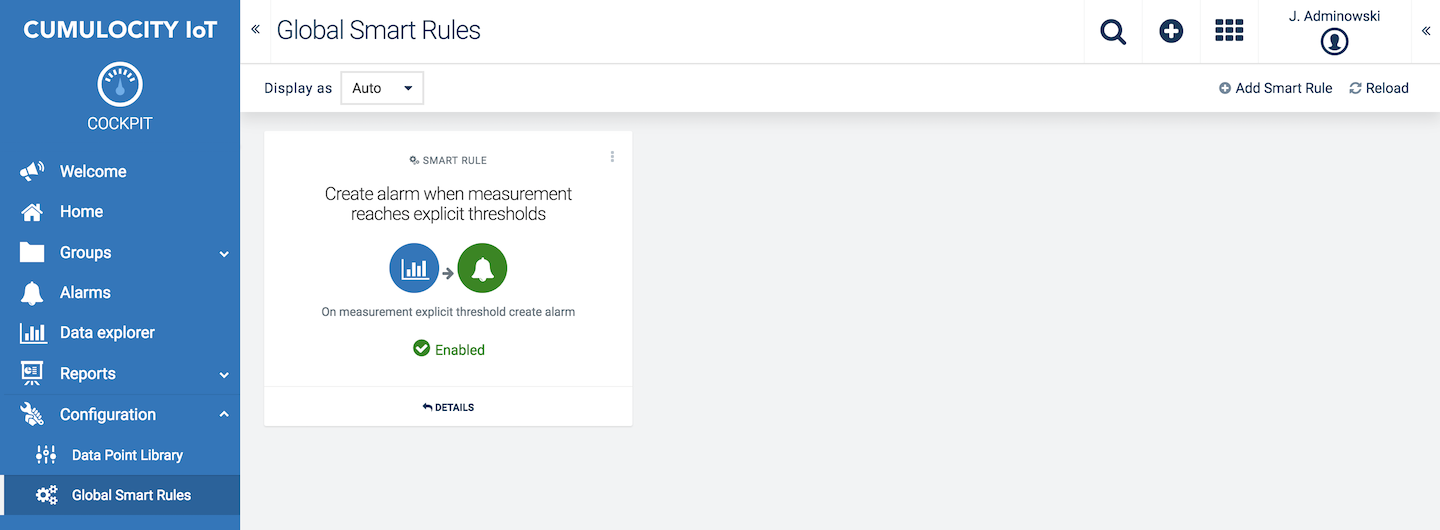
in the Smart Rules page accessible from the Configuration menu.
There are two different kinds of Smart Rules:
In the Smart Rules page, only the global Smart Rules are shown.
In a local context (group or device) and without the relevant permissions, only the local Smart Rules are shown. If the user has the relevant permissions, both local and global Smart Rules are shown. The permissions required in order to see the global Smart Rules are:
Smart Rules can both be created in the Global Smart Rules page, accessible from the Configuration menu in the navigator, or from the Info tab of any group or a device.
If the new rule has been set to “Enabled” and has not been activated for specific objects only, the rule will be active for all devices and groups. See next section on how to deactivate a smart rule for specific objects.
To avoid confusion, disabled Smart Rules are not displayed in group menus or device menus.
Smart Rules can be instantiated multiple times.
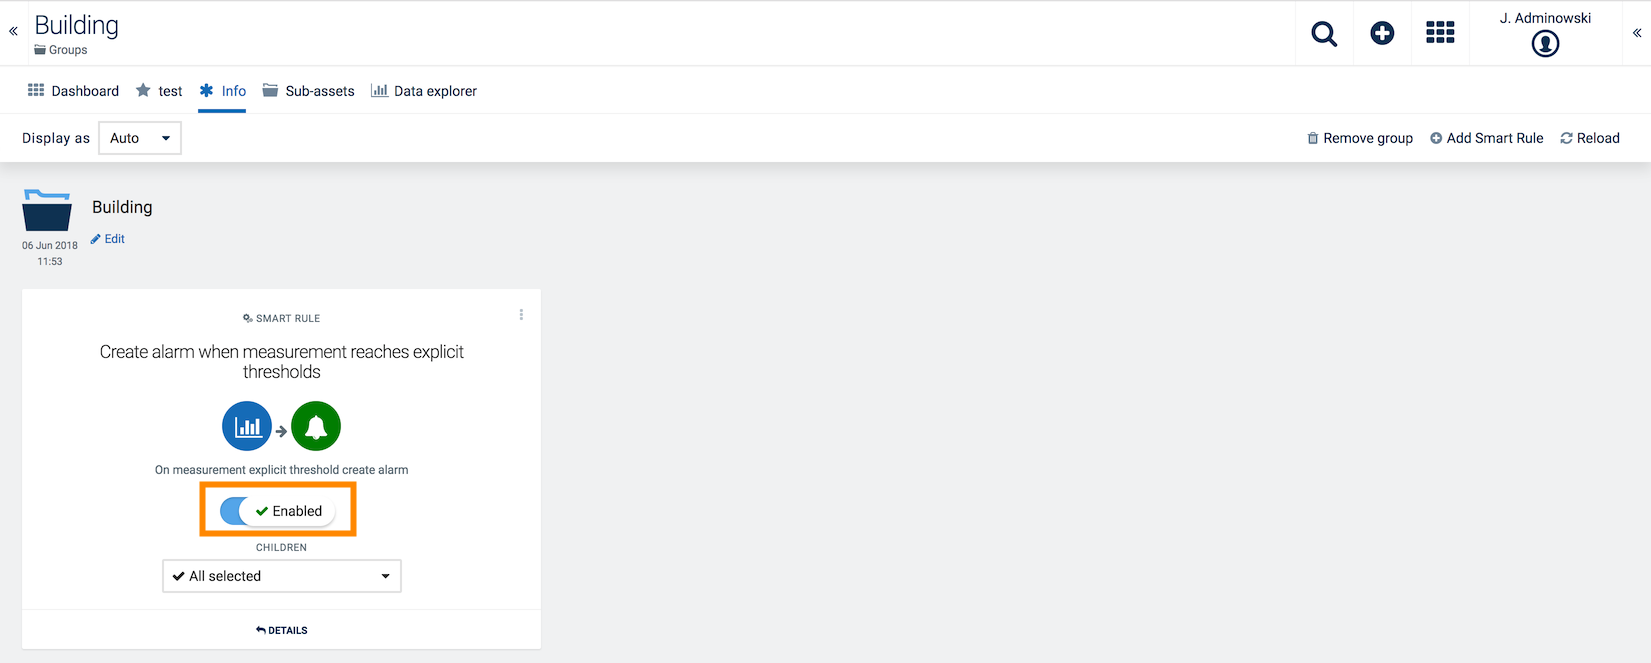
A Smart Rule can be activated (switched on) and deactivated (switched off) for a single object (group or device). For example, if a device is generating too many threshold alarms, you can deactivate the rule for this single object. The rule is still active for all other objects.
Navigate to the Info tab of the group or device and enable/disable the respective rule using the toggle.
Click the menu icon at the right of an entry and then click Edit.
For details on the fields see To create a Smart Rule.
Click the menu icon at the right of an entry and then click Remove.
For easier debugging, there is a direct link from a Smart Rule to the corresponding event processing module.
Click the menu icon at the right of an entry and then click Inspect to use this link.
To define a threshold rule follow these steps:
The rule will automatically be set to active and alarms appear if they arise.
Smart Rules can create a new data item on the platform. For example, the threshold rule creates new alarms. This new data can be handled further by selected Smart Rules, for example, by an “On alarm send e-mail” rule.
Using this mechanism, it is possible to create a chain of Smart Rules.
Info: If you create a rule chain keep in mind how much data will be created and avoid overload or excessive amount of data.
Cumulocity includes preset global Smart Rule types.
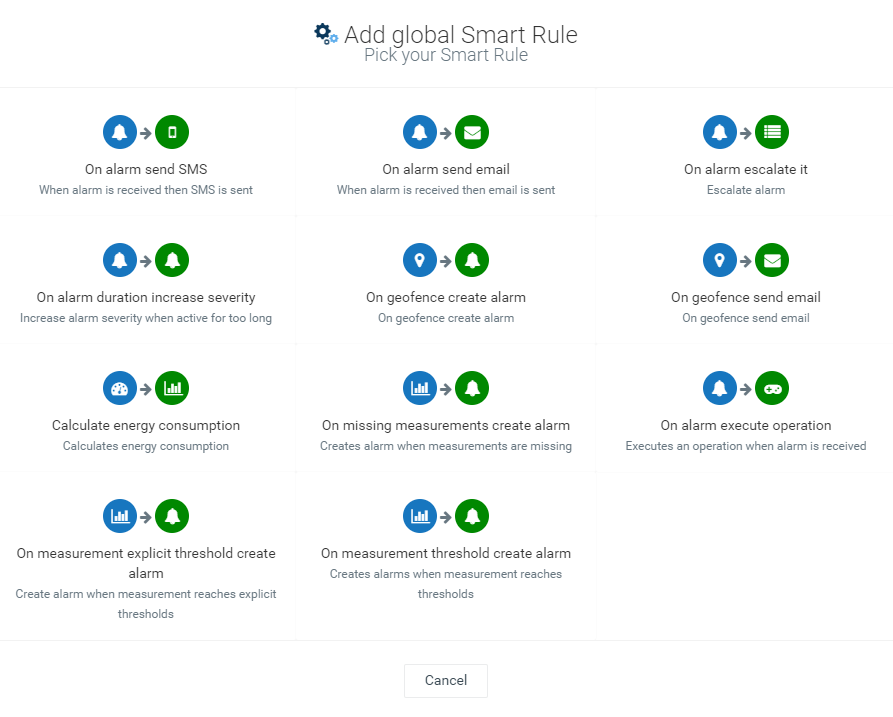
Each global Smart Rule type provides different parameters to configure.
The following section describes each available type and its configuration properties.
Functionality
When an alarm is created, a SMS is sent.
Info: This rule is only available if your tenant has a configured SMS provider.
Parameters
The rule uses the following parameters:
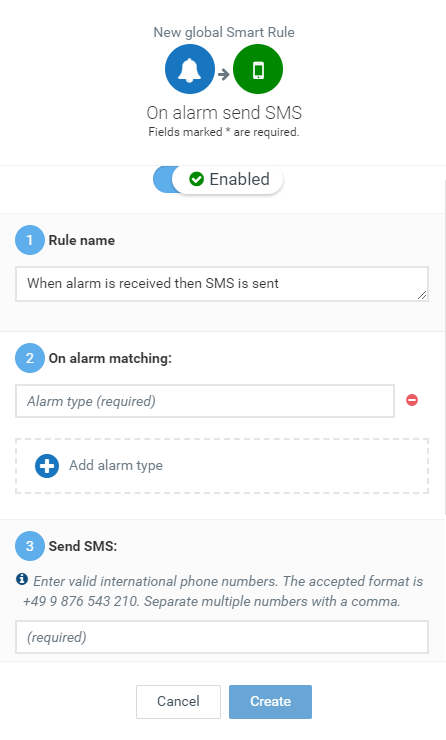
| Step | Field | Description |
|---|---|---|
| 1 | Rule name | Pre-filled with the name of the rule template. Can be modified according to your needs. |
| 2 | On alarm matching: | The types of alarms triggering the rule. For each newly created alarm with one of these types in the list the rule is triggered. |
| 3 | Send SMS: | “Phone number”: Target phone number. It is recommended to include mobile country code for all numbers, e.g. “+49” or “0049” for Germany. Multiple numbers can be separated by a comma (",", do not use a space!). “Message”: Text of SMS with max. 160 characters. You can use variables of the form #{name}. Supported variables are listed under “Smart Rule Variables” below. |
| 4 | Target asset or devices | Groups or devices the rule shall be applied to. |
Troubleshooting
Verify that the alarm was created and not duplicated from somewhere.
Check if the device is in maintenance mode. In this case no new alarm will be created because of suppression policy.
If you have configured an alarm mapping rule (see Administration > Reprioritizing alarms) which changes the alarm severity, the alarm may have different severity than expected.
Important: There is a limit of 160 characters as a total count. If you use variables and after applying the variables the text counts more than 160 characters the SMS will not be sent.
Functionality
When an alarm is created, an email is sent.
Parameters
The rule uses the following parameters:
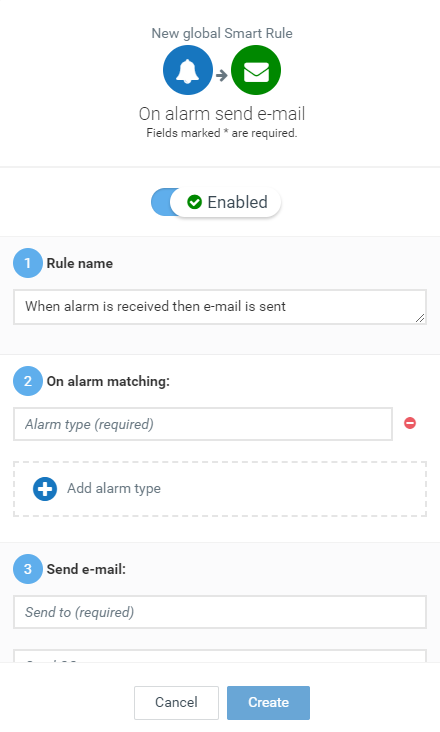
| Step | Field | Description |
|---|---|---|
| 1 | Rule name | Pre-filled with the name of the rule template. Can be modified according to your needs. |
| 2 | On alarm matching: | The types of alarms triggering the rule. For each newly created alarm with one of these types in the list the rule is triggered. |
| 3 | Send e-mail: | “Send to:/Send CC to:/Send BCC to”: Email addresses for sending the e-mail to. Multiple addresses can be separated by a comma (",", do not use a space!). “Reply to”: Address to be used to reply to the message. “Subject”: Subject of e-mail. You can use a variable of the form #{name}. Supported variables are listed under “Smart Rule Variables” below. “Message”: Text of the e-mail. You can use a variable of the form #{name}. Supported variables are listed under “Smart Rule Variables” below. |
| 4 | Target asset or devices | Groups or devices the rule shall be applied to. |
Troubleshooting
Verify that the alarm was created and not duplicated from somewhere.
Check if the device is in maintenancemode. In this case no new alarm will be created because of suppression policy.
If you have configured an alarm mapping rule (see Administration > Reprioritizing alarms) which changes the alarm severity, the alarm may have different severity than expected.
Check your spam folder.
Functionality
When an alarm is created, sends e-mail or SMS.
Parameters
The rule uses the following parameters:
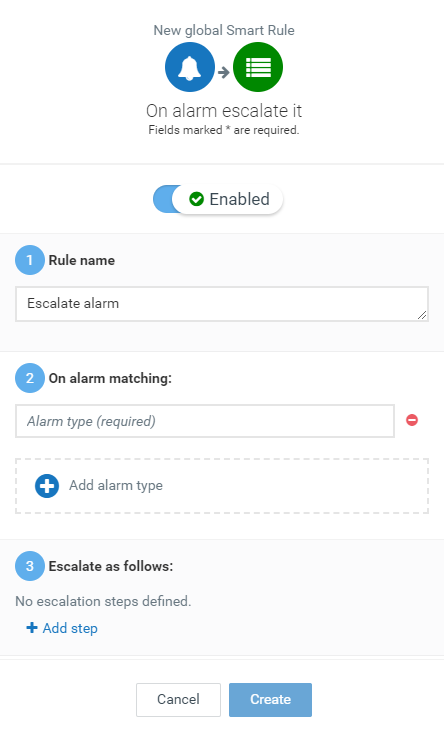
| Step | Field | Description |
|---|---|---|
| 1 | Rule name | Pre-filled with the name of the rule template. Can be modified according to your needs. |
| 2 | On alarm matching: | The types of alarms triggering the rule. For each newly created alarm with one of these types in the list the rule is triggered. |
| 3 | Escalate as follows: | Escalation steps processed in a chain. Click Add step to define at least one step: Type: Type of action executed in the step. Possible values are: * Email (see “On alarm send e-mail” rule for parameter descriptions). * SMS (see “On alarm send SMS” rule for parameter descriptions). Condition: The condition applied when the rule will be executed. Possible values are: * Always: Action will always be executed. * Always: If step N failed. Only phone steps may fail. The step is marked as failed once all retries have been made without a successful call. This option only appears if there already is a phone step configured that can be referred to. |
| 4 | Target asset or devices | Groups or devices the rule shall be applied to. |
Troubleshooting
Verify that the alarm was created and not duplicated from somewhere.
Check if the device is in maintenance mode. In this case no new alarm will be created because of suppression policy.
If you have configured an alarm mapping rule (see Administration > Reprioritizing alarms) which changes the alarm severity, the alarm may have different severity than expected.
Functionality
If an alarm is active for a certain time, the severity is increased.
Parameters
The rule uses the following parameters:
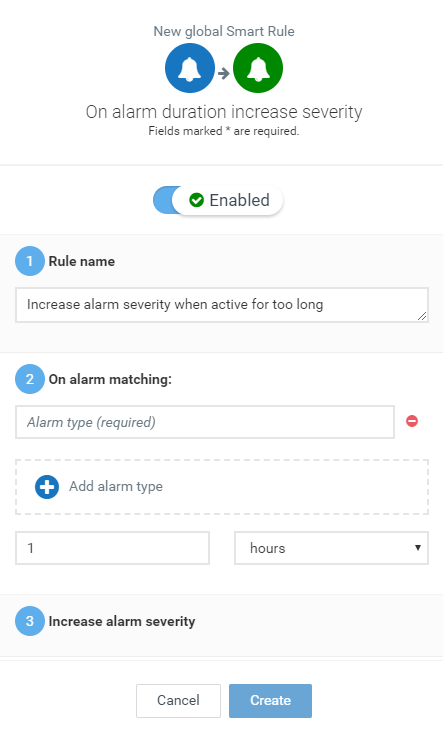
| Step | Field | Description |
|---|---|---|
| 1 | Rule name | Pre-filled with the name of the rule template. Can be modified according to your needs. |
| 2 | On alarm matching: | The types of alarms triggering the rule. For each newly created alarm with one of these types in the list the rule is triggered. |
| 3 | Increase alarm severity | Duration, an alarm must be active, before increasing the severity. |
| 4 | Target asset or devices | Groups or devices the rule shall be applied to. |
Description
When a configured type of alarm is raised, it starts monitoring how long the alarm stays active.
If the alarm is still active after the specified duration, the severity will be increased one level, e.g. from MINOR to MAJOR.
If the alarm has reached CRITICAL, it will stop monitoring because there is no further action possible.
Info: The rule checks once a minute if the configured duration has been exceeded. Therefore it might happen that the alarm severity won’t change in the second it exceeds the duration but only after the following check.
Functionality
If a geofence border is crossed, an alarm is created.
The rule can be configured for entering or leaving the geofence, or both. Existing alarms are cleared when the opposite condition is true again, e.g. if a tracked car which has left the geofence area is re-entering the geofence area.
Parameters
The rule uses the following parameters:
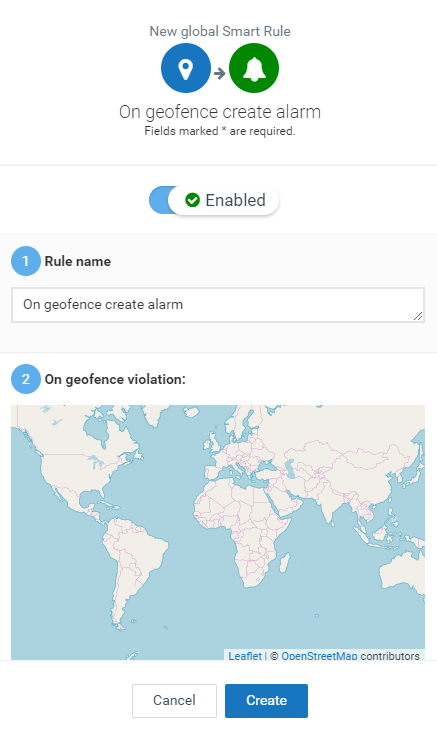
| Step | Field | Description |
|---|---|---|
| 1 | Rule name | Pre-filled with the name of the rule template. Can be modified according to your needs. |
| 2 | On geofence violation: | Polygon that defines the borders of an area. Click Edit geofence and set the area. Double-click to add points and click and drag them to adjust. |
| 3 | Create alarm: | Reason for triggering the alarm: “On entering”, “On leaving” (the default), “On entering and leaving”. Type of alarm being raised. Severity of alarm being raised. Alarm text. |
| 4 | Target asset or devices | Groups or devices the rule shall be applied to. |
Info: In order to raise an alarm the device had to be inside the geofence at least once after creating the rule.
Troubleshooting
Make sure the device was inside the geofence at least once after creating/activating the rule.
Check if the device is in maintenance mode. No new alarm will be created because of suppression policy.
If you have configured an alarm mapping rule (see Administration > Reprioritizing alarms) which changes the alarm severity, the alarm may have different severity than expected.
Functionality
If a geofence border is crossed, an email is sent.
Parameters
The rule uses the following parameters:
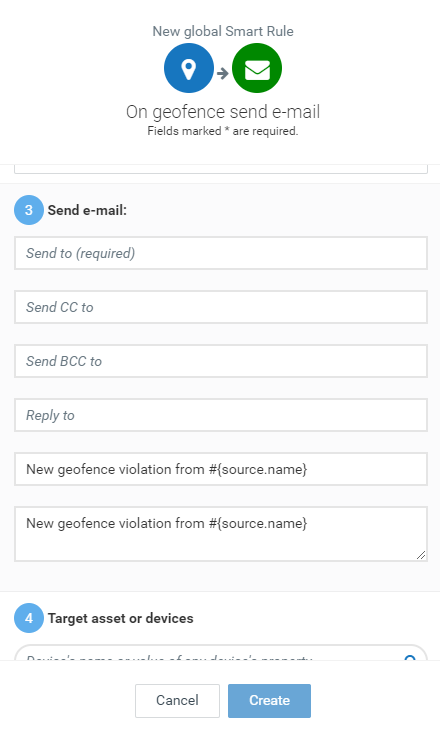
| Step | Field | Description |
|---|---|---|
| 1 | Rule name | Pre-filled with the name of the rule template. Can be modified according to your needs. |
| 2 | On geofence violation: | Polygon that defines the borders of an area. Click Edit geofence and set the area. Double-click to add points and click and drag them to adjust. |
| 3 | Send e-mail: | Send to:/Send CC to:/Send BCC to: Email addresses for sending the e-mail to. Multiple addresses can be separated by a comma (",", do not use a space!). Reply to: Address to be used to reply to the message. Subject: Subject of e-mail. You can use a variable of the form #{name}. Supported variables are listed under “Smart Rule Variables” below. Message: Text of the e-mail. You can use a variable of the form #{name}. Supported variables are listed under “Smart Rule Variables” below. |
| 4 | Target asset or devices | Groups or devices the rule shall be applied to. |
Info: In order to perform the rule the device had to be inside the geofence at least once after creating the rule.
Troubleshooting
Make sure the device was inside the geofence at least once after creating/activating the rule.
Check your spam folder.
Functionality
Creates consumption data point based on data from an electric-, gas-, water- meter.
Parameters
The rule uses the following parameters:
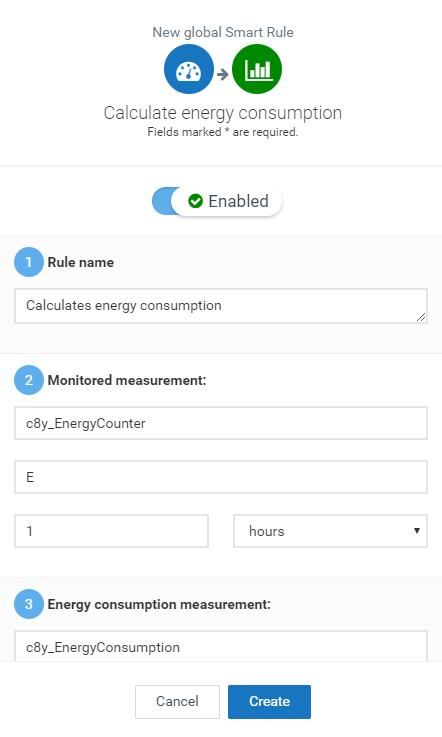
| Step | Field | Description |
|---|---|---|
| 1 | Rule name | Pre-filled with the name of the rule template. Can be modified according to your needs. |
| 2 | Monitored measurement: | Fragment/Series: Name of the measurement fragment and series. The incoming measurement must have exactly the same fragment/series name as configured. When creating a rule from the data explorer, these fields are already filled in. Time interval: Interval in which consumption values shall be calculated. Specifies how often per hour the consumption is calculated. |
| 3 | Energy consumption measurement: | Name of the measurement fragment and series that shall be generated. |
| 4 | Target asset or devices | Groups or devices the rule shall be applied to. |
The unit of the consumption measurement is always per hour (i.e. if the measurements are in “kg” the consumption will be in “kg/h”).
The rule takes the last two measurements for a specified time, calculates the difference in value and time and then calculates the consumption per hour.
Example
The rule is configured to calculate every 20 minutes. The following measurements are coming in: 100 kg at 11:59 and 200 kg at 12:14. At 12:20 the rule is triggered, taking the last two measurements. It calculates value and time difference. The consumption measurement created at 12:20 will therefore be 400 kg/h. If no new measurement was created in the last period a measurement with consumption 0 will be created.
Functionality
If no new measurement data has been received for a specified time, an alarm is created.
Parameters
The rule uses the following parameters:
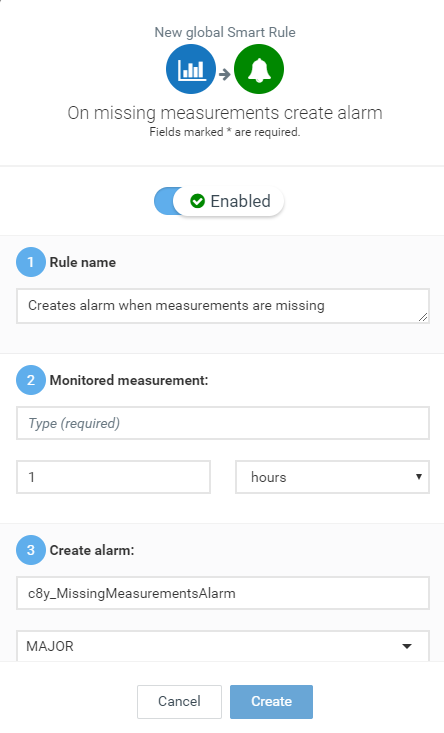
| Step | Field | Description |
|---|---|---|
| 1 | Rule name | Pre-filled with the name of the rule template. Can be modified according to your needs. |
| 2 | Monitored measurement: | Type: Type of measurement. The incoming measurement must have the same type as configured. When creating a rule from the data explorer, the type is already filled in. Time interval: Interval for calculating consumption values. |
| 3 | Create alarm: | Type of alarm being raised. Severity of alarm being raised. Alarm text. |
| 4 | Target asset or devices | Groups or devices the rule shall be applied to. |
Info: The rule checks once a minute if the configured time interval was exceeded. Therefore it can take up to one minute to create the alarm after the time interval was exceeded. To check if the time interval was exceeded there must be at least one incoming measurement after the activation of the rule.
Functionality
If a certain alarm occurs, the specified operation will be send to the device.
Parameters
The rule uses the following parameters:
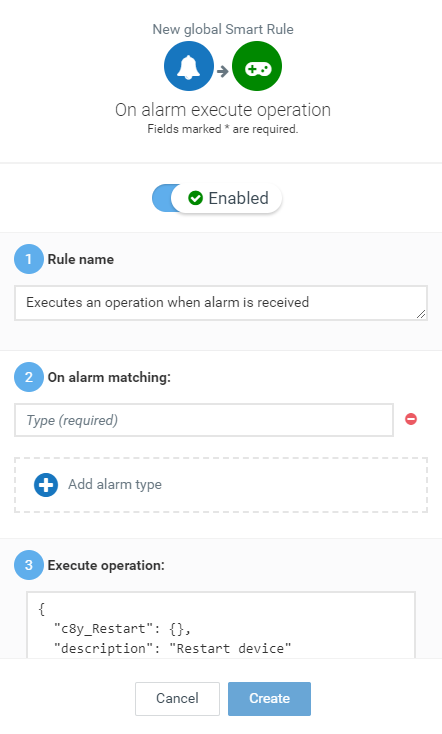
| Step | Field | Description |
|---|---|---|
| 1 | Rule name | Pre-filled with the name of the rule template. Can be modified according to your needs. |
| 2 | On alarm matching: | The types of alarms triggering the rule. For each newly created alarm with one of these types in the list the rule is triggered. |
| 3 | Execute operation: | The operation that will be sent. The operation is provided as JSON description. Some standard operations can be selected below the Operation field. To use a standard operation, select one, and press the arrow button on the right. This will insert the JSON of the selected operation. |
| 4 | Target asset or devices | Groups or devices the rule shall be applied to. |
Functionality
When the measurement value enters or leaves the RED/YELLOW range, an alarm is created or respectively cleared.
The severity of alarm is determined as follows:
If the measurement value moves into RED range, then the severity is CRITICAL.
If the measurement value moves into YELLOW range, then the severity is MINOR.
If the measurement value moves into GREEN range, the alarm is cleared.
The rule uses the following parameter from the device object or data point library:
Object red range: Range when the system should create CRITICAL alarms. These values can be edited in the data explorer for each data point.
Object yellow range: Range when the system should create MINOR alarms. These values can be edited in the data explorer for each data point.
Data Point Library red/yellow range: When there is no red/yellow range stored in the respective object, then the Data Point Library is searched for the configured data point entry and the related red/yellow range is used.
Using this mechanism, you can configure global threshold ranges in the Data Point Library. These global values can then be overridden for specific objects on a case-by-case basis.
Parameters
The rule uses the following parameters:
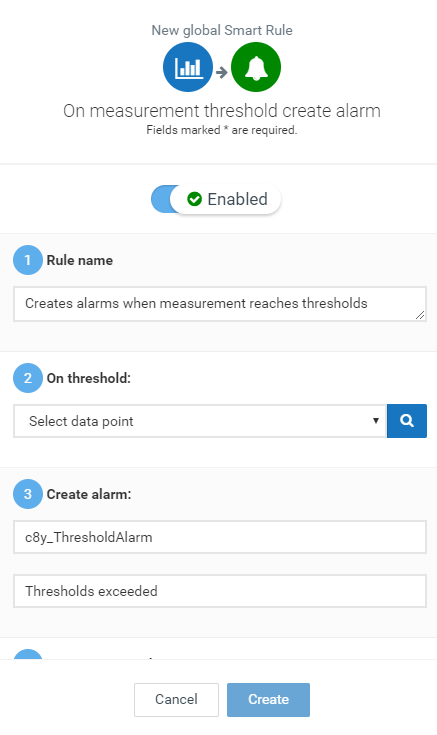
| Step | Field | Description |
|---|---|---|
| 1 | Rule name | Pre-filled with the name of the rule template. Can be modified according to your needs. |
| 2 | On threshold: | Fragment/Series: Name of the measurement fragment and series. The incoming measurement must have exactly the same fragment name as configured. When creating a rule from the data explorer, these fields are already filled in. Data Point Library entry: Name of the entry in the Data Point Library. This is used to find the default values for red and yellow ranges in case they are not configured for an individual object. |
| 3 | Create alarm: | Type: Type of alarm being raised. Text: Alarm message. |
| 4 | Target asset or devices | Groups or devices the rule shall be applied to. |
Description
For each incoming measurement value, the rule performs the following steps:
Check, if the measurement includes data for the fragment and series (rule parameter).
Check, if the rule is activated for the source object.
The data of the red and yellow range is collected from either:
the source object (the measurement),
the Data Point Library (control parameter).
If no red/yellow ranges are defined, no alarms are generated.
Info: Range values defined in the source object have a higher priority than those defined in the Data Point Library. You can also just overwrite a single value (e.g. yellow range max) by setting it in the source object. The other values will then be taken from the Data Point Library.
Incoming value inside the yellow range:
If there is an active alarm of given type for the object, set severity to MINOR. Otherwise create new MINOR alarm with given parameters.
Incoming value inside the red range:
If there is an active alarm of given type for the object, set severity to CRITICAL. Otherwise, create new CRITICAL alarm with given parameters.
Measurement outside of yellow and red range:
If there is an active alarm of given type for the object, clear the alarm.
Troubleshooting
Verify that the alarm was created and not duplicated from somewhere.
Check if the device is in maintenance mode. In this case no new alarm will be created because of suppression policy.
If you have configured an alarm mapping rule (see Administration > Reprioritizing alarms) which changes the alarm severity, the alarm may have different severity than expected.
Check if an alarm was already cleared by the next scheduled measurements with resulting value in a green range.
Info: If you clear an alarm, you state that the alarm is resolved. A new alarm is not raised unless the device changes its state and exceeds the thresholds again.
Functionality
When the measurement value enters or leaves the RED range, a CRITICAL alarm is generated or cleared.
The severity of alarm is determined as follows:
If the measurement value moves into RED range, then the severity is CRITICAL.
If the measurement value moves into GREEN range, the alarm is cleared.
Info: This rule is similar to the rule “On measurement threshold create alarm”. However, in this rule here the RED threshold value is provided explicitly. The threshold rule “On measurement threshold create alarm” extracts the thresholds values from the device or Data Point Library.
Parameters
The rule uses the following parameters:
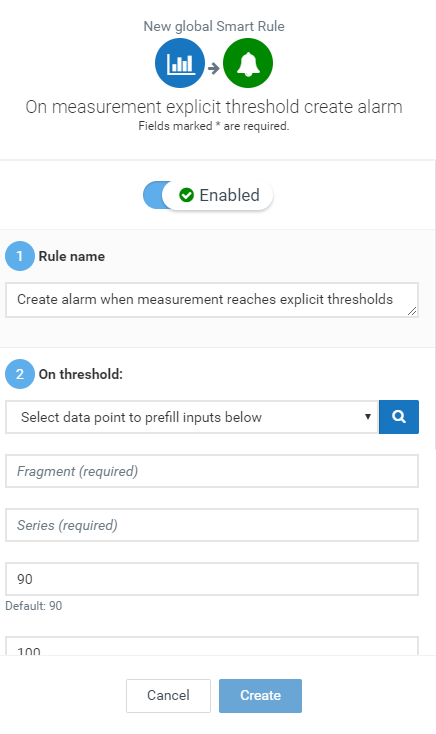
| Step | Field | Description |
|---|---|---|
| 1 | Rule name | Pre-filled with the name of the rule template. Can be modified according to your needs. |
| 2 | On threshold: | Fragment/Series: Name of the measurement fragment and series. The incoming measurement must have exactly the same fragment name as configured. When creating a rule from the data explorer, these fields are already filled in. Minimum, Maximum: When a value is in the specified range [minimum; maximum], the configured alarm is raised. |
| 3 | Create alarm: | Type: Type of alarm being raised. Text: Alarm message. |
| 4 | Target asset or devices | Groups or devices the rule shall be applied to. |
Troubleshooting
Verify that the alarm was created and not duplicated from somewhere.
Check if the device is in maintenance mode. In this case no new alarm will be created because of suppression policy.
If you have configured an alarm mapping rule (see Administration > Reprioritizing alarms) which changes the alarm severity, the alarm may have different severity than expected.
Check if an alarm was already cleared by the next scheduled measurements with resulting value in a green range.
Info: If you clear an alarm, you state that the alarm is resolved. A new alarm is not raised unless the device changes its state and exceeds the thresholds again.
In certain rule parameters, variables can be used. When a rule is triggered, the variables are replaced by their actual values. You can use this mechanism to insert device names or alarm text into various outputs (email, SMS). You can include any information of the triggering event (like the alarm) and its source device.
The following table lists example variables:
| Variable | Content |
| #{creationTime} | Time when the alarm was created in the database. |
| #{type} | Type of the alarm. |
| #{time} | Time of alarm, as provided by the alarm. |
| #{text} | Textual description of the alarm. |
| #{source.name} | Name of the device. |
| #{source.c8y_Hardware.serialNumber} | Serial number of the device. |
| #{source.c8y_Notes} | Note field of the device. |
| #{status} | Status of the alarm: ACTIVE, ACKNOWLEDGED or CLEARED. |
| #{severity} | Severity of the alarm: CRITICAL, MAJOR, MINOR or WARNING. |
| #{count} | Number of alarm messages for this device: Repeating messages for the same device and same alarm type are de-duplicated into one alarm. |
| #{source.c8y_Address.street} | Street of the device. |
| #{source.c8y_Address.cityCode} | ZIP code of the device. |
| #{source.c8y_Address.city} | City of the device. |
Info: In case the variable does not exist or is misspelled, the generated content is displayed.