Machine Park Overview
The Overview page is the landing page of the OEE application. Here you can find aggregated information on the OEE values of your machine park.
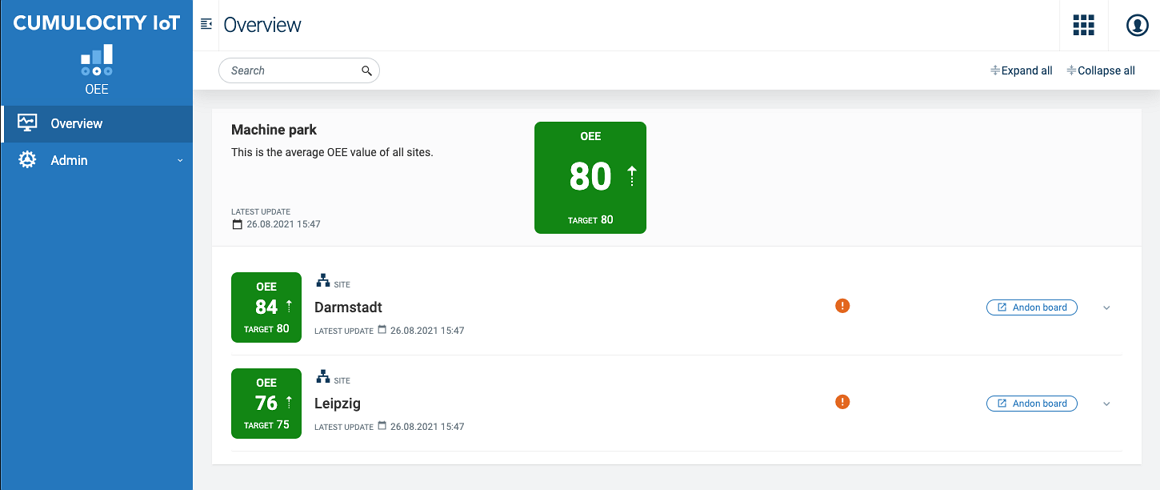
Depending on the defined target value, the OEE box for an entity is either displayed in green (above threshold) or in red (below threshold). The particular value and the threshold are also shown in the OEE box.
Every 10 minutes a new value is calculated. The precise timestamp is shown in the latest update information.
In the upper section, the average OEE for the entire machine park is shown, i.e. the average OEE value of all sites for which OEE values are listed in the Machine Park Dashboard.
Below, the OEE for the areas, sites, lines and machines are displayed.
Clicking the arrows expands (or collapses) an entity and shows (or hides) the entities assigned to it.
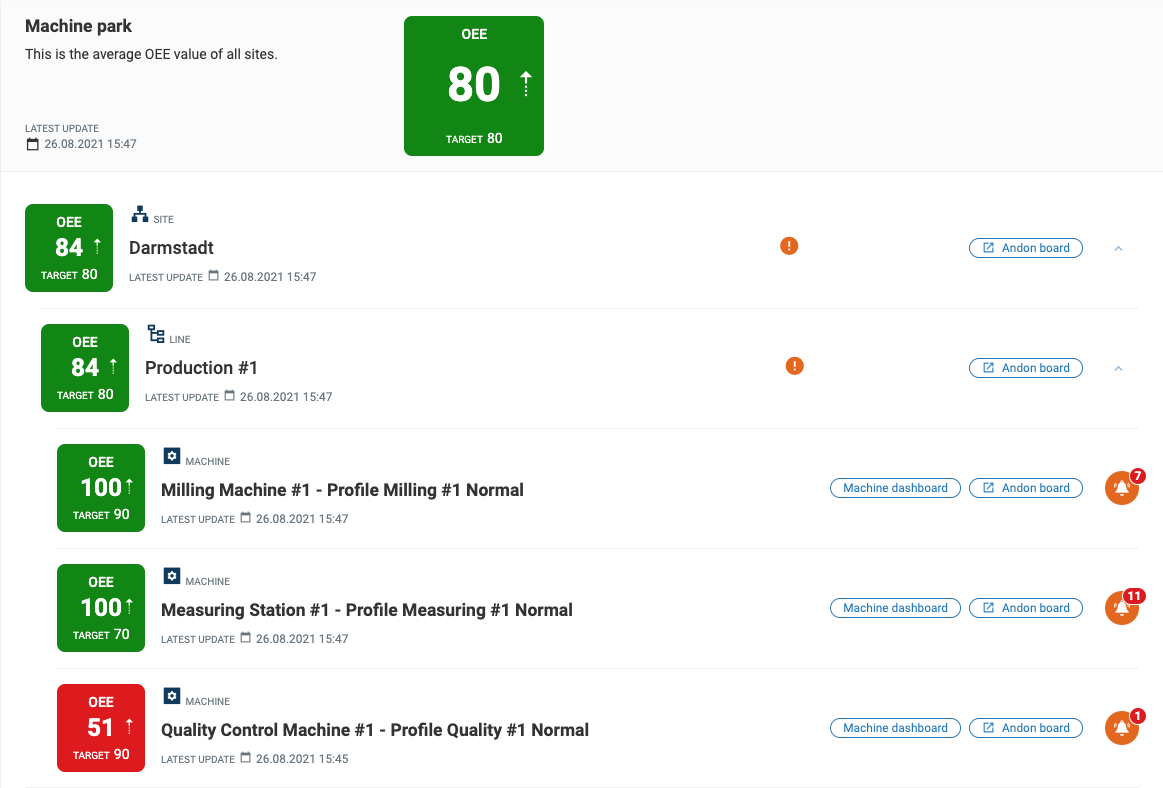
The OEE value for an entity is calculated as the average or the product (see below) of the associated entities that follow in the hierarchy. The hierarchy is as follows: Site > Area > Line > Machine.
For sites, areas and lines you can select one of the following options for the OEE calculation:
- the average of the attached entities
- the product (percentages) of the attached entities
This can either be configured when creating an area, site or line profile or set later under Administration > Organization, see Organization.
In the search field at the top left you can search for specific sites, areas, lines and machines by searching for their profile name.
Click Andon Board at the right of an entry to switch to the respective Andon board, see Andon board.
Click Machine dashboard at the right of machine to switch to its Machine dashboard, see Machine dashboard.
An orange alarm icon at the right of an entry indicates an alarm within this entity, together with the number of alarms shown in red.
Orange/Blue dot - Indicates an alarm within this entity. The color of the icon depends on severity of the alarm.
Orange alarm icon with number on top - Displays the number of alarms on the machine or the production line.
Orange spanner icon - The profile within the entity is not fully configured.
Blue cloud icon with clock symbol – The profile did not receive measurements yet.
White square within a grey or black circle - Indicates that the profile is deactivated and no new measurements are being received.
The color of the alarms depends on the priority of the alarms. In general, the color of the alarm with the highest priority is always displayed.
Machine dashboard
The machine dashboard offers a detailed view about the current status and development of the OEE of the machine.
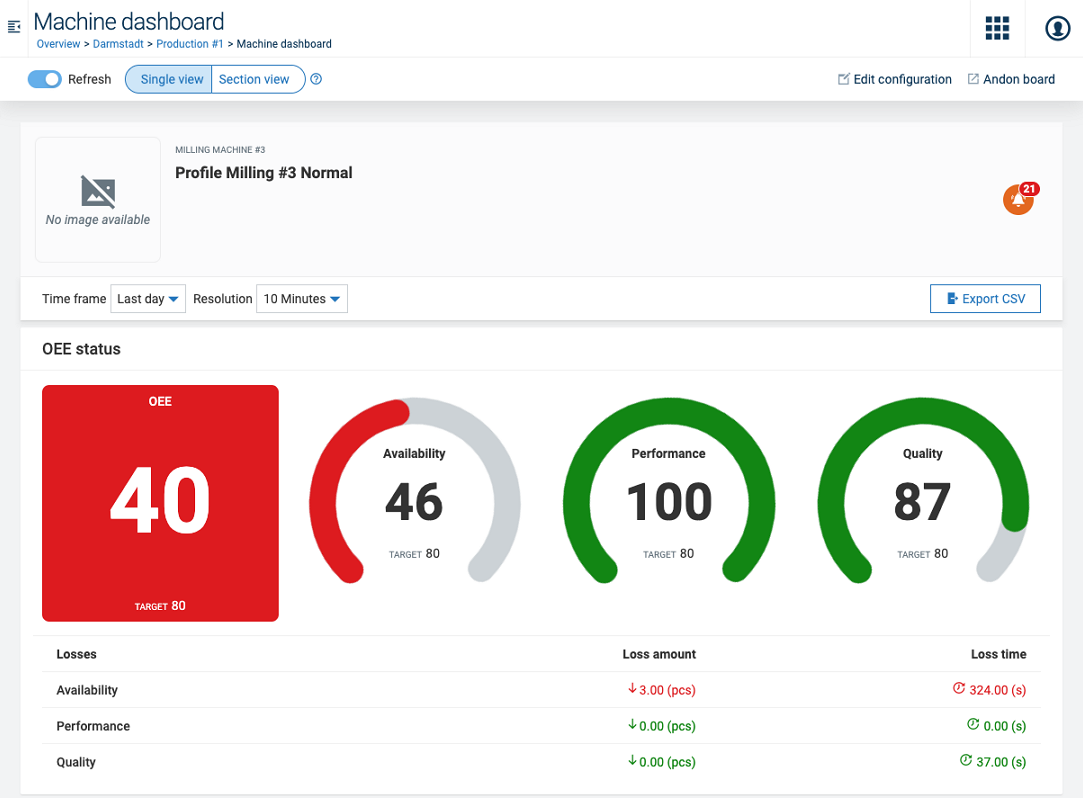
At the top you find the general information (profile name, alarm status etc.) provided in the Machine Park Overview, followed by the OEE status section and OEE data section.
By default, the Auto-refresh option at the top left is activated and OEE status and OEE data information is updated automatically according to the selected resolution. Switch the toggle to deactivate it.
Click Andon Board at the right of the top menu bar to switch to the Andon Board of this particular machine, see Andon Board.
Click Edit configuration at the right of the top menu bar to edit the machine profile in the profile configurator, see Creating machine profiles. This link is only visible if the user has a role assigned with the Oeeconfigurator Admin permission enabled.
Info: To access the OEE dashboards, the permission “Oeeconfigurator” with type READ or ADMIN must be enabled for the user/role. Without the required permission you might see error messages or not see any data in the machine dashboard.
Time period and resolution
In the Time frame dropdown field you can select a time period (for example “Last hour”, “Last week”) for which the OEE values will be displayed in the OEE status and OEE data sections. Select “User-defined” from the dropdown list to specify an individual time period.
In the Resolution dropdown field you can select the resolution for the selected time period. The available resolutions (up to 4; for example 1 minute, 10 minutes, 1 hour, 8 hours) are configured during the profile creation, see Creating machine profiles.
Info: If the selected time frame is “last hour” you can set the resolution to 1 minute and 10 minutes, but other resolutions that are equal or longer than 1 hour, won’t be offered.
OEE status
In the OEE status section, the values for OEE, Availability, Performance and Quality according to the selected time frame and resolution are shown.
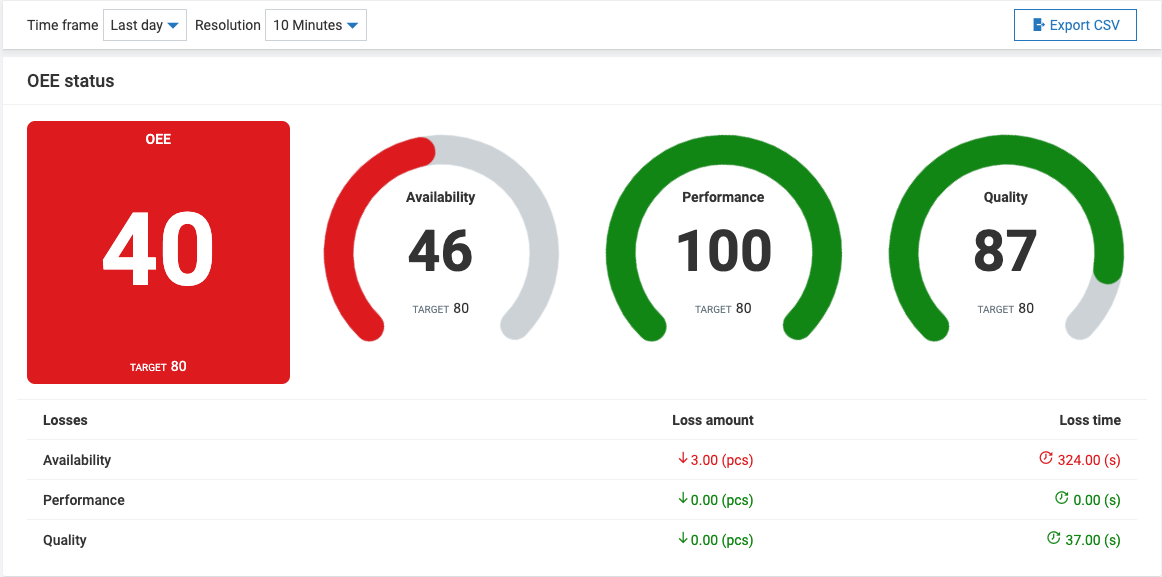
Below these values the losses caused by Availability, Performance and Quality are displayed in terms of time and amount.
Info: If you have selected the section view and a shift is selected (see below), the OEE status section displays the OEE and the losses for the entire shift.
Data
In the Data section, two types of data charts are available, the single view and the section view, which can be selected at the top.
In each view, the components being displayed in the chart, like for example OEE, Availability, Performance, and Quality, can be selected at the right by activating/deactivating the respective toggles.
Single view
The single view chart shows the current values of the selected components for the specified time frame. The resolution interval equals the Potential Production Time.
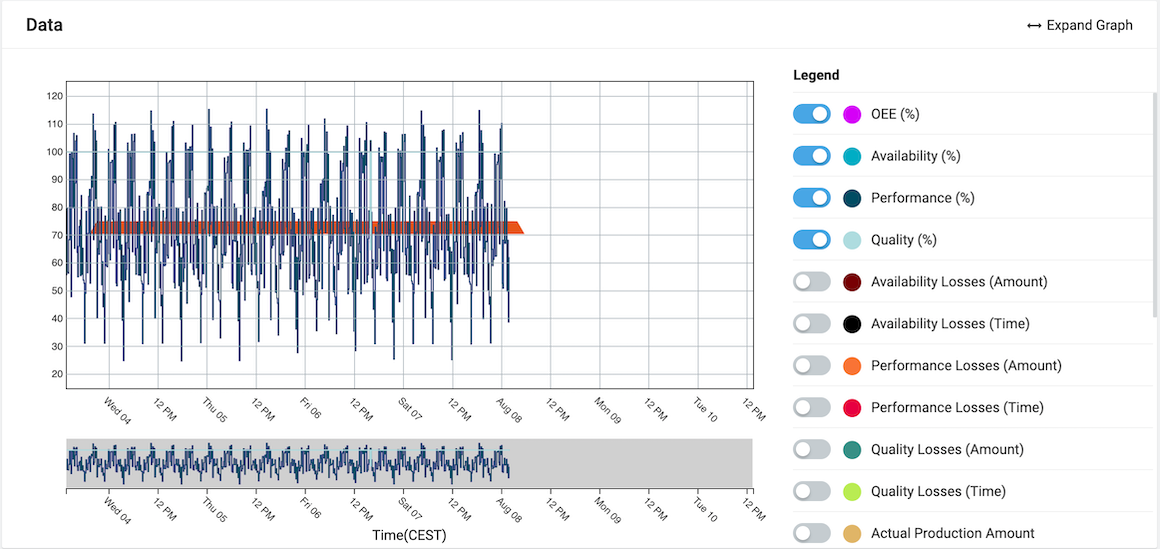
Info: The time frame does not influence the direct calculation of the OEE. It only defines the time period for which the OEE is displayed here.
Section view
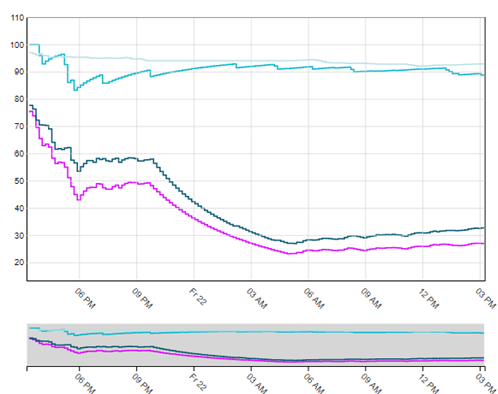
The section view chart shows the development of the OEE variables over a certain time period.
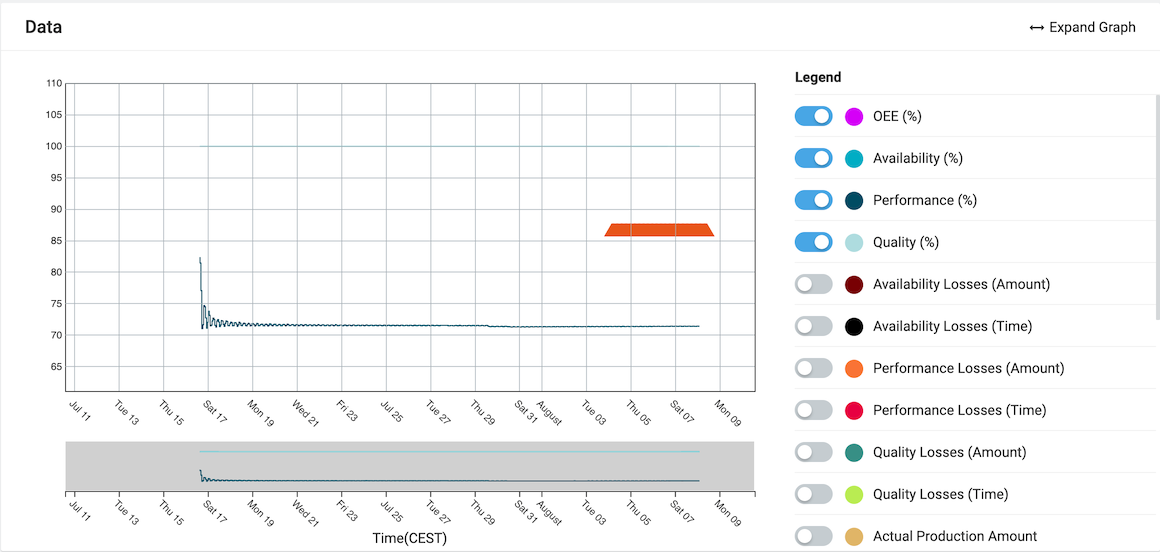
Here, the Potential Production Time is no longer a fixed period, specified by the user, but a growing period, which is always extended by a certain interval, the resolution interval. If the Potential Production Time is as long as the specified time frame, it does no longer grow, but shifts forward by the interval (if auto-refresh is activated).
The following example shows the development of the section view during major Quality Losses. The drop in OEE (purple line) during the loss phase is clearly visible.
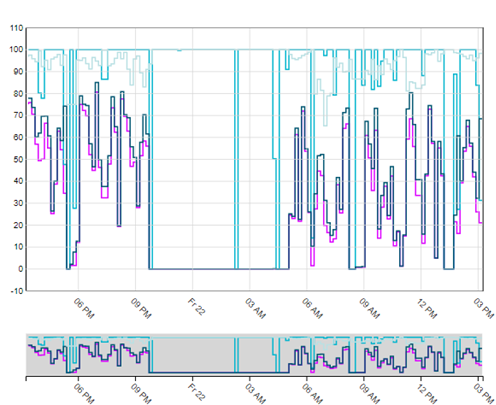
Info: Implausible values are taken into consideration for the section view calculation. Most implausible values are caused by a too low Ideal Cycle Amount. Even if implausible conductivity values arise over short periods of time, this will pay off over a longer interval. In order to obtain meaningful values for a shift, it is therefore useful to calculate with implausible values.
Pareto chart
The Pareto chart shows the loss ranking according to Pareto. The Pareto principle assumes that 80 % of the losses can be attributed to 20 % of the causes of defects.
The losses can be shown in relation to pieces or time by switching the toggle at the top right.
If all losses are 0, the OEE is 100%. Since this is not possible in reality, as OEE is always measured against an ideal, there are always losses shown in the Pareto chart.
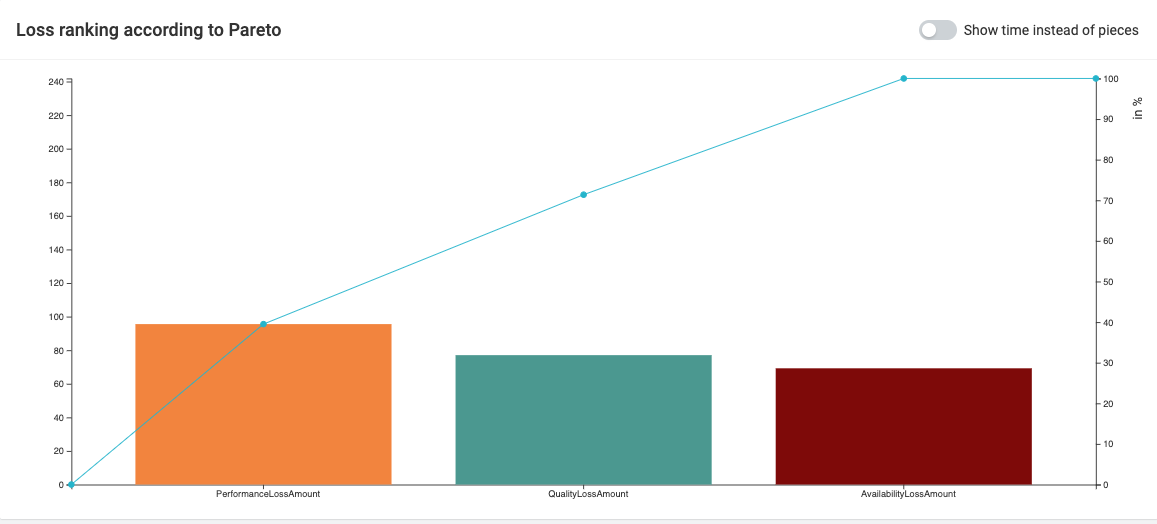
The faults that cause the most damage are listed first. It thus supports the decision-making by recommending the order in which the causes of faults should be eliminated.
In the Pareto chart on the right, all losses, divided into the areas Availability, Performance and Quality, are displayed and put in relation to each other. In this case, the Availability Losses make up 52.74% of the total losses. In a future version, the three main losses can be divided into further categories to better identify sources of faults.
Alarm list
Click the alarm icon at the top to display the alarm list at the bottom of the machine dashboard.
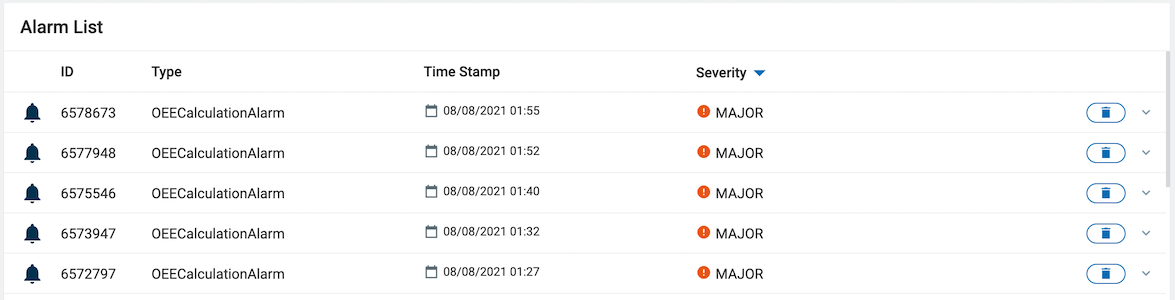
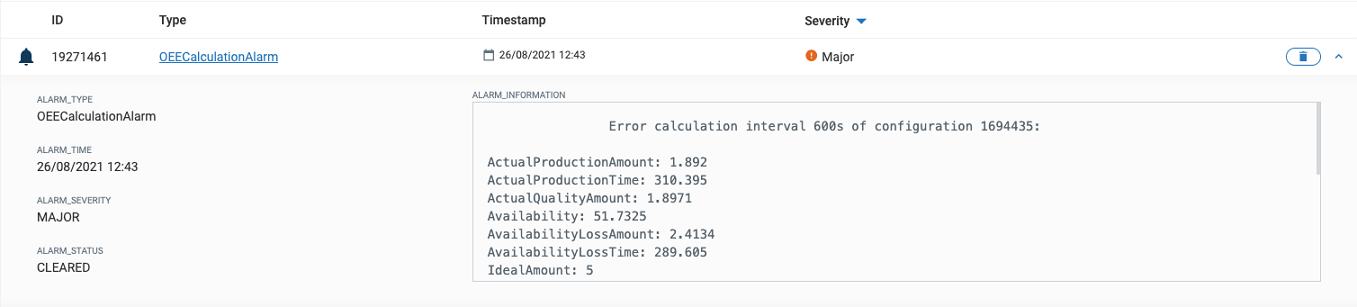
The alarm list shows the following information for each alarm: ID, type, timestamp (time of occurrence) and severity.
The alarms can be filtered by severity:
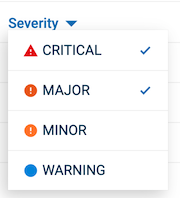
Info: Only alarms belonging to the OEE calculation are displayed in the alarm list. Other alarms (for example machine alarms) are not shown here.
Clicking the arrows expands (or collapses) the alarm and shows (or hides) more detailed information.
To delete an alarm from the list, click the delete icon at the right of the respective row.
Info: Each alarm generated by the OEE application has a status flag “Oeedeleted”, which is set to “true” on deletion. Alarms that are deleted in this way are only deleted from the alarm list and the alarm continues to exist in the Cumulocity IoT platform. Alarms triggered by the OEE application always have the status CLEARED. For more information on the status of alarms and how to treat them, see the Cumulocity IoT OpenAPI Specification.
Export CSV
Click Export as CSV at the right. The Export page in the Cockpit application will open.
-
Click Add export in the top menu bar.
-
Enter a name for the export and select the file type (CSV is the default) for the output.
-
In the Filters section, select Objects to export, enter the profile name to be exported and select it from the list.
-
In the Fields section, turn Managed objects on, and add the following columns:
- OEE Profile > @com_adamos_oee_datamodel_MachineOEEConfiguration
- Cumulocity ID > ID of the OEE calculation profile
- Name > name

Info: Column names are user defined, whereas the path is the fragment name of the managed object.
-
Click Save & close to save your configuration.
-
Select the checkbox in front of your export in the export list and at the left of the top menu bar click Export.
An email will be sent to the user email address containing a link to the export file.
See also Cockpit > Managing exports for details on the export functionality.
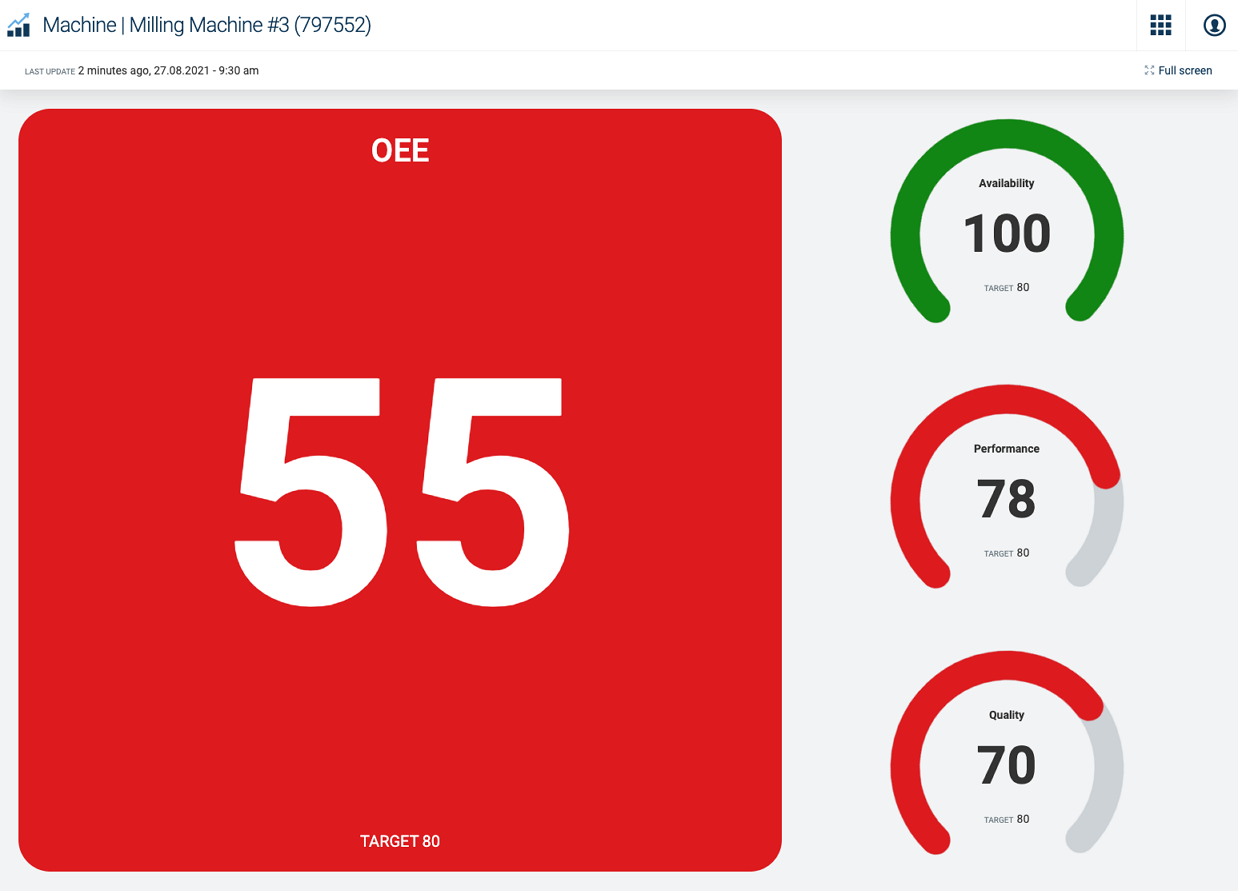
Andon board
The Andon Board displays and constantly updates the values OEE, Availability, Performance and Quality for each entity in the Machine Park Overview.
The update interval of the values in the Andon Board for sites, areas and lines is set to 10 minutes.
For machines, the update interval by default is also set to 10 minutes but can be adjusted by clicking Interval at the top right.