Working with dashboards
Cumulocity allows you to create individualized dashboards for all your groups and devices. Dashboards provide you with a customized visualization of your data, for example, alarms and events, and allow you to trigger remote actions, by using a set of widgets. Widgets can display maps, images, graphs, tables, and other graphic representations of data.
Cumulocity comes with a number of preset widgets, see Widgets collection for details.
ROLES & PERMISSIONS:
- To view dashboards: READ permission for permission type “Inventory” or READ permission for “Inventory” in inventory roles
- To edit widgets within a dashboard: ADMIN permission for permission type “Inventory” or CHANGE permission for “Inventory” in inventory roles
- To create a dashboard: CREATE or ADMIN permission for permission type “Inventory” or CHANGE permission for “Inventory” in inventory roles
- To delete a dashboard: ADMIN permission for permission type “Inventory” or CHANGE permission for “Inventory” in inventory roles
- To share/copy a dashboard: CREATE permission for permission type “Inventory” or CHANGE permission for “Inventory” in inventory roles
To create a dashboard
To create your individualized dashboard, execute the following steps:
-
In the Groups menu select the group or the device in the navigator for which to create a dashboard.
-
Click the plus icon right from the tabs to open the dashboard editor.
-
In the Tab section of the dashboard editor, provide the following information:
- An icon which is shown next to the dashboard name in the navigator.
- A menu label to be used as the name of the dashboard.
- The location of the dashboard in the navigator, with “10000” being ordered first and “-10000” last.
-
Enable the option Apply dashboard to all devices of type
to share the dashboard with all devices of this type. -
In the Availability section, specify which users have access to the dashboard based on global roles. By default, all available global roles are selected, which means that a user with at least one such role has access to the dashboard.
Info- Dashboards are always visible to their owner and to users with ADMIN permission for the permission types “Inventory” or “Managed object”.
- This functionality is entirely based on client-side solutions. If users have an accurate link to the dashboard, they will still be able to access it.
-
In the Layout section you can select a theme for the dashboard (one of “Light”, “Dark”, “Transparent” or “Branded”) and a default header style for the widgets (one of “Regular”, “Border”, “Overlay”, or “Hidden”). Moreover, you can change the default widget margin (default value is 15 px).
-
Enable the option Translate widget titles if possible, to have the widget title translated every time the language is changed.
InfoThe widget titles will be translated only if a valid translation is available. -
In the Preview section at the right, a preview of the selected layout settings is immediately displayed to visualize your selections.
-
Click Save to create and open the dashboard.
Next, widgets can be added to the report. They allow you to display more detailed data in your dashboard.
Refer to Using widgets in dashboards and reports for details on how to add, modify or remove widgets.
To share a dashboard
You can create a dashboard for a specific device and share it with all devices of the same type. This is only possible though, if the type property is set for the device.
To do so, select the option Apply dashboard to all devices of type [TYPE] ([TYPE] is replaced with the type of the device that is currently selected).
A corresponding message will be displayed in the editor.
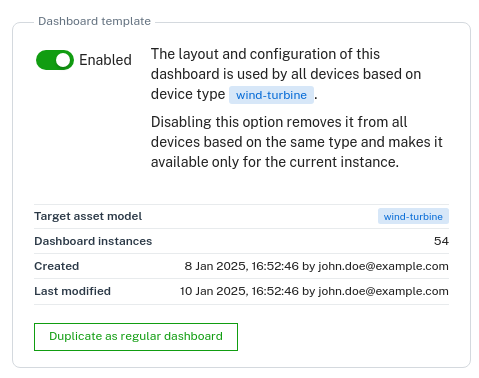
Changes made to this dashboard are automatically applied to all dashboard instances.
Global time context
In the widget configuration, you can specify a global time range for your dashboards. When using a global time range, all data in a dashboard will be aligned to this range. After setting the global time range in a first widget, this shared context can then be used by other widgets that are configured to use the global date context.
The global time range can be set to any time span, depending on the monitoring needs, by using a custom date picker. The time range is displayed at the top of the dashboard, so you can immediately see the context for which the data is presented. Additionally, you can share dashboards with a specific time context by including the time context parameters in a URL. URL parameters will be set automatically when users set the global time context with the picker.
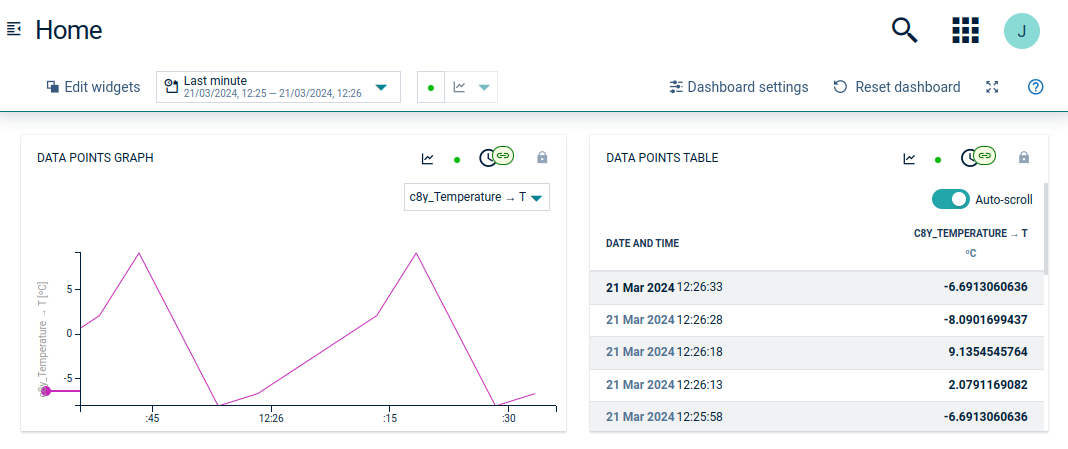
Widgets synchronized with the dashboard time range are indicated by a respective icon at the top right of the widget.
To edit a dashboard
To edit a dashboard, click Edit in the top menu bar.
The dashboard editor will open up. For details on the fields, refer to To create a dashboard.
To copy a dashboard from one object to another
-
Click More… in the top menu bar and from the context menu select Copy dashboard.
-
Next, navigate to the object you want to copy the dashboard to and from the context menu select Paste dashboard [NAME] to insert the dashboard.
An alternative way to copy a dashboard is to use the “dashboard per type” approach. With the “dashboard per type” approach you share the dashboard from one object with all objects of the same type, see To share a dashboard.
To delete a dashboard
To delete a dashboard from an object, click More… in the top menu bar and from the context menu select Delete dashboard.