IoT platform
Cumulocity IoT Edge comes with three built-in applications - Device Management, Cockpit and Application.
Since Cumulocity IoT Edge is based on the same software as the cloud-based Cumulocity IoT Core version, the above applications are the same in both versions, with minor restrictions.
Below find an overview on the functionalities of these applications in Cumulocity IoT Edge.
For general information on functionalities and features of the GUI refer to GUI functionalities and features.
For information on how to change the user settings of your account refer to User settings.
Device Management
The Device Management application provides functionalities for managing and monitoring devices and enables you to control and troubleshoot devices remotely.
The following functionalities are available in Cumulocity IoT Edge and described in detail in these sections:
| SECTION | CONTENT |
|---|---|
| Connecting devices | How to register one or more devices manually and how to bulk-register devices in order to connect devices to your account. |
| Viewing devices | What is displayed in the device list and how to sort devices by searching for devices and filtering devices. |
| Grouping devices | Why and how to group devices into top-level groups, subgroups and smart groups. |
| Device details | Detailed description of the various kind of information available for various types of devices. |
| Monitoring and controlling devices | How to monitor the connection quality and service status of devices, how to handle alarms from devices, how to remote control and how to troubleshoot devices. |
| Managing device types | How to process data from various device types by using device protocols. |
| Managing device data | How to retrieve and manage firmware and software for devices and how to handle configuration snapshots. |
| Using SmartREST templates | How to work with SmartREST templates, a collection of request and response templates used to convert CSV data and Cumulocity Rest API calls. |
Cockpit
The Cockpit application provides you with options to manage and monitor Internet of Things (IoT) assets and data from a business perspective.
The following functionalities are available in Cumulocity IoT Edge and described in detail in these sections:
| Section | Content |
|---|---|
| Managing assets | Organize assets in hierarchies by creating groups and assigning devices. |
| Visualizing data using the Data Explorer | Interactively explore, compare and visualize IoT data. Describes how to access and use the data explorer, add data points to the data explorer, customize data point properties, modify the visualization, store the data explorer as widget, and export the data. |
| Working with dashboards | Create your own analytics and monitor pages by adding and arranging widgets. Share dashboards among all devices of the same type. |
| Widgets collection | Use various types of widgets from the Widgets collection that comes with Cumulocity and configure them according your needs. |
| Working with alarms | Monitor problems of your assets using severities and workflows. Since working with alarms in the Cockpit application is actually the same as working with alarms in Device Management, refer to Working with alarms in Device Management. |
| Managing reports | Handle reports based on dashboard layouts, create reports for exporting data in CSV or excel format and schedule the export. |
| Using the Data Point Library | Manage default settings (“profiles”) of your devices and apply them automatically using the Data Point Library. |
| Working with Smart Rules | Create and manage business rules to work on incoming data in realtime and to perform actions based on this data. |
| Smart Rules collection | Use pre-defined global Smart Rules to configure rules for geofencing, thresholds or alarm escalation and notifications (SMS/email/voice). Describes each SmartRule and its configurable parameters in detail. |
Administration
The Administration application enables account administrators to manage their users, roles, tenants and applications and lets them configure a number of settings for their account.
The following functionalities are available in Cumulocity IoT Edge and described in detail in these sections:
| SECTION | CONTENT |
|---|---|
| Home Screen | Providing information on your capacity usage and subscribed applications. |
| Managing Users | How to create users, edit, disable or delete them. |
| Managing Permissions | How to create and edit global roles and inventory roles, how to assign them to users, and how to grant application access. |
| Managing own applications | How to manage and configure own applications in your Cumulocity account. |
| Changing settings | How to change account settings like application settings or password policy settings and how to manage the properties library. |
| Managing data retention | How to manage and configure retention rules for your data and how to manage stored files in the file repository. |
Connecting devices
Cumulocity uses REST and MQTT as protocols for external communication. Both protocols may be used to interface devices with Cumulocity. For details refer to the sections on Device integration using REST and Device integration using MQTT in the Device SDK guide.
Additionally, Cumulocity IoT Edge offers Cloud Fieldbus functionality to collect data from fieldbus devices and remotely manage them. To do so, various protocols are provided, e.g. Modbus and OPC/UA. For details on how to integrate devices using Modbus and OPC/UA, refer to Optional Services > Cloud Fieldbus in the User guide.
Connecting a Modbus device
Modbus is a serial communications protocol originally published by Modicon and used to establish master-slave/client-server communication between devices.
Before you connect a Modbus device
- check if the agent is running,
- register the Modbus agent. This only has to be done once as a preparation step and is not required for every Modbus device.
How to check/change the agent state
Use the following command to check if the agent is running in Cumulocity IoT Edge (running on port 6670):
$ systemctl status cumulocity-agent
If the agent is not running, start it with the following command:
$ systemctl start cumulocity-agent
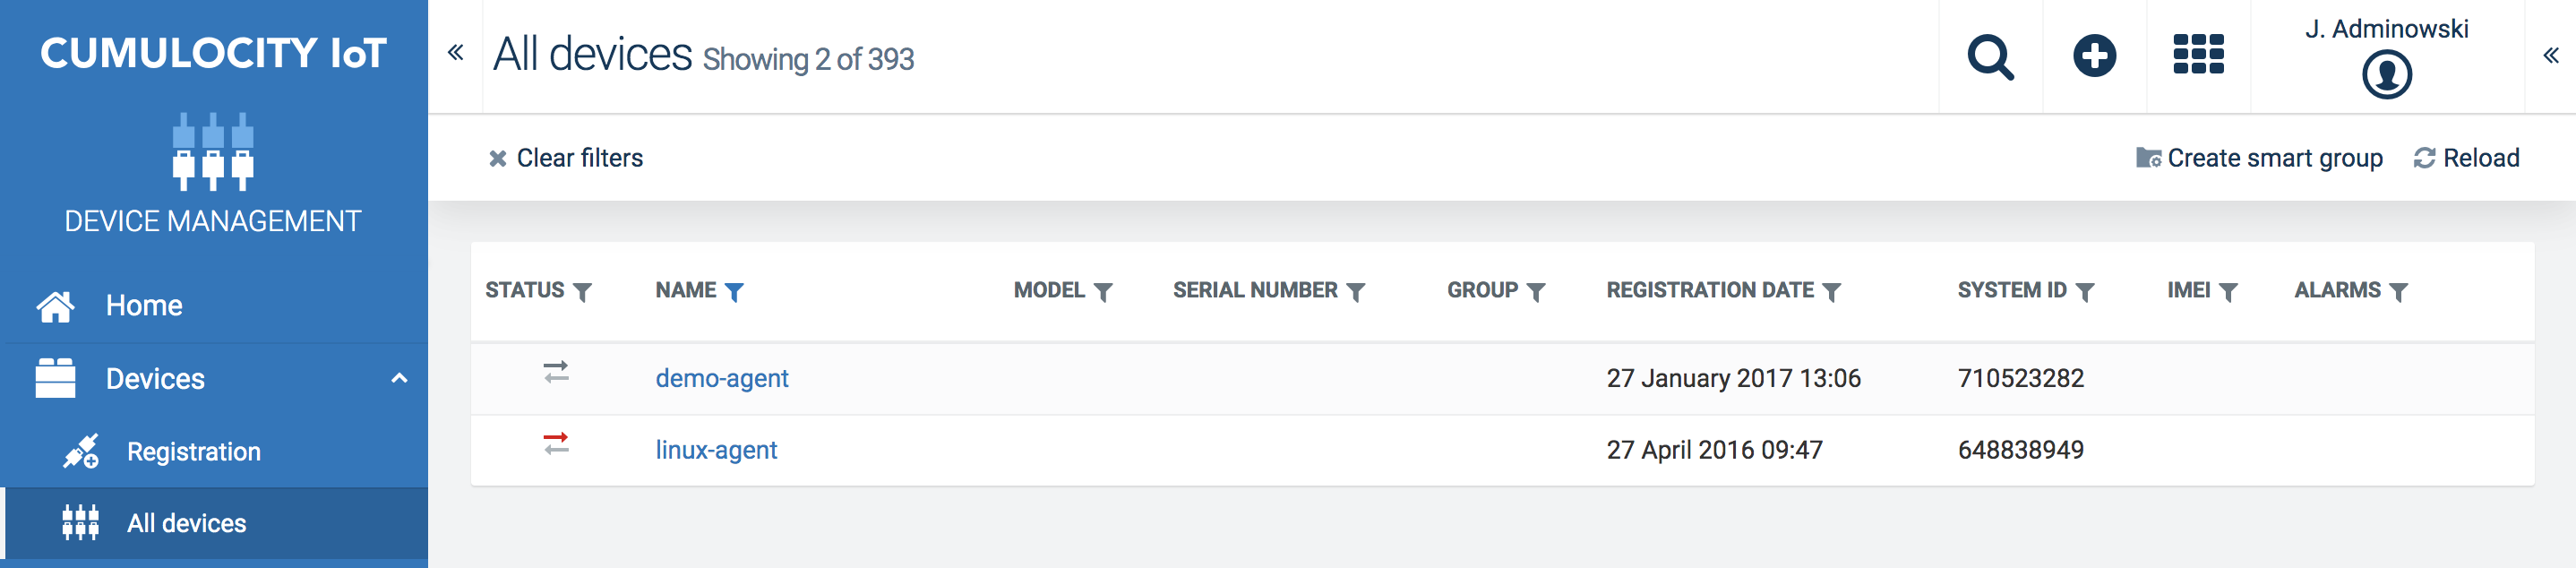
The Modbus agent is pre-registered in the post-installation phase. In the Device Management application, click All devices in the navigator and find the Modbus agent (called “linux-agent”) in the device list.
How to connect Modbus devices
For further information on connecting and managing Modbus devices, refer to Optional services > Cloud Fieldbus in the User guide.
Example: Connecting an OPCUA device
To connect an OPC/UA device in Edge, follow the steps below.
Preparation
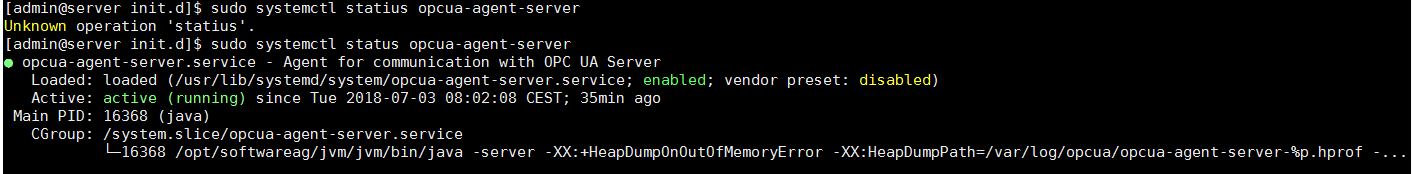
Check if the OPC/UA agent is running in Cumulocity IoT Edge (running on port 6670):
$ sudo systemctl status opcua-agent-server
If the agent is not running, start it with the following command:
$ sudo systemctl start opcua-agent-server
Check if the platform.url in /etc/opcua/opcua-agent-gateway.properties is pointing to the correct URL, which is http://localhost.
Registering the device
Next, you need to register a device in the Device Management application with the same device ID as the gateway.identifier in /etc/opcua/opcua-agent-gateway.properties, e.g. “opcua”.
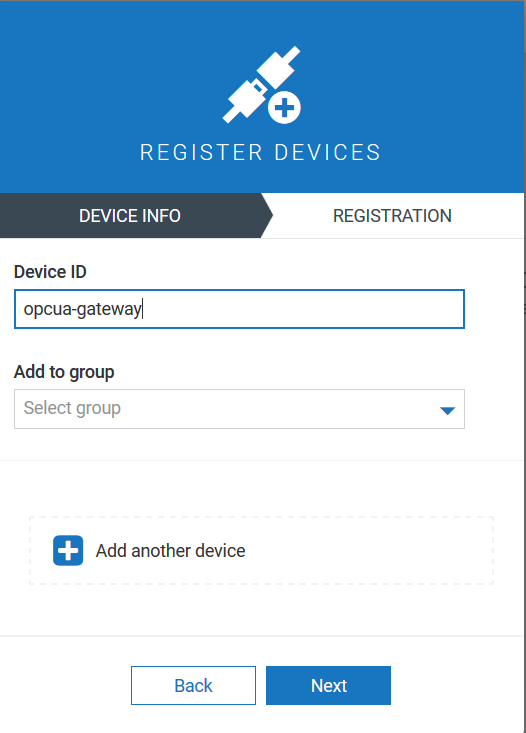
Follow the description in Device Management > Connecting devices in the User guide to register a device.
In the Device Management application, click All devices in the navigator and find the OPCUA device in the device list.

For further information on managing and configuring OPCUA devices, refer to Optional services > Cloud Fieldbus in the User guide.
Connecting to the Cloud
Cumulocity IoT Edge provides the option to upload Edge data to a Cumulocity Cloud account selectively (note that you first need to create a Cloud account).
You can share the following data:
- devices (and more generically, managed objects)
- events
- alarms
- measurements
Important: Data Broker in Cumulocity IoT Edge does not support synchronization of the operations.
Navigate to Data connectors if you would like to send data to the Cloud account.
Navigate to Data subscriptions in your cloud account to receive the data from Edge.

For details on sending and receiving data in Cumulocity refer to Enterprise Tenant > Using the Data Broker in the User guide.
Realtime analytics using Apama
Introduction
You can add your own real-time analytics to Cumulocity IoT Edge using the Apama Event Processing Language.
Apama is a complete CEP platform. It contains a complex event processing engine and a comprehensive set of tools to develop, integrate, and deploy event-driven applications.
With Apama you can
- monitor rapidly moving channels of events from multiple sources
- detect and analyze events and event patterns of interest
- respond to them in real time
For further information refer to the Apama guide or see the topic Developing Apama Applications in EPL in the Apama documentation for full details.
Uploading a custom Apama CEP rule
In Cumulocity, users can configure their own custom rules bases on their business needs. These custom rule files can be uploaded to the platform which in turn is injected as a monitor in Apama.
The following example shows how to upload a custom mon file to Cumulocity.
-
First create a custom mon file, as shown in our example for measurements. This sample custom rule creates an alarm for every measurement of type “c8y_SpeedMeasurement” where the “speed” value goes beyond 600.
using com.apama.cumulocity.Measurement; using com.apama.cumulocity.Event; using com.apama.cumulocity.Alarm; monitor SampleMonitor { action onload { monitor.subscribe(Measurement.CHANNEL); on all Measurement() as measurement { Event newEvent := new Event; newEvent.source := measurement.source; newEvent.type := "Event in Edge 9.0.x"; newEvent.time := currentTime; newEvent.text := "test custom smart rule using apama CEP - in Edge 9.0.x"; newEvent.params["First_String"] := "Execute the plan discussed"; newEvent.params["Second_String"] := "Some kmat Random key-value param"; send newEvent to "CumulocityIoT"; if measurement.measurements.getOrDefault("c8y_SpeedMeasurement").getOrDefault("speed").value > 600.0 { send Alarm("", "My_Alarm_MAJOR_Version_1", measurement.source, currentTime, " Test in Edge 9.0.x MAJOR Alarm", "ACTIVE", "MAJOR", 1, new dictionary<string, any>) to Alarm.CHANNEL; } else { send Alarm("", "My_KMAT_Alarm_Minor_Version_1", measurement.source, currentTime, "Test in Edge 9.0.x Alarm MINOR", "ACTIVE", "MINOR", 1, new dictionary<string, any>) to Alarm.CHANNEL; } } } } -
In the Administration application, open the Own Applications page from the navigator. Click Add application and in the upcoming window click Upload custom Apama rule.

-
Upload the Apama monitor file (.mon) previously created. After successful upload your rule will be deployed as a custom Apama application.
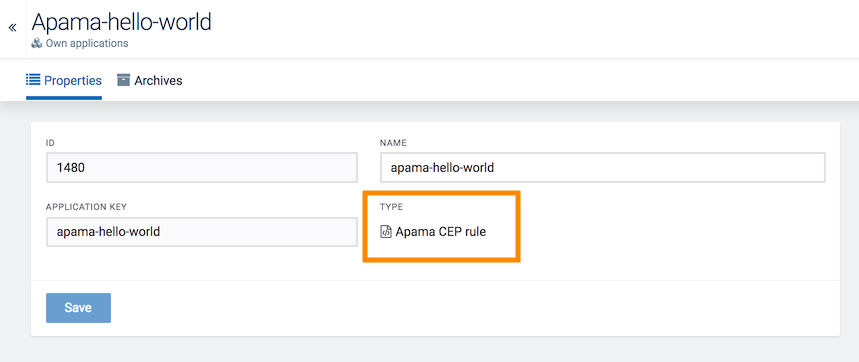
-
In the Own Applications page, you can now open your custom Apama application with type “Apama CEP rule”.
Monitoring alarms and events
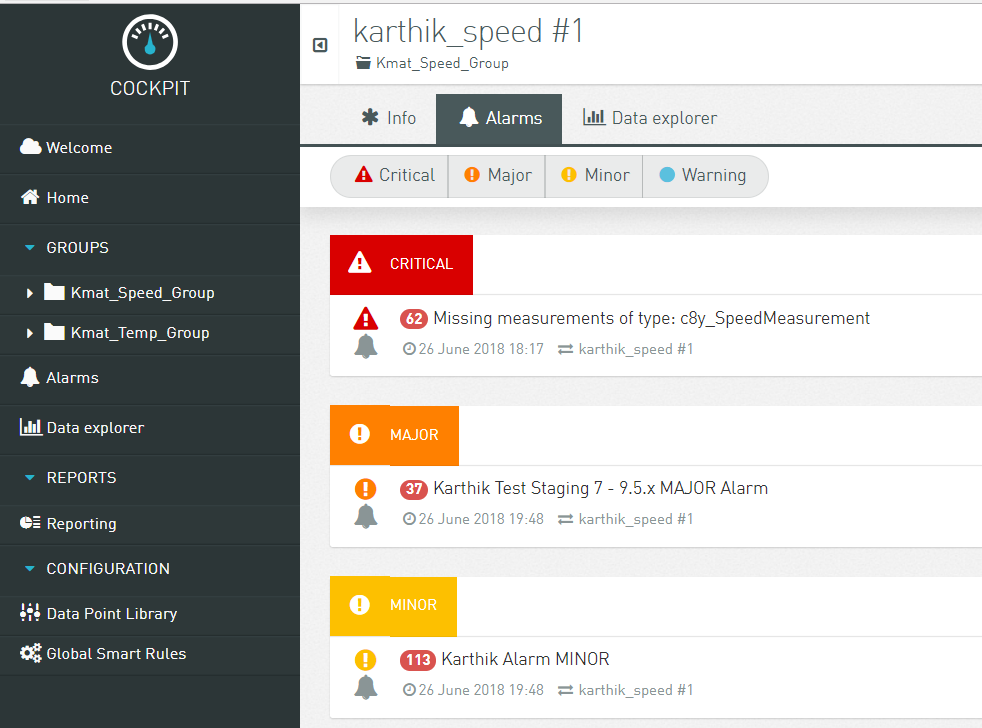
In the Cockpit application, select the device sending measurements in the Groups menu in the navigator and switch to its Alarms tab (since the custom rule written was such that it creates alarms).
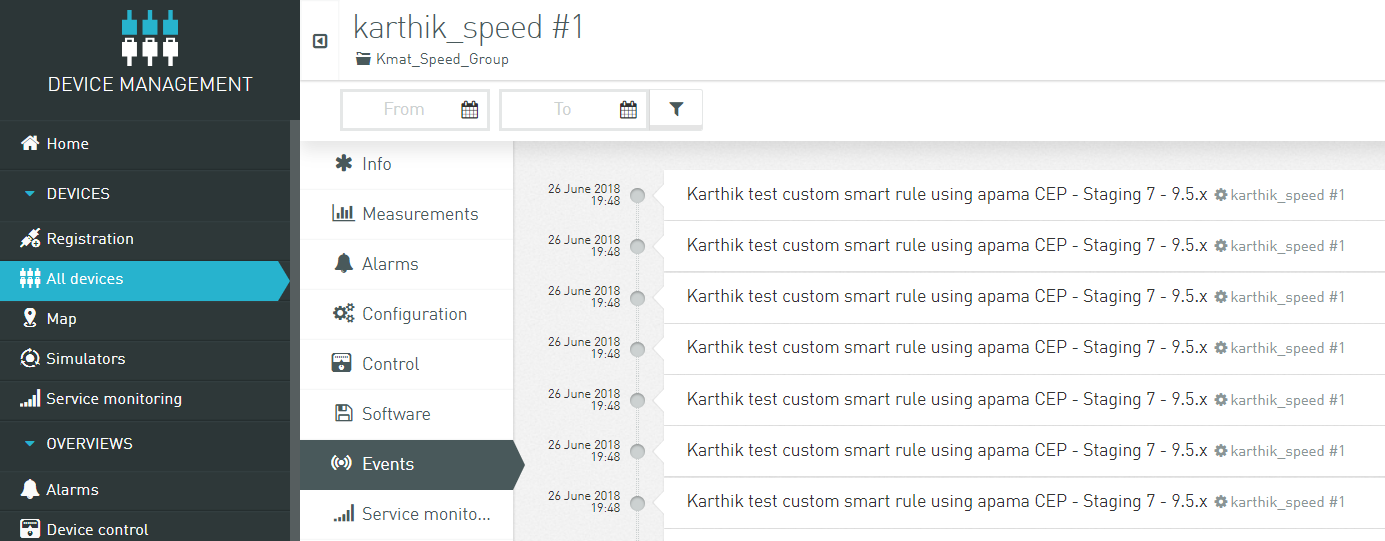
In the Device Management application, click All devices in the navigator. Select the device from the device list and switch to the Events tab, to see the events sent by Apama as per the custom CEP rule.
Apama Analytics Builder
Cumulocity IoT Edge includes Apama Analytics Builder. Analytics Builder provides self-service analytics to the domain experts, allowing web-based drag & drop of streaming analytics applications.
You can access Apama Analytics Builder from the Cumulocity IoT app switcher:

See Apama Analytics Builder for Cumulocity IoT for the complete documentation.