General
Breadcrumb navigation is displayed incorrectly
If an entity is assigned twice to another entity the breadcrumb navigation can be only displayed correctly for one of the assigned entities.
Example:
Two lines with the same name “Production Line” (the profile name “Line Profile” will not be taken into account) are assigned to the same site. One line is subordinate to an area.
- Site: “Darmstadt Hall 2”
- Line: “Production Line”
- Machine: “Drilling 1”
- Line: “Production Line”
- Area: “Innovative Production”
- Line: “Production Line - Line Profile”
- Machine: “Drilling 2”
- Machine: “Drilling 3”
- Line: “Production Line - Line Profile”
In this case, it may happen that the breadcrumb navigation for “Machine: Drilling 3” looks like this:
“Dashboard > Darmstadt Hall 2 > Production Line > Machine Dashboard”
instead of
“Dashboard > Darmstadt Hall 2 > Innovative Production > Production Line > Machine Dashboard”.
Where do I find values older than 60 days?
The standard retention for data on Cumulocity IoT is 60 days. To save OEE data longer than 60 days, you can change the data retention in your platform settings. For more information on how to change the retention rules, see Administration > Managing data in the User guide.
Which roles are distinguished by the application?
Default user
The default user has access to:
- Machine Park Overview
- Machine Dashboard
- Andon Board
The default user needs a role assigned with the Oeeconfigurator Read permission enabled.
Admin user
Only admin users are allowed to change and create machine and line profiles. Admin users have access to:
- Organization, Profiles, Calculation categories under Administration
- Machine Park Overview
- Machine Dashboard
- Andon Board
The admin user needs a role assigned with the Oeeconfigurator Admin permission enabled.
Calculation
How accurate are the calculations of the OEE application?
After the OEE values are calculated, they are then checked for consistency and plausibility. No deviations greater than 0.0002 are allowed. However, it should be considered that OEE is fundamentally a statistical value.
Are resolved alarms still considered in the calculations?
The calculation does not take resolved alarms into account.
Can the Actual Production Amount (APA) be calculated without using the Actual Production Time (APT)?
If the APT is not calculated using a machine event, it is not used to calculate the APA. Instead, the APA is split from event to event.
APA is not calculated based on machine status event (APT).
The quality of a workpiece is not met but it is accounted to the Actual Quality Amount.
Short fluctuations of the quality status during discrete manufacturing can lead to a miscalculation of the Actual Quality Amount (AQA), see picture below.
Example:
Workpiece A represents a milled part. At the beginning it was milled correctly but in the middle of the machining process the parameters for quality were no longer met. Only at the end of the machining process the milling process was carried out correctly again. As a result, the entire workpiece should actually be declared insufficient. However, it is not. This is the result of a time-related calculation, which aims at a generic applicability for both discrete manufacturing and process manufacturing. The problem can be avoided by deriving the quality from workpiece-based events. Ideally, an event for each workpiece is generated by the processing machine itself or a following measuring station with the content “OK” or “not OK”.
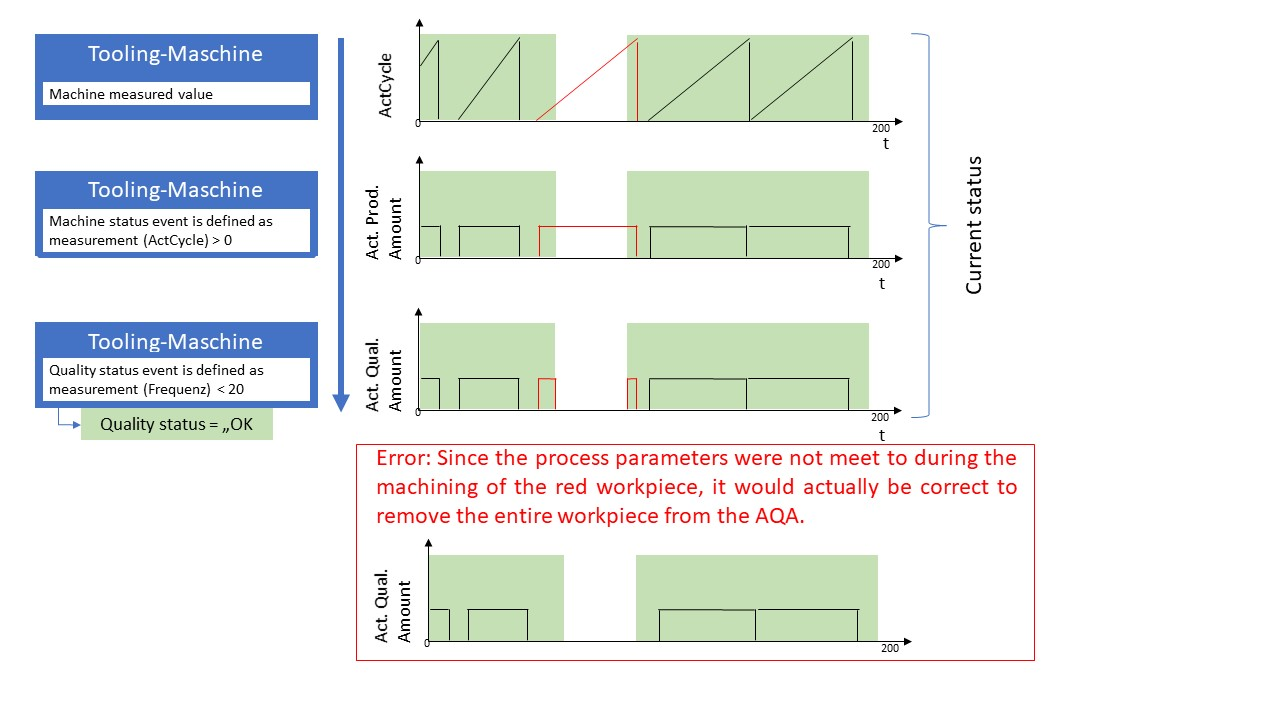
If the quality status is “not OK” for a significantly longer period of time, this error is less pronounced.
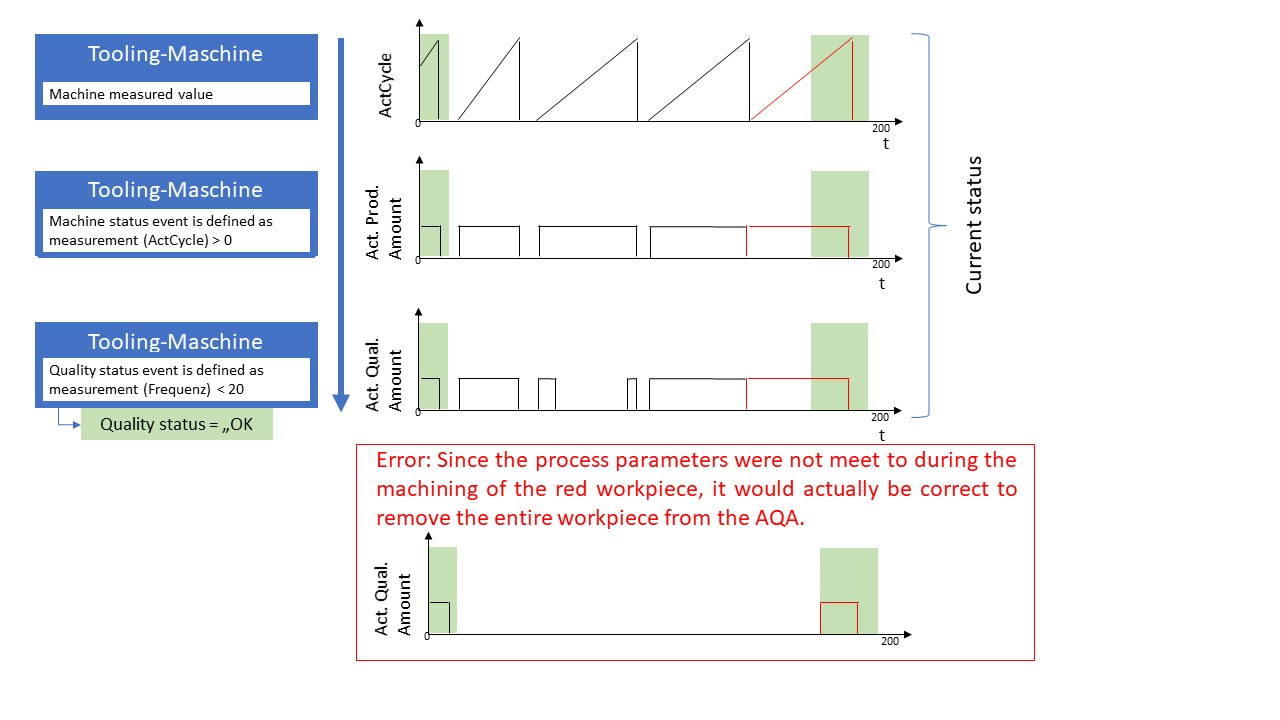
This problem must also be considered when creating line profiles.
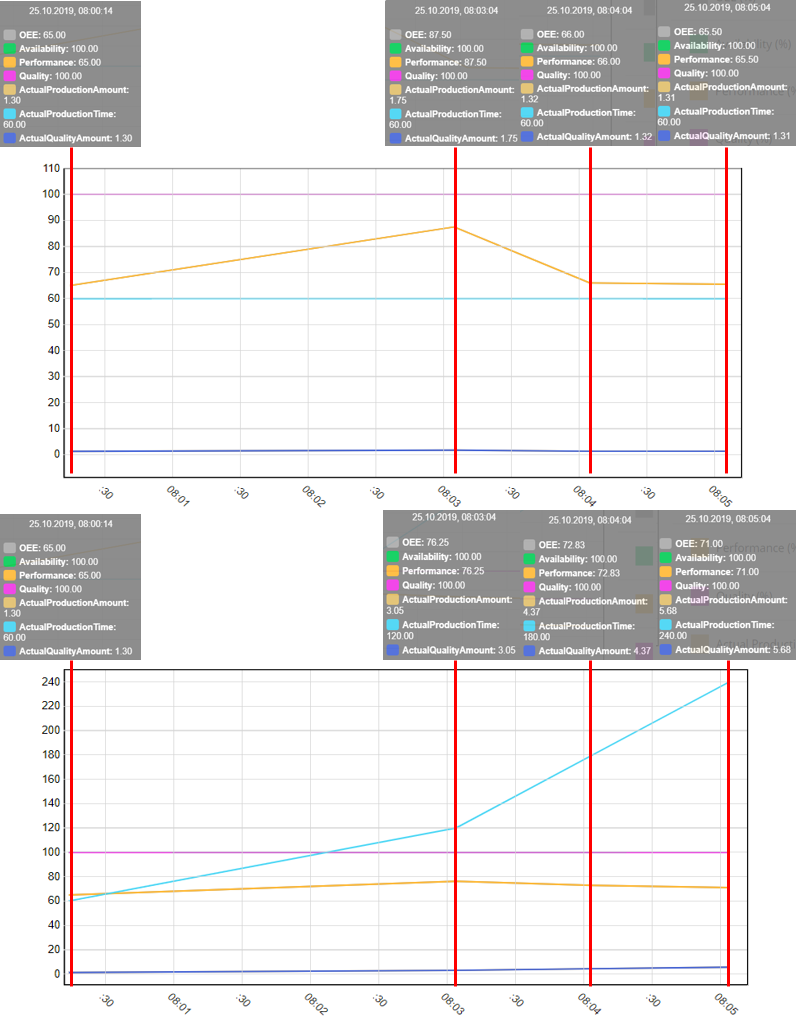
Does the loss of connection affect the OEE calculation?
If the connection is interrupted and no machine data is received for an interval, this interval is ignored and the OEE calculation is not falsified.
Example:
The resolution interval is 60 seconds. For the intervals 08:00:14-08:01:14 and 08:01:14-08:02:14 no machine data was send to the application. Therefore, no calculation was triggered. These intervals are thus ignored in the graph, as you can easily deduce from the values of Availability and Actual Production Time. The red bars in the image indicate that a new calculation is triggered.
If I recalculate the values myself I get different values.
If the calculation is attempted on the basis of the input parameters (for example Actual Production Time 60,3454 minutes), the following must be observed:
- The algorithm of the pathways must be followed.
- The calculation is done on a millisecond basis (2019-12-09T10:07:04.773).
- No rounding is performed during the calculation in order to not multiply rounding errors. Only when the data is saved it is rounded to 4 decimal places, as can be seen when the data is exported (in the UI, it is rounded to 2 decimal places).
How are measurements of lines that work in parallel calculated?
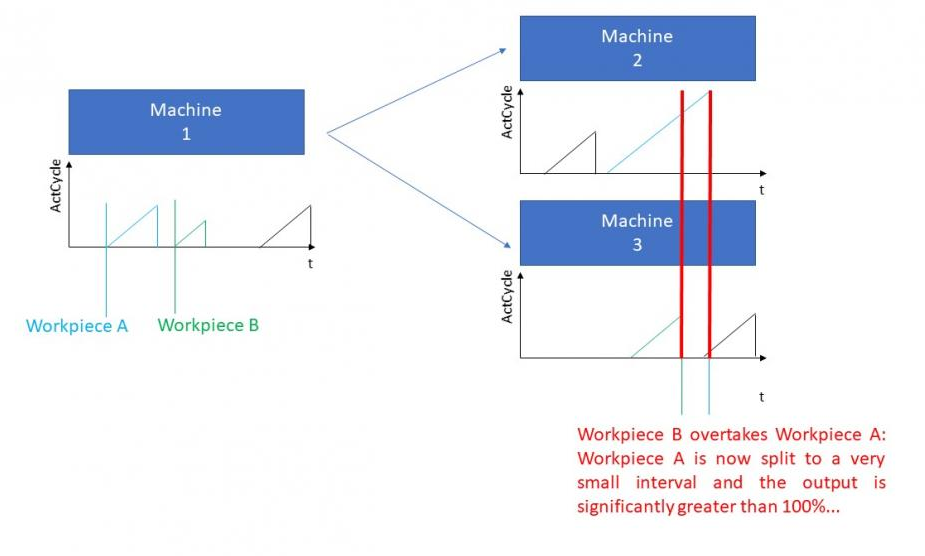
Example
Initial situation:
Machine 1 is processing workpieces, this processing step only takes a short time. The workpieces completed by machine 1 must go through a second, time-consuming machining step. This second machining step is carried out by 2 machines (machines 2 & 3). The workpiece is always fed to the machine with the lowest capacity.
Problem:
If the Performance is determined on the basis of the two machines working in parallel, it can happen that the Performance reaches values greater than 100%, see figure on the left.
Solution:
- The Performance is determined on the first machine, if possible.
- The smallest of the four defined intervals of a profile is x times larger than the machining time of a workpiece. This way the values average again. However, this means that the 10 minutes interval display in the Machine Park Overview most of the time shows incorrect values.
- The Cumulocity IoT OEE application created a line profile and used machine profiles, whose calculated values are then used in the line calculation see also Administration > Calculation example of a line profile.
Alternative starting situation:
If after machine 2 & 3 the workpieces would converge again in machine 4, these machines could be used for bottleneck analysis and there were no performance issues.
Why are there implausible values shortly after changing and saving the profile?
After entering a profile (via the profile modificator), all OEE machine statuses are set to “true” until the first measurement is sent from the machine. For example, the machine is up and running, so the Availability is 100%. We recommend you to wait some time after editing and saving a running profile, in order to produce plausible calculations again.
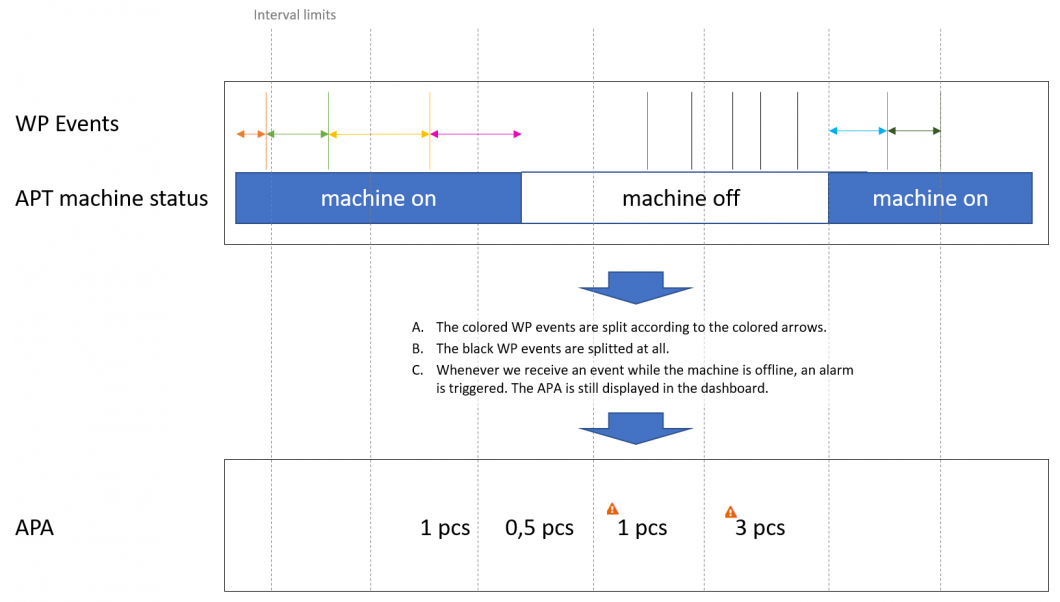
What happens if the machine reports a produced part although its status is “not producing”?
If the information of a produced workpiece comes in while the machine is online, it will be split, see the image below (colored lines and arrows). If the machine is not producing and you receive a workpiece (WP) event, the first event is still split to the “machine on” time (pink), but the following events (black lines) are not split and just counted into the interval, in which they appear. Since it is not reasonable, that workpieces are produced while the machine is offline, alarms for the regarding interval will be raised. The produced amounts are still displayed in the machine dashboard and are still taken into account for the graph.
Why does the Ideal Amount change?
The Ideal Amount is calculated based on the values you have entered for the workpiece while creating the profile.
The displayed Ideal Amount in the chart of the machine overview can change over the time, if you have activated the usage of a production plan.
Another reason can be that you have changed the resolution. The displayed Ideal Amount is always calculated for the corresponding resolution.
Examples:
You have entered “1.1 pcs/minute” in the Workpiece section, while setting up the profile.
- If you choose the resolution “1 mins” on the machine overview the displayed Ideal Amount for an interval will be 1,1 pcs.
- If you choose the resolution “10 mins” on the machine overview the displayed Ideal Amount for an interval will be 11 pcs.
Can the calculated OEE values be used in a Cockpit widget?
For more information on how to use calculated OEE values in Cumulocity IoT Cockpit widgets see FAQ > Cumulocity IoT
Machine profiles
What are the effects of a name change of a profile?
If you change the profile name, the corresponding profile can still be found by using the profile ID, which does not change. The name of the c8y_child_device does not change either.
Dashboards
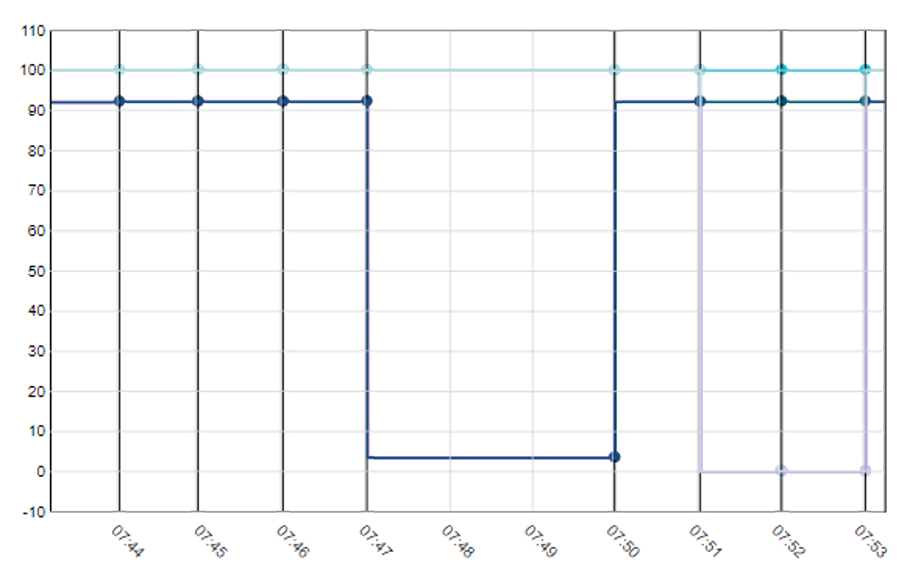
Does the OEE application consider missing data points?
Connection lines are displayed for all consecutive points in the diagram. This happens even if values are “missing” between the points.
In the example below the selected calculation interval is ‘1 minute’. There are no values received for 07:48 and 07:49, but as there are values for 07:47 and 07:50 these two points were connected by a line. This line starts from the value of 07:47 and extends to the value 07:50.
What do alarms in a Machine Dashboard mean?
If an alarm occurs in an OEE Machine Dashboard, this indicates that the mapping needs to be revised and adapted again. If this has been done, no further alarms should occur. Nevertheless, it is recommended to clear the alarm in the device details of the profile in the Cumulocity IoT Device management application. This is the only way, the parameters displayed in the alarm will be renewed if a similar alarm occurs. The time stamp is also updated automatically without further action.
An alarm has been raised but I can’t see it in the dashboard
Alarms raised for a device will not be shown for the child device (OEE profile) and therefore not displayed on the machine dashboard.
Only alarms raised for the child device (OEE profile), for example an APAMA calculation error, will be shown in Cumulocity IoT for the child device and thus also in the Machine Dashboard.
Why does the Machine Dashboard not show all requested data for longer time spans?
That is not a calculation error, this is only an UI issue. All values are calculated and are stored in the platform. The UI does not show all values as the amount is too high.
To see all values, reduce the time span or choose a lower resolution, for example a longer interval.
Alarms
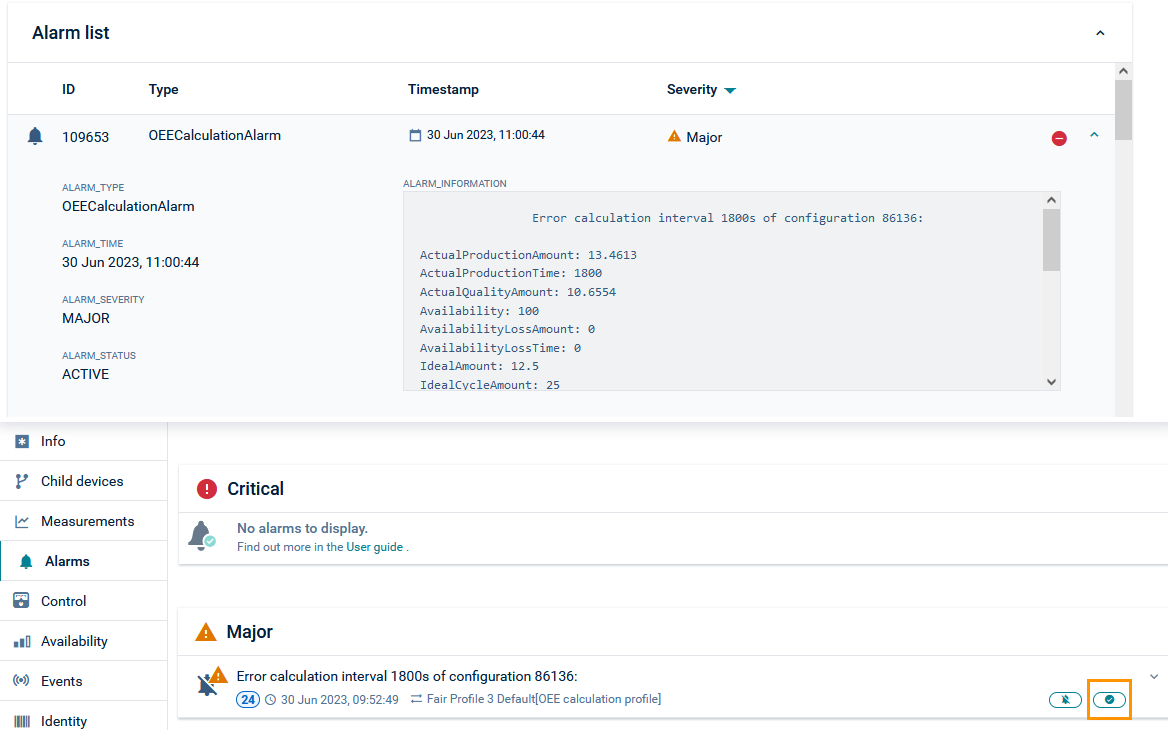
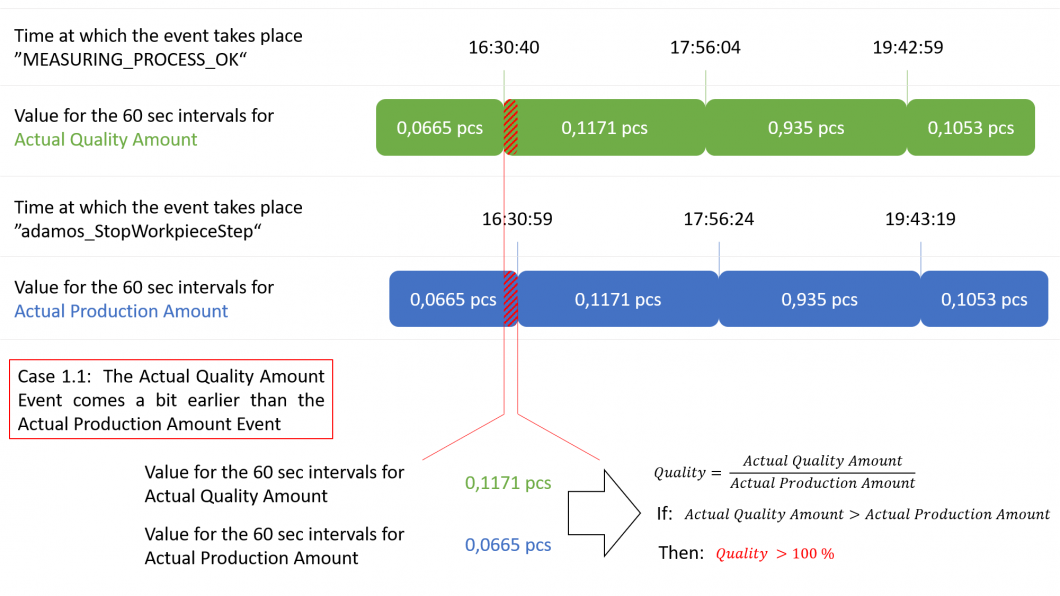
What raises the “implausible calculation” alarm?
The “implausible calculation” alarm can be caused by many reasons. The most common one is a partly inconsistent mapping.
The following example describes an “implausible calculation” alarm with focus on quality (%).
The mapping rule for the Actual Production Amount is: countEvents("{{deviceID}}",“StopWorkpieceStep”) * 10. When this measurement appears, it is possible to deduce that 10 workpieces have been created.
The mapping rule for the Actual Quality Amount is: countEvents("{{deviceID}}",“MEASURING_PROCESS_OK”) * 10. When this measurement appears, it is possible to deduce that those 10 workpieces are good quality.
The problem is explained in the image below.
If events do not occur simultaneously, minor inconsistencies may occur. Further information on the solution for this problem will follow.
Production & Shift plan
The optional Shift and Production plans control the way the OEE calculation is performed. They provide the baseline for the Availability and Performance calculation. More information about Shift and Production plans can be found in Administration > Working with shift plans & Administration > Enable a production plan.
What happens if a profile uses the production plan, but no production is deposited for a timespan?

If you did not deposit a production plan in your Cumulocity IoT OEE profile, the platform cannot execute a calculation. Therefore, the platform displays an alarm on the Machine Dashboard.
Cumulocity IoT
Can the calculated OEE values be used in a Cockpit widget?
- Calculated OEE values are stored as measurements linked to the managed object of the OEE calculation profile.
- Profiles are child devices of the machine for which they calculate the OEE.
- Calculated OEE values can be used in any Cockpit widget like the regular machine measurements by selecting the OEE calculation profile as the source device, and then selecting the OEE measurement to be displayed, for example the final OEE or one of its components like Availability.
Can I use umlauts in measurement names?
When naming a measurement, make sure not to use umlauts in the measurement name.
Where can I find the device and profile ID?
You can find the device ID and profile ID at the end of the URL shown in your browser when accessing the Machine Dashboard. The device ID comprises of the first seven numbers at the end of the URL. The remaining nine numbers are the profile ID.
The example below shows an exemplary URL with the placement of both device ID and profile ID.
https://<<tenant>>/apps/oee/index.html#/machine_dashboard/<<device ID>>/<<profile ID>>
Why does a measurement/event/alarm in the OEE application have multiple timestamps?
The first timestamp describes the creation time. It is the time when the specific measurement/event/alarm has been created for the first time.
The second timestamp describes the actual occurrence of the OEE calculation. This timestamp is used for the OEE calculation and should be considered when working with measurements/events/alarms in Cumulocity IoT.
How do I address measurements and events correctly?
Property names used for fragments as well as series names must not contain a leading dollar (“$”) sign and should not contain the following characters: “.”, “,”, “(“, “)”, “[“,”]”,”@”,”*”,” ” (whitespace). This is required to ensure a correct processing and visualization of measurement series on graphs.
Umlauts are not permitted when naming measured values.
For more details on how to correctly set up property names and series names see Inventory > Inventory API in the Cumulocity IoT OpenAPI Specification.
Where do I find the calculated OEE measurements of a profile in the platform?
- Go to the parent machine in the Device management application and open the child devices of the machine.
- The profile is a child device of the machine. You can identify it via the profile name. If the profile name is “XYZ” for example, then the child device will be called “XYZ[OEE calculation profile]”.
- Navigate to the Measurements tab of the child device. You should see the OEE measurements.
Alternatively, you can also use the built-in search in the Device management application to search for the name of the profile.
How long does it take to see OEE calculation results?
After creating and activating a profile, it might take some time to see the first OEE calculation results. For each interval the values for Availability, Quality and Performance must be calculated before an OEE value is calculated. Availability, Performance, and Quality are calculated when the interval is completed. This is determined through the reception of data relevant for the calculation with a timestamp after the end of the interval. Only after these calculations are done the interval can be closed and the final OEE result can displayed.
What is the simplest profile to define?
To get started with the OEE application, you must create a profile to start the calculation. To create a very basic profile, you can use the following settings:
- Profile: Enter a Profile name
- Machine: Enter a Machine location
- Workpiece: Select a quantity. For this example the value is 1 pcs per minute.
- Resolution: Enter an interval and a unit. For this example the interval is 10 minutes.
- Computation: Select a calculation method. For this example it is PPQ.
- Matching: Select the desired calculation formula.
For this example the values could be the following:
- Actual Production Amount - Depending on your machine/simulator and the data it is sending, this could be something like counting events (for example “Piece_Produced”)
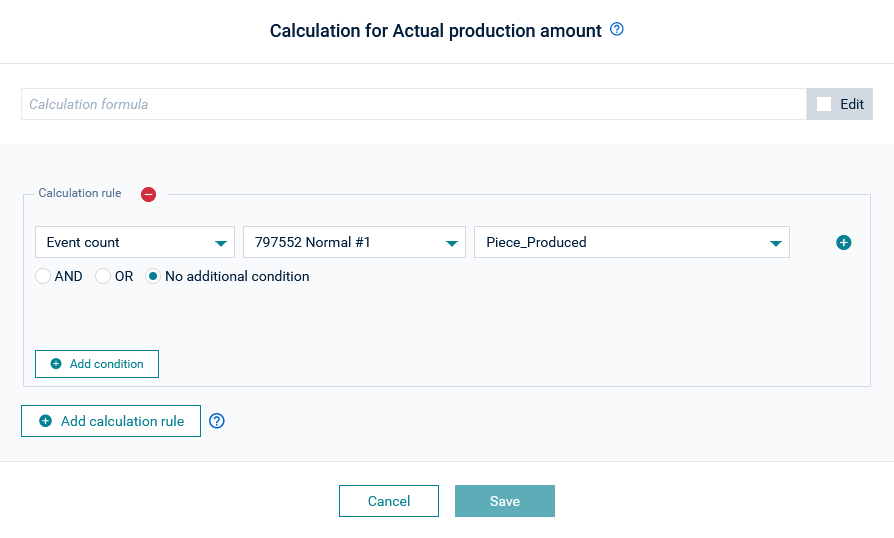
- Actual Production Time / Actual Quality Amount - To keep the profile simple, you can define the values to be 100% by comparing two fixed numbers, for example, “1 = 1”.
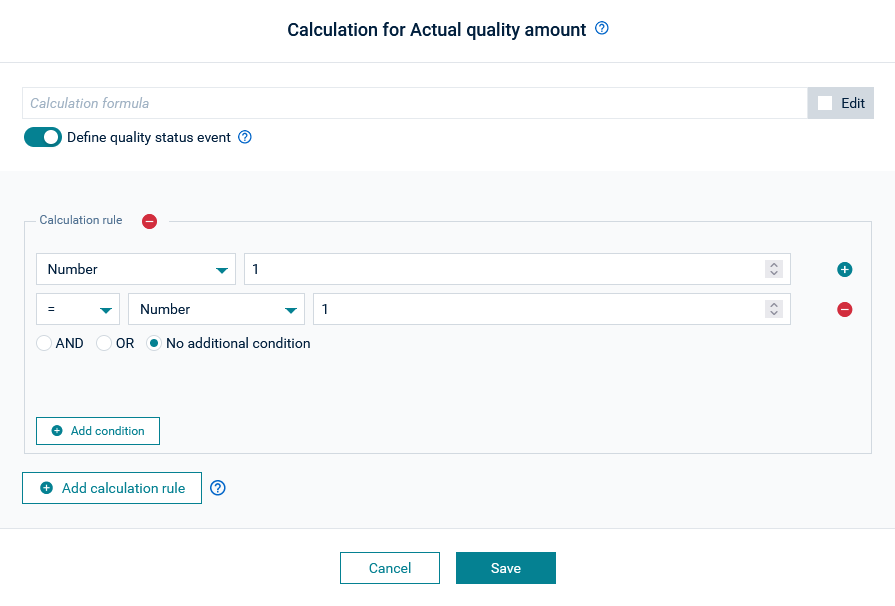
- Actual Production Amount - Depending on your machine/simulator and the data it is sending, this could be something like counting events (for example “Piece_Produced”)
- Short stoppages: We recommend to disable the tracking of short stoppages. For this example the tracking is disabled.
- Goals: Define the goal value in percent.
For details see Administration > Creating machine profiles.