This section describes how to offload data from the Operational Store of Cumulocity IoT to a data lake using Cumulocity IoT DataHub.
Info: You need configuration or administration permissions to work with offloading pipelines. See section Defining DataHub permissions and roles for details.
Configuring offloading jobs
Cumulocity IoT DataHub provides functionality to configure, manage, and execute offloading pipelines that extract and transform data from the Operational Store of Cumulocity IoT to a data lake.
Basic functionality
On the Offloading page you do the offloading management and monitoring tasks:
Selecting a Cumulocity IoT collection to offload
Defining and validating an offloading configuration
Saving, copying, or deleting an offloading configuration
Importing/exporting offloading configurations
Scheduling or manually triggering offloading executions
Viewing the history of offloading executions
On this page, you find in the action bar controls for adding a collection for offloading, reloading the list of configurations, and importing/exporting configurations. Below this section you will find the current set of configurations.
The following steps describe how to set up and start an offloading pipeline.
Defining an offloading configuration
To define an offloading configuration, click Offload collection. In the dropdown box select one of the Cumulocity IoT base collections, which are:
alarms
events
inventory
measurements
In the case of the measurements base collection, you have to additionally specify the type of Cumulocity IoT measurements you want to offload to the data lake.
Click Confirm to continue with the selected collection.
Info: You can define multiple offloading pipelines for each Cumulocity IoT collection. For example, you can filter the alarms collection by different criteria with each one resulting in a separate pipeline. Be aware that each pipeline must create its own table in the data lake, i.e., you must choose distinct target table names for each offloading configuration.
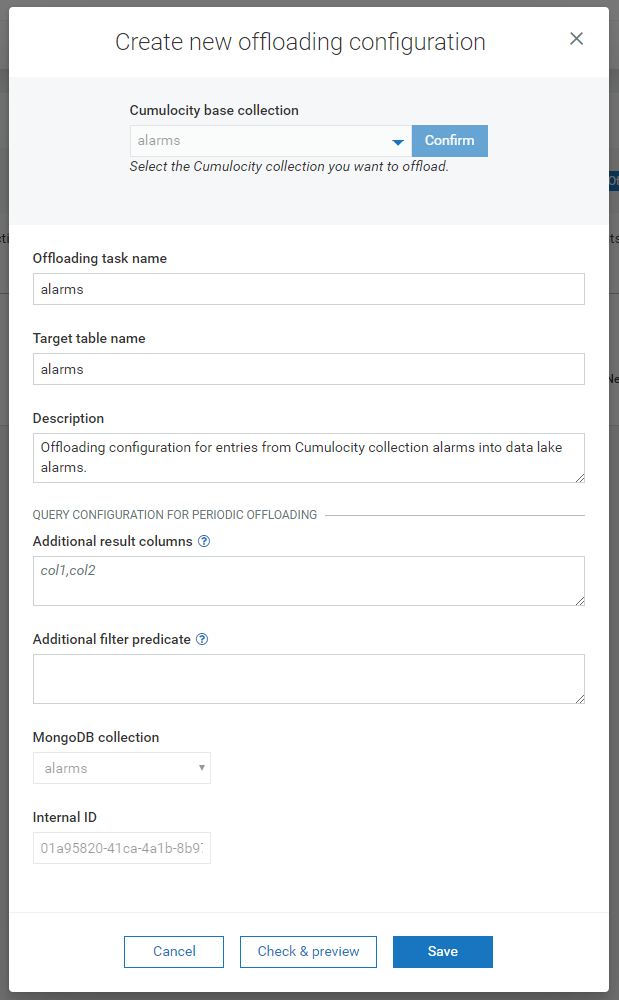
Once you have selected a collection for offloading, you have to specify the details of this offloading pipeline. The pipeline has default configuration settings, which you can modify according to your needs.
The settings whose meaning may not be obvious are equipped with a help icon. Click on the icon to get more information.
Pipeline settings
The Offloading task name is an identifier for the offloading pipeline. Even though it does not have to be unique, it is advisable to use a unique identifier for this task name.
The Target table name denotes the folder name in the data lake. In this folder the offloaded data is stored. In Dremio a table is created with the same name, pointing to this data lake folder. This table is used when querying the corresponding data lake folder.
The target table name must follow these syntax rules:
It needs to start with an alphanumeric character (letters and numbers).
It may contain alphanumeric characters, underscores (_) and dashes (-).
Each underscore or dash must be preceded by an alphanumeric character.
The name must be at least two characters long.
In the Description field, you can add a description for this offloading pipeline. The description is optional, but it is recommended to use it, as it provides additional information about the pipeline and its purpose.
In the Additional result columns field, you can provide a comma-separated list of additional columns or expressions you want to include. For each collection, the associated default set of data fields is extracted, which is available for each base collection. If you have added additional top-level fields while feeding data into Cumulocity IoT and you want to access them in your analytical queries, then you can specify them in this input field. For example, if you feed in measurements with the additional fields myCustomField1 and myCustomField2, you just need to enter “myCustomField1, myCustomField2” (without the quotes) into the input field to add both fields to the offloading configuration. If you only want to offload myCustomField2, just add “myCustomField2”. It is also possible to apply SQL functions on those fields, e.g. BTRIM(myCustomField1, '~') to trim leading and trailing ‘~’ from the text in field myCustomField1.
If you want to derive additional columns from nested content, you can specify the nested fields in the input field as well using the prefix src. and the path to the nested field. For example, if you have a top-level field someField with a nested field someSubField, add “src.someField.someSubField” as additional column. In the same way you can access nested arrays. If you have a top-level field someField with a nested array field someArraySubField, add “src.someField.someArraySubField[0]” as additional column to access the first array entry.
In the Additional filter predicate field, you can specify an additional filter for filtering the data before it is inserted into the data lake. Per default all entries in the collection are inserted; you can use the predicate to filter out entries you do not want to persist in the data lake. For example, you can filter out outliers or invalid values. The filter predicate is specified in SQL syntax, e.g., for the alarms collection the filter might be status='ACTIVE' AND severity='WARNING'. Filtering on custom fields is also possible, e.g. myCustomField2 >= 2020 for a numeric field.
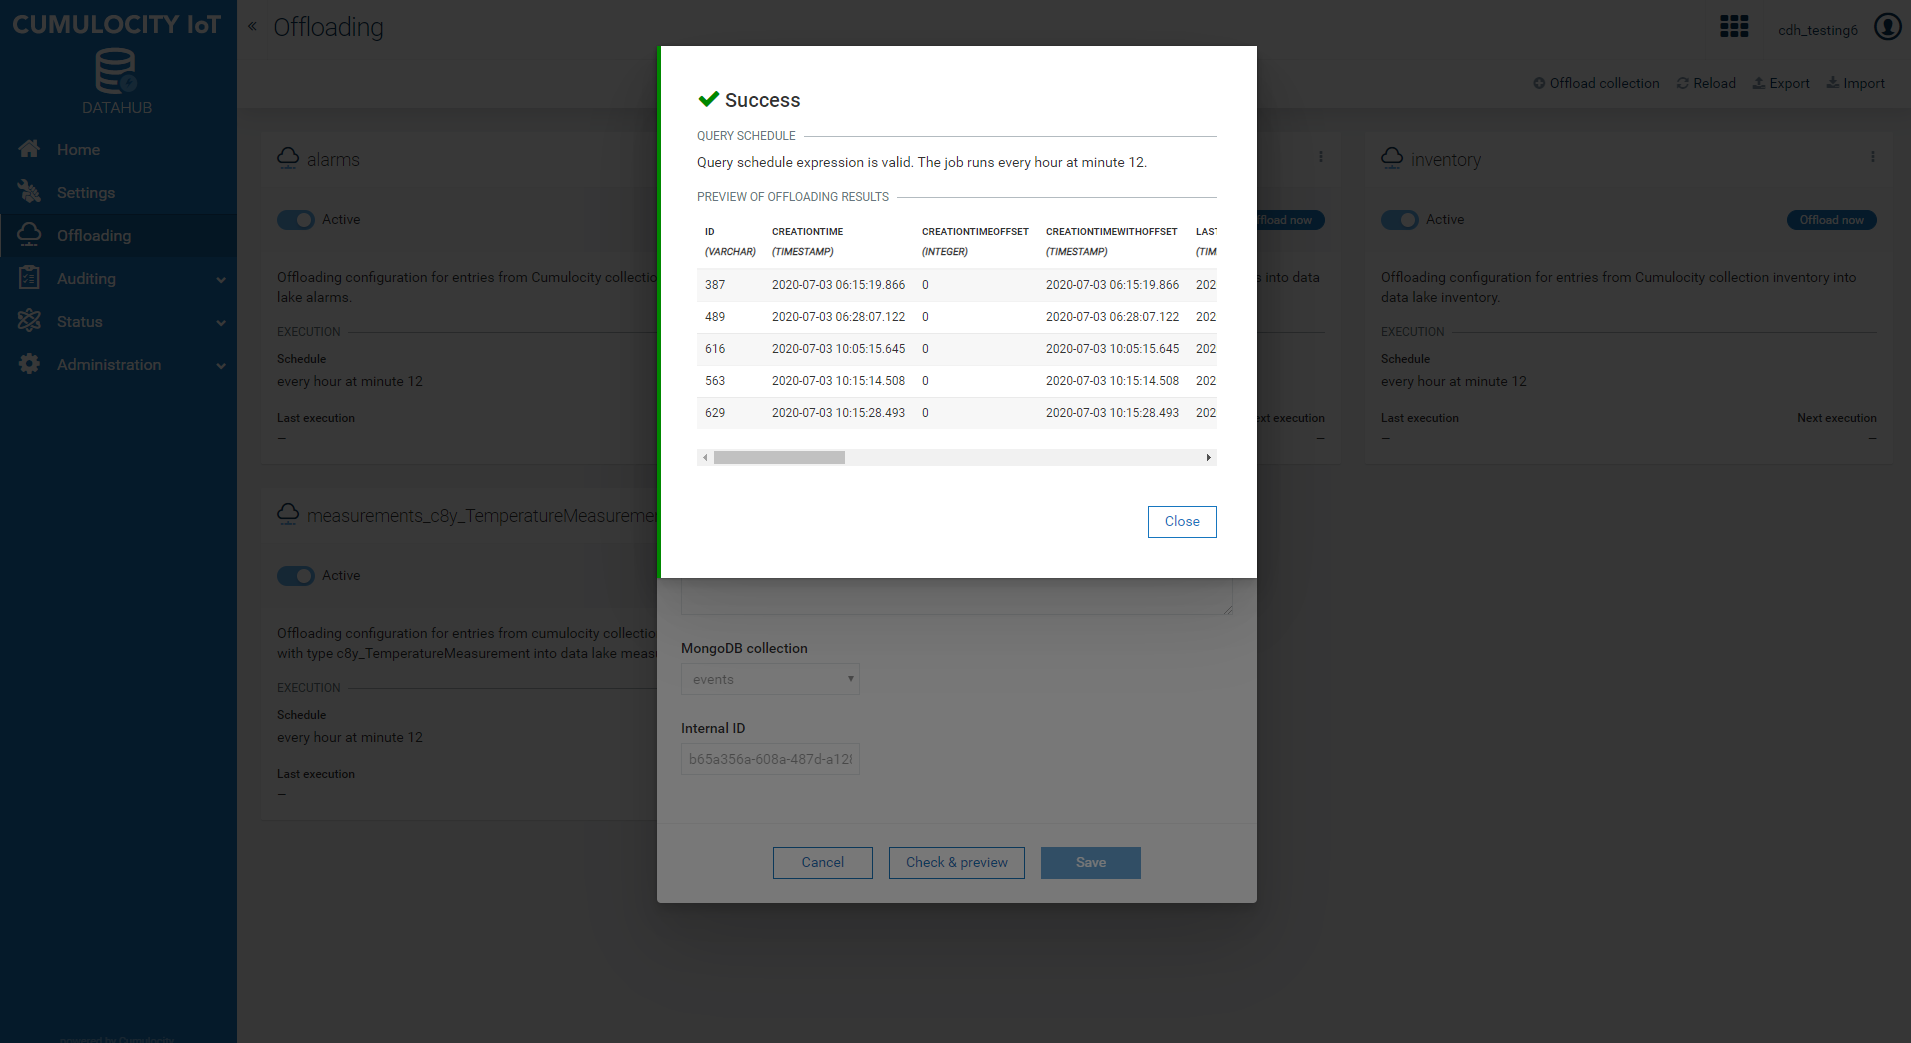
When working with additional result columns and filter predicates, you may want to inspect what the actual data that will be offloaded looks like. For that purpose, click the button Check & preview, which is at the bottom of the configuration form. First, the configuration is validated. If the validation fails, you will get an error description. For example, if you specify a non-existing UnknownColumn as an additional result column, you get an error message like Column ‘UnknownColumn’ not found in any table. If validation is successful, a sample of the resulting data is returned. The header row of the sample data incorporates the column name as well as the column type. Note that no data is permanently persisted to the data lake in this preview step. In addition to the query preview, you also get the schedule with which the offloading pipeline will be executed once it is started.
Once you have defined all pipeline settings, click Save to save the pipeline. Otherwise click Cancel to cancel the pipeline creation.
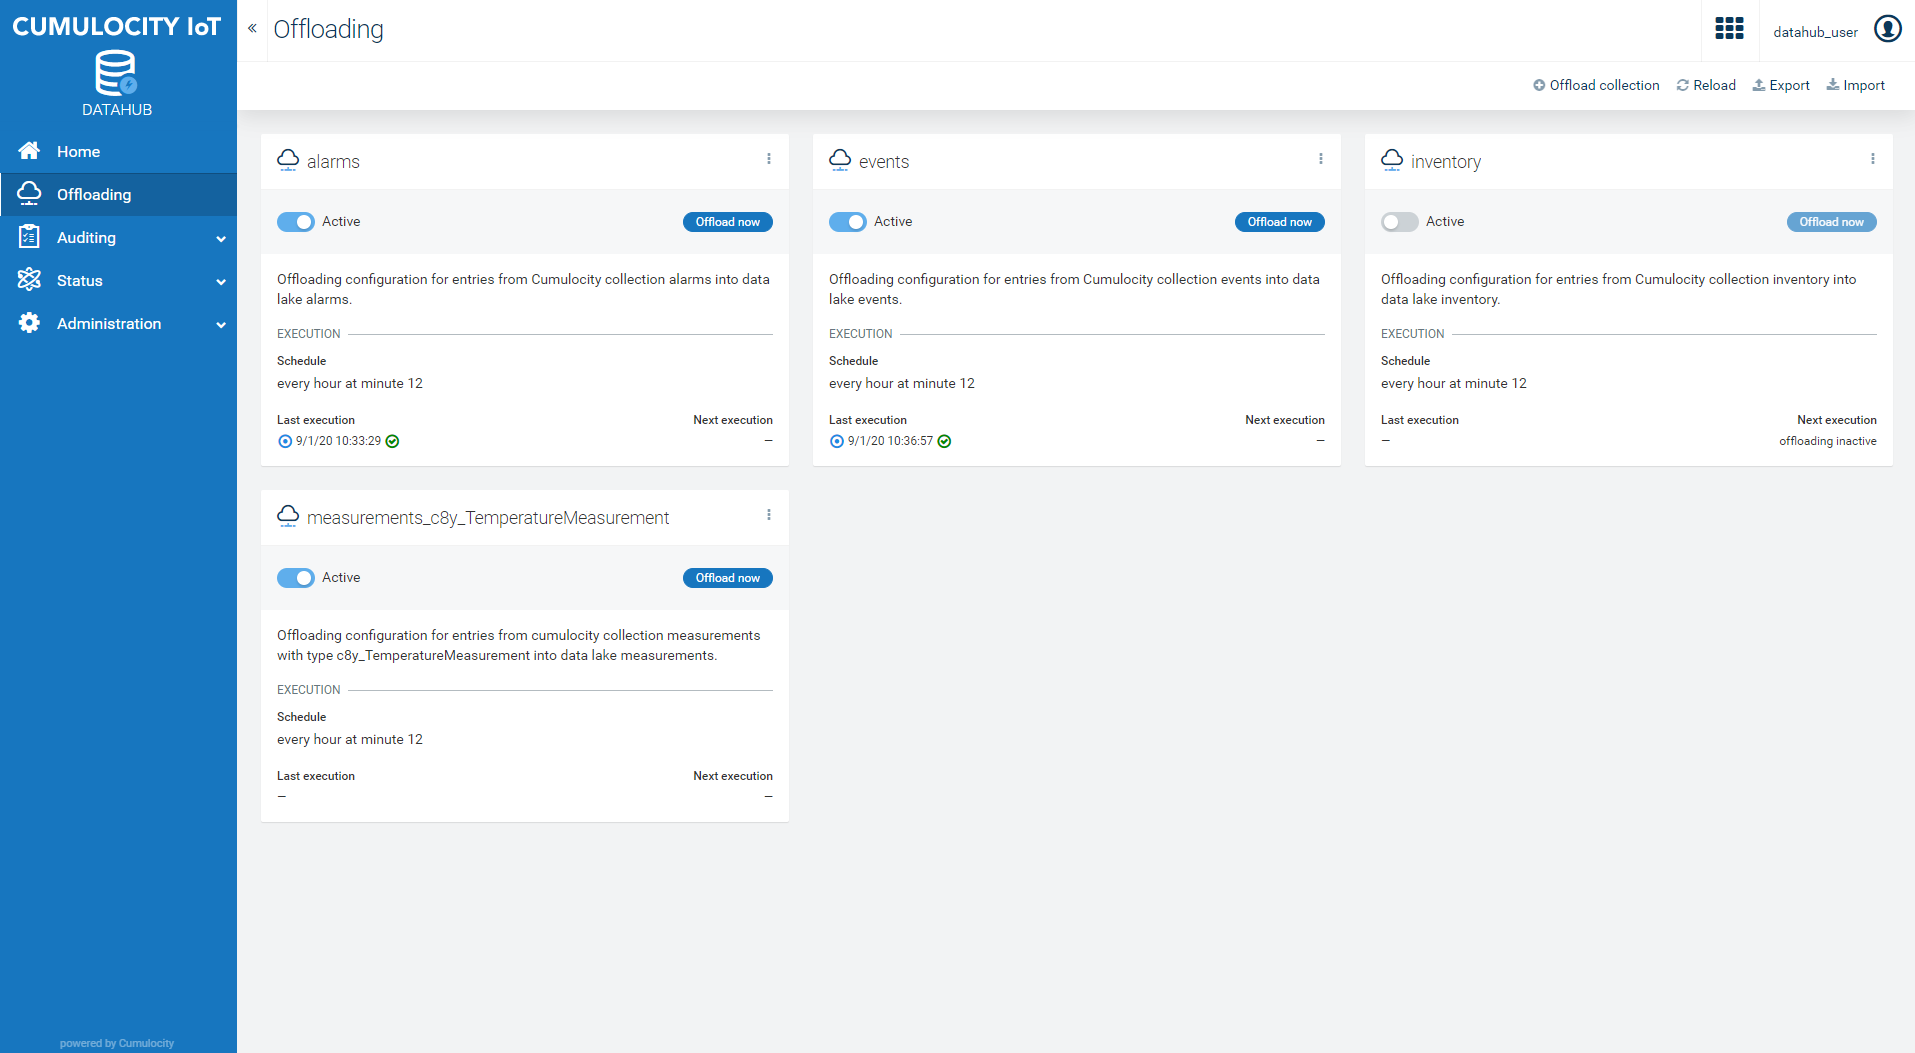
Overview of offloading pipelines
In the main panel of the Offloading page, you will find all defined pipelines as well as their current status. Each pipeline is shown as a card. In the action bar you will find the Reload button, which reloads the set of pipelines as well as their current status.
Each pipeline card has controls for managing the offloading process. Besides the description you have defined you will also find the schedule with which this pipeline will be executed once it is started, e.g., every hour at minute 6. In addition to that you will find for active pipelines the time of their last execution and the planned next execution.
Managing an offloading pipeline
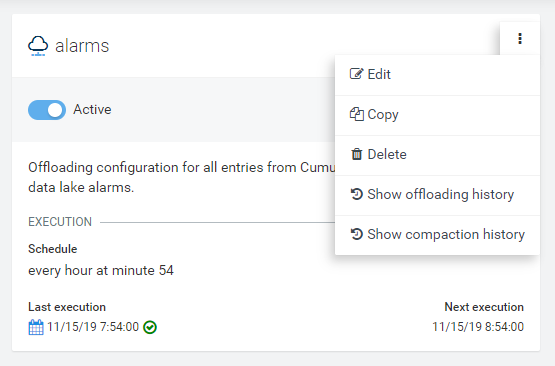
In the context menu of each configuration pipeline, you will find actions for managing and monitoring the configuration.
Editing an offloading pipeline
Click Edit to edit or view the current settings. Only inactive pipelines can be edited. Note that you cannot change the Cumulocity IoT base collection selected for this pipeline. Also note that changes to additional filter predicates, and additional result columns are not applied to already exported data, i.e. a change to the offloading pipeline only affects data to be exported in the future.
Copying an offloading pipeline
Click Copy to copy the current configuration. The new configuration is an identical copy of the selected configuration except for the task name and the target table, both of which will have a unique suffix appended. You can change the settings according to your needs.
Deleting an offloading pipeline
Click Delete to delete a configuration. Only inactive pipelines can be deleted. Data in the data lake which has already been exported by this offloading pipeline is not deleted. To delete the actual data in your data lake, you have to use the tooling offered by the data lake provider, e.g. AWS S3 Console or Azure Storage Explorer.
Monitoring an offloading pipeline
Click Show offloading history to examine the execution history of a pipeline. See section Monitoring offloading jobs for more details.
Importing/exporting offloading configurations
The import/export functionality allows you to copy offloading configurations from one DataHub instance to another one. Import/export solely includes the configuration of a pipeline; it includes neither the runtime status of a pipeline nor already exported data.
Export of offloading configurations
The action bar provides Export, which exports all offloading configurations. The button is disabled if no offloading configurations are defined. If you click the Export button, all offloading configurations are exported into a file. The file is located in the local download folder used by your browser.
Warning: You must not modify the contents of the export file as this might corrupt the import step.
Import of offloading configurations
The action bar provides the Import button, which imports offloading configurations from a file with previously exported configurations.
Click Import to open the import dialog. Either drop the file in the import canvas or click into the canvas to browse your computer to select the import file. Once the file is selected, a table with all configurations in the file is shown. For each entry, the table lists the task name, the description, and the internal ID of the original configuration. The IMPORT checkbox defines whether the configuration is imported or not. Duplicate entries cannot be imported and therefore the checkbox is not shown. An entry to import is a duplicate if an already existing configuration has the same target table or the same internal ID.
To import the selected configurations, click Import. Click Cancel to cancel the import process.
To change the import file, click the delete icon next to the file name and select a new file to import the configurations from.
Scheduling an offloading job
Once you have defined an offloading configuration and saved it, you can start the offloading pipeline.
Starting periodic offloading
Click Active to start the periodic execution of the offloading pipeline. The scheduler component of DataHub will then periodically trigger the pipeline.
The initial offload denotes the first execution of an offloading pipeline. While subsequent executions only offload data increments, the initial offload moves all data from the Operational Store of Cumulocity IoT to the data lake. Thus, the initial offload may need to deal with vast amounts of data. For that reason, the initial offload does not process one big data set, but instead partitions the data into batches and processes the batches. If the initial offload fails, e.g. due to a data lake outage, the next offload checks which batches were already completed and continues with those not yet completed.
If the same pipeline has already been started and stopped in the past, a new start of the pipeline does not offload the complete collection, but only data that has been added after the last execution.
Before restarting the periodic offloading, you may have changed the result schema by adding or removing columns (via adding or removing fields from the additional result columns input field). When you restart the pipeline, existing data in the data lake is not modified, but the new data being offloaded incorporates the new schema. When querying such a data set comprising different schemas, the system computes a “merged” schema and (virtually) fills it up with null values where fields have not yet been provided. This usually works without problems if additional attributes are included or removed from the offloading configuration. However, schema merging might fail or lead to unexpected behavior in certain cases. One example is if you change data types, e.g., if the old configuration contained myCustomField1 as a string and you change it to a number via CAST(myCustomField1 AS Integer) AS myCustomField1.
You may have had another offloading pipeline that has already written into the same target table, i.e., the data is stored in the same folder on the data lake. In that case, when starting the new offloading pipeline, you are asked whether you want to flush the existing data or append the data to the existing data. You should only append the data if they share the same schema.
Scheduling settings
The scheduler is configured to run the offloading pipeline once an hour. The precise minute of the hour at which the offloading starts is shown in the pipeline configuration. This minute is assigned by the system to balance the load on the Operational Store of Cumulocity IoT, i.e., to avoid that all offloading jobs from different tenants run at the same time. The schedule settings cannot be modified.
Stopping periodic offloading
Click Active to stop the periodic offloading. Then the scheduler stops scheduling new jobs; active jobs will complete.
Triggering a manual offloading job
If the periodic offloading is enabled, you can also manually trigger an offloading job between two scheduled executions. For example, you might not want to wait for the next scheduled execution to offload recent data into the data lake.
Click Offload now to trigger a manual offloading. As for periodic offloading, a manual offloading execution also processes only incremental data that has been added since the last offloading execution (independent of whether this last execution was triggered manually or by the scheduler).
Viewing the execution status
At the bottom of each pipeline card, the execution status is shown:
Last execution is empty if the offloading has not been executed yet.
Last execution shows the execution time and whether the execution was successful or not, indicated by a success or failure icon right next to the time. An additional icon on the left shows whether the execution was scheduled, indicated by a calendar icon, or manually triggered, indicated by a spot icon.
Next execution shows the point in time for which the next execution is planned. It is only shown if the previous execution was scheduled.
The tables in the next sections summarize the resulting schemas for each of the Cumulocity IoT standard collections. These schemas additionally include virtual columns dir0, …, dir3, which are used for internal purposes. The columns are generated during the extraction process, but neither do they have corresponding data in the Operational Store of Cumulocity IoT, nor are they persisted in the data lake. You must not use dir0, …, dir3 as additional columns or you must rename them accordingly in your offloading configuration.
Offloading the alarms collection
The alarm collection keeps track of alarms which have been raised. During offloading, the data of the alarm collection is flattened, with the resulting schema being defined as follows:
Column name
Column type
id
VARCHAR
count
INTEGER
creationTime
TIMESTAMP
creationTimeOffset
INTEGER
creationTimeWithOffset
TIMESTAMP
time
TIMESTAMP
timeOffset
INTEGER
timeWithOffset
TIMESTAMP
lastUpdated
TIMESTAMP
lastUpdatedOffset
INTEGER
lastUpdatedWithOffset
TIMESTAMP
severity
VARCHAR
history
VARCHAR
source
VARCHAR
status
VARCHAR
text
VARCHAR
type
VARCHAR
Info: The column firstOccurrenceTime is not included in the default schema. If you want to include it in the offloading, it must be added manually.
The alarms collection keeps track of alarms. An alarm may change its status over time. The alarms collection also supports updates to incorporate these changes. For that reason, an offloading pipeline for the alarms collection encompasses additional steps. The first step is to offload those entries of the alarms collection that were added or updated since the last offload. They are offloaded with the above mentioned standard schema into the target table of the data lake. As a second step, two views over the target table are defined in the tenant’s space in Dremio (with alarms used as the target table name in the following examples):
alarms_all: a view with the updates between two offloading executions, not including the intermediate updates. For example, after the first offloading execution, the status of an alarm is ACTIVE. Then it changes its status from ACTIVE to INACTIVE and afterwards back to ACTIVE. When the next offloading is executed, it will persist the latest status ACTIVE, but not the intermediate status INACTIVE (because it happened between two offloading runs and thus is not seen by DataHub).
alarms_latest: a view with the latest status of all alarms, with all previous transitions being discarded.
The events collection manages the events. During offloading, the data of the events collection is flattened, with the resulting schema being defined as follows:
Column name
Column type
id
VARCHAR
creationTime
TIMESTAMP
creationTimeOffset
INTEGER
creationTimeWithOffset
TIMESTAMP
time
TIMESTAMP
timeOffset
INTEGER
timeWithOffset
TIMESTAMP
source
VARCHAR
text
VARCHAR
type
VARCHAR
Events, just like alarms, are mutable, i.e. they can be changed after their creation. Thus, the same logic as for alarms applies.
The following two views exist:
events_all: Contains all states (that were captured by DataHub’s period offloading) of all events
events_latest: Contains only the latest state of all events without prior states
Offloading the inventory collection
The inventory collection keeps track of managed objects. During offloading, the data of the inventory collection is flattened, with the resulting schema being defined as follows:
Column name
Column type
id
VARCHAR
creationTime
TIMESTAMP
creationTimeOffset
INTEGER
creationTimeWithOffset
TIMESTAMP
lastUpdated
TIMESTAMP
lastUpdatedOffset
INTEGER
lastUpdatedWithOffset
TIMESTAMP
name
VARCHAR
owner
VARCHAR
type
VARCHAR
The inventory collection keeps track of managed objects. Note that DataHub automatically filters out internal objects of the Cumulocity IoT platform. These internal objects are also not returned when using the Cumulocity IoT REST API. A managed object may change its state over time. The inventory collection also supports updates to incorporate these changes. For that reason, an offloading pipeline for the inventory encompasses additional steps. The first step is to offload the entries of the inventory collection that were added or updated since the last offload. They are offloaded with the above mentioned standard schema into the target table of the data lake. As a second step, two views over the target table are defined in Dremio (with inventory used as the target table name in the following examples):
inventory_all: a view with the updates between two offloading executions, not including the intermediate updates. For example, after the first offloading execution, the status of a device is ACTIVE. Then it changes its state from ACTIVE to INACTIVE and afterwards to ERROR. When the next offloading is executed, it will persist the status ERROR, but not the intermediate status INACTIVE (because it happened between two offloading runs and thus is not seen by DataHub).
inventory_latest: a view with the latest status of all managed objects, with all previous transitions being discarded.
The measurements collection stores device measurements. Offloading the measurements collection differs from the other collections as you have to explicitly select a measurement type, which ensures that your offloaded data is of the same type. Separating by type is a necessary preprocessing step, as without such a selection a target table for all types would have potentially a very broad schema and a lot of null values.
During offloading, the data of the measurements collection is flattened, with the resulting schema being defined as follows:
Column name
Column type
id
VARCHAR
creationTime
TIMESTAMP
creationTimeOffset
INTEGER
creationTimeWithOffset
TIMESTAMP
time
TIMESTAMP
timeOffset
INTEGER
timeWithOffset
TIMESTAMP
lastUpdated
TIMESTAMP
lastUpdatedOffset
INTEGER
lastUpdatedWithOffset
TIMESTAMP
source
VARCHAR
type
VARCHAR
fragment.attribute1.name.value
Depends on data type, often FLOAT
fragment.attribute1.name.unit
String
…
fragment.attributeN.name.value
Depends on data type, often FLOAT
fragment.attributeN.name.unit
String
myCustomAttribute1
Depends on data type
…
myCustomAttributeN
Depends on data type
The entries in the measurements collection can have a different structure, depending on the types of data the corresponding device emits. While one sensor might emit temperature and humidity values, another sensor might emit pressure values. The flattened structure of these attributes is defined as fragment_ followed by attribute name and associated type being defined as in the measurements collection. The concrete number of attributes depends on the measurement type, illustrated in the above table with fragment_attribute1_name_value to fragment_attributeN_name_value.
When defining the offloading configuration for the measurements collection, you have to specify the measurement type. The offloading pipeline only offloads data for the selected measurement type. Then the target table in the data lake consists of homogeneous data of the same type.
The system automatically detects measurement types from the measurements collection and provides them in the Auto-detected measurement type dropdown field. Select the measurement type you want to offload from that list. If the type is not listed, select the entry Type not listed… and manually define the type in the Measurement Type text field. Click Confirm to continue with the configuration.
Monitoring offloading jobs
Once you have configured and started your offloading pipelines, they regularly offload data to the data lake. DataHub provides insights into the execution status of the different pipelines so that you can investigate whether everything is running as expected.
You can either examine the corresponding latest execution for all configured pipelines or examine the execution history for a specific pipeline.
In the navigator, select Status and then Offloading to get an overview of the latest status of all pipelines. The list shows the corresponding last execution for all pipelines. Each execution consists of the following details:
Component
Description
Status icon
The status of the execution, which is either running, successful, or error
Execution mode icon
The type of execution, which is either scheduled (calendar icon) or manual (spot icon)
Job name
The name of the pipeline job
Execution time
The point in time the execution was started
Runtime (s)
The runtime of the execution in seconds
Next execution time
The point in time for which the next execution is scheduled; for a manual execution it is empty
# Records
The number of records which have been offloaded during this execution, indicated as number in a blue circle
Click Reload to refresh the status being shown.
You can filter the entries by their task name or their status by using the filter controls in the action bar.
History per offloading job
If you want to examine the execution history for a particular job, select Offloading in the navigation bar and select the offloading job you are interested in.
Click Show offloading history in the context menu of the offloading card to show the history of offloading executions.
The list shows the execution history, with each execution consisting of the following details:
Component
Description
Status icon
The status of the execution, which is either running, successful, or error
Execution mode icon
The type of execution, which is either scheduled (calendar icon) or manual (spot icon)
Job name
The name of the pipeline
Execution time
The point in time the execution was started
Runtime (s)
The runtime of the execution in seconds
Next execution time
The point in time for which the next execution is scheduled, provided offloading is activated; for a manual execution it is empty
# Records
The number of records which have been offloaded during this execution, indicated as number in a blue circle
The system is configured to keep a limited history of the last job executions.
Click Reload to refresh the list.
You can filter the entries by their status by using the filter control at the top.
Details of offloading job
For a given offloading job, you can examine additional details of its execution.
Info: You need administration permissions to access the job details.
Select a job overview in the history per offloading job or in the status of all offloading jobs. In the corresponding list of jobs click on the job you are specifically interested in. A details view encompasses the following information:
Execution schedule
Component
Description
Runtime (s)
The runtime of the execution in seconds
Execution mode
The mode of the execution, which is either manual or scheduled
Execution time
The point in time the execution was started
Scheduled execution time
The point in time for which the execution was scheduled
Previous execution time
The point in time the previous execution was started; for a manual execution it is empty
Next execution time
The point in time for which the next execution is scheduled, provided offloading is activated; for a manual execution it is empty
Results
Component
Description
Records
The number of records which have been offloaded during this execution
Job details
Component
Description
Job name
The name of the pipeline
Job id
The internal ID of the job
Job execution id
The Dremio ID of this execution
Source collection
The name of the Cumulocity IoT source collection
Target dataset
The folder name in the data lake
Target folder
The path to the target table in the data lake
Dir0
The name of the folder to which the pipeline has offloaded the data
Last watermark
The last watermark which indicates the data in the Cumulocity IoT collection that has already been processed
CTAS result
During offloading the data is organized in newly created files within the data lake, following a temporal folder hierarchy. For each of those files the following information is provided:
Component
Description
File size
The size of the file
Fragment
The hierarchical ID of the fragment
Partition
The partition with which the file is associated
Path
The path to the file in the data lake
Records
The number of records stored in the file
Monitoring compaction jobs
During offloading, data from the Operational Store of Cumulocity IoT is written into files in the data lake. In order to ensure a compact physical layout of those files, DataHub automatically runs periodic compaction jobs in the background. For each offloading pipeline, a corresponding compaction job is set up and scheduled.
You can examine the latest compaction job for all offloading pipelines or examine the compaction job history for a specific pipeline.
In the navigator, select Compaction under Status to get an overview of the latest status of the compaction jobs for each pipeline. The list shows the corresponding last compaction job for all pipelines. Each compaction consists of the following details:
Component
Description
Status icon
The status of the execution, which is either running, successful, or failed
Job name
The name of the pipeline the compaction job is associated with
Execution time
The point in time the execution was started
Runtime (s)
The runtime of the execution in seconds
Next execution time
The point in time for which the next execution is scheduled
Click Reload to refresh the status being shown.
You can filter the entries by their task name or their status by using the filter controls in the action bar.
History of compactions per offloading pipeline
If you want to examine the compaction history for a particular offloading pipeline, select Offloading in the navigation bar and select the offloading job you are interested in.
Click Show compaction history in the context menu of the offloading card to show the compaction history.
The list shows the execution history with each execution consisting of the following details:
Component
Description
Status icon
The status of the execution, which is either running, successful, or failed
Job name
The name of the pipeline the compaction job is associated with
Execution time
The point in time the execution was started
Runtime (s)
The runtime of the execution in seconds
Next execution time
The point in time for which the next execution is scheduled
The system is configured to keep a limited history of the last compaction jobs.
Click Reload to refresh the list.
You can filter the entries by their status by using the filter control at the top.
Details of compaction job
For a given compaction job, you can examine additional details of its execution.
Select a compaction job overview in the compaction history per offloading job or in the status of all compaction jobs. In the corresponding list of jobs click on the job you are specifically interested in. A details view encompasses the following information:
Execution schedule
Component
Description
Runtime (s)
The runtime of the execution in seconds
Execution time
The point in time the execution was started
Scheduled execution time
The point in time for which the execution was scheduled
Next execution time
The point in time for which the next execution is scheduled
Job details
Component
Description
Job name
The name of the pipeline
Job ID
The internal ID of the job
Job execution ID
The Dremio ID of this execution
Target table name
The folder name in the data lake
Target folder
The path to the target table in the data lake
Daily run
Indicates whether the job is executed daily
Monthly run
Indicates whether the job is executed monthly
Daily CTAS results
During daily compaction the files are merged, following a temporal hierarchy. As a result, a folder for each day of the month is built with one or more file(s) combining all values measured for this day. For each of those files the following information is provided:
Component
Description
File size
The size of the file
Fragment
The hierarchical ID of the fragment
Partition
The partition with which the file is associated
Path
The path to the file in the data lake
Records
The number of records stored in the file
Monthly CTAS results
During monthly compaction the files are merged, following a temporal hierarchy. As a result, a folder for each month is built with one or more file(s) combining all values measured for this month. For each of those files the following information is provided:
Component
Description
File size
The size of the file
Fragment
The hierarchical ID of the fragment
Partition
The partition with which the file is associated
Path
The path to the file in the data lake
Records
The number of records stored in the file
Querying offloaded Cumulocity IoT data
Cumulocity IoT DataHub offers an SQL interface so that you can efficiently query offloaded (device) data and leverage the results in your own applications. A prerequisite for running SQL queries over device data is that you have configured and executed offloading pipelines that replicate and transform data from the Operational Store of Cumulocity IoT to the data lake.
Overview
As described in section Cumulocity IoT DataHub at a glance, Cumulocity IoT DataHub manages offloading pipelines which periodically extract data from the Operational Store of Cumulocity IoT, transform the data into a relational format and finally store it in a data lake. Instead of querying the Operational Store, you run your queries against the data lake. The distributed SQL engine Dremio provides the query interfaces to access the data lake.
Different standard interfaces exist for that purpose, namely JDBC, ODBC, and REST. In order to work with one of those interfaces, select Home in the navigation bar. Under Quick links you will find starting points for the different interfaces.
Access to data lake contents
You need a separate Dremio account to run SQL queries. The Dremio account is required to authenticate your requests when running queries against the data lake using Dremio. Contact the administrator for the Dremio account settings.
When you have established a connection to Dremio, you can run SQL queries against your tables in the data lake (to which new data is appended whenever the offloading pipeline has successfully run). The source you refer to in the query is defined by your account name and the target table you have specified in the offloading configuration. The identifier to be used as the source in a SQL query is defined as follows for the different data lake providers:
Azure Storage: YourTenantIdDataLake.FileSystem.YourAccountName.TargetTable with FileSystem denoting the file system within your Azure Storage account
Amazon S3: YourTenantIdDataLake.Bucket.YourAccountName.TargetTable with Bucket denoting the bucket within your Amazon S3 account
For example, if your tenantId is t47110815 and you have defined an offloading configuration to write the alarms collection to the target table JohnsAlarms in an Azure Storage account containing a file system named Dremio, then an example query would be:
SELECT * FROM t47110815DataLake.Dremio.t47110815.JohnsAlarms;
You can easily look up the paths to the tables in Dremio’s UI. Click on your data lake under “Sources” at the left, then navigate to the table in the right canvas. When you hover over the table name, a small “copy” icon with the tool tip “Copy Path” will appear right of the table name. Clicking on it will copy the table name into your clipboard.
Info: The offloading pipeline has to be executed at least once with corresponding data being offloaded before you can run a query.
Connecting via JDBC
If you have a Java client, you can use JDBC to run SQL queries against the data lake. You have to download the Dremio JDBC driver. You can obtain the JDBC connection string from DataHub by clicking the JDBC icon in the Quick links section of the Home page. As username and password use the credentials from your Dremio account when setting up your JDBC client.
For additional JDBC settings of Dremio see also the associated Dremio documentation.
Connecting via ODBC
If you want to use an ODBC client to run SQL queries against the data lake, you have to configure the platform-specific driver, following the associated Dremio installation instructions. To obtain the ODBC connection string, click the ODBC icon in the Quick links section of the Home page. As username and password use the credentials from your Dremio account when setting up your ODBC client.
Connecting via Dremio REST API
Dremio offers a SQL REST API which you can use to run SQL queries against tables in the data lake. You need to authenticate with your Dremio account against Dremio in order to use the API.
Note that the API might change any time and Software AG does not provide any guarantees. Dremio does not send any CORS headers, so direct access from a browser-based application is not possible. It is highly recommended to use DataHub’s REST API, see below.
Connecting via DataHub REST API
The DataHub server also can handle REST requests for Dremio query processing. The DataHub server acts as a proxy for these requests and forwards them to Dremio for evaluation.
In contrast to directly calling the Dremio REST API, in this case authentication is done against Cumulocity IoT (i.e., using the Cumulocity IoT DataHub user); thus, you need to provide Cumulocity IoT credentials instead of Dremio credentials. You need the corresponding Cumulocity IoT permission to use this API. See the section on Defining DataHub permissions and roles for further details on the required permission.
You will find an example request by clicking the REST API icon in the Quick links section of the Home page.
Request URLs
The URL paths of proxied requests consist of:
the path of the microservice, which you will find in its application properties (see also section Managing applications)
the corresponding Dremio REST API path, prefixed by “/dremio”.
Dremio’s SQL and JOB APIs are supported. Note that you must not provide the authorization header for Dremio when using DataHub REST API. Instead you have to provide the authorization header for DataHub.
The following APIs are available, followed by an example showing their usage. Each enlisted query functionality comprises:
The request to send to the DataHub backend if you want to run the request using DataHub
The equivalent request to send to the Dremio backend if you want to run the request directly against Dremio
The associated Dremio documentation with details on the request
Submitting a query
Submit a query and retrieve the ID of the Dremio job executing this query:
This example submits a Dremio SQL query to fetch the five most recent alarms which already were offloaded, waits for the query to complete, and fetches the result.
Assuming tenantId t47110815, Dremio as name of your file system in Azure Storage, and the table name JohnsAlarms, the SQL query is:
A job state of RUNNING is returned while the query is still being executed, and eventually it changes to COMPLETED or FAILED. Once the job has been completed, its results are returned by the following request:
GET /dremio/api/v3/job/22feee74-875a-561c-5508-04114bdda000/results HTTP/1.1
Host:  datahub-demo.eu-latest.cumulocity.com
Dremio offers support for connecting a variety of clients, including reporting tools like PowerBI and common analytics languages like Python. The Dremio documentation discusses how to connect these clients to Dremio and leverage its query capabilities.
Refining offloaded Cumulocity IoT data
In addition to SQL querying using standard interfaces, you can utilize Dremio functionality to further refine and curate your (device) data.
For a detailed description of all functionalities Dremio provides you can consult the Dremio documentation.
Accessing and logging into Dremio
You access Dremio via a web browser. It has been tested with the following web browsers:
Firefox (latest version)
Chrome (latest version)
Info: Support for mobile devices like smartphones or tablets has not been tested.
To access Dremio, navigate to the home page. Under Quick links click on the Dremio icon. This will direct you to the Login screen of Dremio.
Info: Your Dremio user does not have administration rights in Dremio.
How to log into Dremio
On the Login screen, enter your Dremio account credentials. Click Login to enter Dremio.
When you log in successfully, you will be taken to the home page of Dremio.
When you want to log out, click on your user name at the right of the top bar and then select Log out.
Sources and spaces
On the home page of Dremio you will find at the left under Datasets two panels called Spaces and Sources.
Sources
In the Sources panel there is the data source YourTenantIdDataLake. This source has been auto-configured for you and points to your data lake.
Info: Terminology-wise, Cumulocity IoT DataHub replicates data from the Operational Store of Cumulocity IoT into the data lake. For Dremio the data lake and its target tables is a data source as it allows reading data from it.
When you click on your data source it will be shown in the main panel. Clicking on the source in the main panel navigates into the data source. Here, you see a list of all target tables of your offloading pipelines. Clicking one of these target tables opens an SQL editor which allows you to run queries against that target table.
Info: You might also see a folder named c8y_cdh_temp. The folder is used for DataHub-internal purposes and must not be deleted or altered.
Spaces
A space in Dremio helps in organizing your data sets. Cumulocity IoT DataHub auto-configures a space which is named YourTenantIdSpace, e.g. t47110815Space. A dataset in the space is referred to in queries as YourTenantIdSpace.YourDataset. As described in section Configuring offloading jobs, the inventory and alarms collections already ship two views inventory_all and inventory_latest which are made available in your space.
Job history
The Job History tab at the top of the screen displays jobs/queries you have executed. It allows you to view details of a job by clicking on the particular job and offers filter capabilities (time range, job status, query type, and queue). The Profile view inside the job detail view is very useful to investigate optimization potentials in your queries.
Info: The job history only contains queries that you actively run; the jobs related to the data extraction are hidden.
Creating views
With Cumulocity IoT DataHub, you can replicate data from a Cumulocity IoT collection to a data lake using a default transformation of the data. As requirements for subsequent data analysis of the offloaded device data may vary over time, you should configure your offloading pipeline so that all potentially relevant data is included.
Depending on your use cases, you will often find the need to provide a view on the data, which limits, filters, or transforms the data, e.g. converting Celsius to Fahrenheit or extracting data from JSON fragments.
In Dremio, you can create such a view by defining a corresponding query and saving it as a new dataset. When saving that new dataset, you must select your space as the location and can freely choose a name for the view. Once that is done, you can work with the new dataset as with any other source and run queries against it. This includes in particular querying this view from other clients as described in section Querying offloaded Cumulocity IoT Data.
Info: Such a view is per default not materialized, i.e., it is not stored persistently. Each time you query the view, the underlying query defining the view is run against the source data.
Example
Consider the case that you want to visualize data in a reporting tool. The raw data volume is too high, so you want to instead show the hourly average of the column ‘myValue’. You can easily do that by creating a view with the following SQL statement and saving it as a view/virtual data set:
SELECT DATE_TRUNC('HOUR', "time") as"time", avg(myValue) as hourlyAvg
FROM myTable
GROUPBY DATE_TRUNC('HOUR', "time")
Info: The creation (and update) of views can be done via the Dremio SQL API, too. This is especially useful to automate tasks. The above example can be created or updated as follows.
CREATEORREPLACE VDS YourTenantIdSpace.YourDesiredViewName ASSELECT DATE_TRUNC('HOUR', "time") as"time", avg(myValue) as hourlyAvg
FROM myTable
GROUPBY DATE_TRUNC('HOUR', "time")
Joining tables/views
Views you have defined and target tables from your data lake can be joined as well. In Dremio you can either define joins using the SQL editor or use a graphical interface to define a join.
A general use case for joining is to enrich your alarms, events, or measurement values with metadata from the inventory collection, e.g.
SELECT *
FROM t47110815DataLake.Dremio.t47110815.alarms
JOIN t47110815DataLake.Dremio.t47110815.inventory
USING(id)
DataHub best practices
Learn from well-established usage patterns in order to ensure a robust and scalable processing of your SQL queries.
Naming policies
When defining an offloading configuration, you have to specify the task name, the target table, and a description. You should ensure that you provide reasonable names for each of these settings so that afterwards you can easily find the offloading pipelines you are interested in. A reasonable naming scheme also facilitates writing queries.
Also when defining an offloading configuration, you must always define a target table that is unique among the currently saved configurations. You also should not re-use a target table from an old offloading configuration which was deleted in the meantime. Otherwise, you might run into the problem that your target table consists of data from multiple configurations with potentially different schemas.
Careful definition of additional columns and filter predicate
An offloading configuration allows you to specify additional columns to be offloaded as well as filter predicates for filtering the data. For both settings, you should carefully think about which data you actually need for your processing. Data being filtered out cannot be retrieved any more. Even if you adapt the filter predicate afterwards, the data which would have qualified in previous offloading executions will not be offloaded. You can, however, stop an offloading, change the configuration to include additional fields, etc., and then restart it. When it is restarted, DataHub will ask you whether you want to flush existing data (i.e., re-import) or append. Note that DataHub can only re-import data that is still present in the Operational Store of Cumulocity IoT, i.e., be careful with this option and keep in mind that data retention policies in Cumulocity IoT might have deleted data.
On the other side, data which will definitely be irrelevant for further analysis should not be included in the offloading process.
Decomposition of complex additional columns
You may have stored complex data using JSON fragments as an additional column in a Cumulocity IoT collection. As described in section Configuring offloading jobs, you can add additional columns so that they are included in the offloading process. Within these additional columns, you can apply functions to decompose the fragments into flat data.
Writing these functions is often an iterative process that requires multiple adaptations of the underlying logic. Leverage the Dremio SQL editor and define a dummy offloading configuration which moves a small portion of the data into the data lake for testing purposes. You can use the filter predicate to retrieve such a portion of the data; see below for time filter examples. Then you can open the table created by the offloading configuration with Dremio; using Dremio’s SQL editor, you can develop the extraction logic. Once your decomposition logic for your additional columns is complete, you can copy the column transformations and use them to define a corresponding offloading configuration in DataHub. Once that is done, the test offloading pipeline can be deleted.
Examples for time filters
Depending on the collection, you can use different time filters. All collections support creationTime which represents the timestamp when the entity was persisted by the platform (UTC timezone). Mutable entities (alarms, events, inventory) also support lastUpdated which is the timestamp when the entity was last changed (UTC timezone). time is the application timestamp written by the client; it is supported in alarms, events, and measurements.
The below time filters are examples only; you can use much more complex or simpler combinations with a mixture of AND/OR-connected conditions.
Alarms/events
To offload all alarms or events which have the application time set to between 2020-02-08 14:00:00.000 and 2020-02-08 15:00:00.000, use: