Operating Cumulocity IoT Edge
This section describes the main operating procedures for standard tasks that have to be carried out when managing Cumulocity IoT Edge.
This section describes the main operating procedures for standard tasks that have to be carried out when managing Cumulocity IoT Edge.
The following image shows the networking overlay of Edge server. Two network adapters are attached to the VM with different functionality, as described in the image.

The following image covers the components Cumulocity IoT Edge is built with.

In case of any issues we provide a number of options which help you find out what might be the cause and give advice how to fix it.
We recommend to follow these steps:
If you still need to contact SAG support, include the output of the diagnostics script. See the Diagostics section on details how to run it.
Without working network connection the system is not able to work. The following instructions show how to check the network connectivity of the platform.
The following commands will show the interface and network settings of the machine:
$ ip a
This will list all interfaces and their current configuration.
Example:
$ ip a

1: lo: <LOOPBACK,UP,LOWER_UP> mtu 65536 qdisc noqueue state UNKNOWN group default qlen 1000
link/loopback 00:00:00:00:00:00 brd 00:00:00:00:00:00
inet 127.0.0.1/8 scope host lo
   valid_lft forever preferred_lft forever
inet6 ::1/128 scope host
   valid_lft forever preferred_lft forever

2: enp0s3: <BROADCAST,MULTICAST,UP,LOWER_UP> mtu 1500 qdisc pfifo_fast state UP group default qlen 1000
link/ether 08:00:27:88:e7:de brd ff:ff:ff:ff:ff:ff
inet 10.0.2.15/24 brd 10.0.2.255 scope global noprefixroute dynamic enp0s3
   valid_lft 85338sec preferred_lft 85338sec
inet6 fe80::a00:27ff:fe88:e7de/64 scope link noprefixroute
   valid_lft forever preferred_lft forever

3: enp0s8: <BROADCAST,MULTICAST,UP,LOWER_UP> mtu 1500 qdisc pfifo_fast state UP group default qlen 1000
link/ether 08:00:27:81:fe:9d brd ff:ff:ff:ff:ff:ff
inet 192.168.56.120/24 brd 192.168.56.255 scope global noprefixroute enp0s8
   valid_lft forever preferred_lft forever
inet6 fe80::5b3a:bc65:40b5:f9ea/64 scope link noprefixroute
   valid_lft forever preferred_lft forever
You need to make sure that the node has an external interface (ethX) and the loopback interface configured (lo). The loopback interface needs to have the fixed IP 127.0.0.1 with subnet mask 255.0.0.0 and the IP address of the external interface must reside in the correct subnet with the correct subnet mask (in this examples 255.255.252.0).
The following command lists the local routing information.
$ netstat -rn
Example:
$ netstat -rn
Kernel IP routing table
Destination     Gateway         Genmask         Flags   MSS Window  irtt Iface
0.0.0.0         10.0.2.2        0.0.0.0         UG        0 0          0 enp0s3
10.0.2.0        0.0.0.0         255.255.255.0   U         0 0          0 enp0s3
192.168.56.0    0.0.0.0         255.255.255.0   U         0 0          0 enp0s8
Make sure you have the destination 0.0.0.0 in the list which then also has the gateway flag (G) set.
Try to reach a well-known address in the internet with the following command:
$ ping -s 1500 8.8.8.8
PING 8.8.8.8 (8.8.8.8) 1500(1528) bytes of data.
64 bytes from 8.8.8.8: icmp_seq=1 ttl=56 time=2.61 ms
64 bytes from 8.8.8.8: icmp_seq=2 ttl=56 time=2.80 ms
64 bytes from 8.8.8.8: icmp_seq=3 ttl=56 time=2.82 ms
64 bytes from 8.8.8.8: icmp_seq=4 ttl=56 time=2.75 ms
64 bytes from 8.8.8.8: icmp_seq=5 ttl=56 time=2.79 ms
As when checking the internal reachability you need to make sure that you can see replies from the address you tried to reach. Use Ctrl-C to end the ping command.
This section lists the required services and processes on the Edge server.
You can check the status of the platform by running the following command:
curl -v http://localhost:8181/tenant/health

* About to connect() to localhost port 8181 (#0)
*   Trying ::1...
* Connected to localhost (::1) port 8181 (#0)
> GET /tenant/health HTTP/1.1
> User-Agent: curl/7.29.0
> Host: localhost:8181
> Accept: */*
>
< HTTP/1.1 200 OK
< Content-Type: application/json
< Date: Sat, 05 May 2018 18:13:28 GMT
< Transfer-Encoding: chunked
< Server: Jetty(8.1.19.v20160209)
<
* Connection #0 to host localhost left intact
{
    "status": "UP",
    "services": {
        "details": {},
        "status": "UP"
    },
    "mongodb": {
        "details": {},
        "status": "UP"
    },
    "tenant": {
        "details": {},
        "status": "UP"
    }
}
The ‘status:”UP”’ shows that all services are running.
If something went wrong, the endpoint should respond a different error code then 200 OK. The response should contain something like:
{
   "status":"DOWN",
   "services":{
      "details":{

      },
      "status":"UP"
   },
   "mongodb":{
      "details":{

      },
      "status":"UP"
   },
   "tenant":{
      "details":{
         "notFullyInitializedTenants":{
            "savenindia":"PAYPAL_REFUND",
            "nowa":"PAYPAL_REFUND",
            "ttc":"PAYPAL_REFUND",
            "controllogichh":"PAYPAL_REFUND",
            "jonathan":"PAYPAL_REFUND",
            "barcotrail":"PAYPAL_REFUND",
            "ngservices":"PAYPAL_REFUND",
            "sixsenses":"PAYPAL_REFUND",
            "trav2":"PAYPAL_REFUND",
            "lucaslocatrix":"PAYPAL_REFUND"
         }
      },
      "status":"DOWN"
   }
}
The response contains checks for the most important components:
The list describes the tenants which on the core node have not been fully initialized and the initialization status they are in.
| Status | Description |
|---|---|
| UNINITIALIZED | Tenant has not been initialized |
| DB_INITIALIZED | Database initialisation is performed |
| LOCAL_APPLICATION_INITIALIZED | Local applications are deployed |
| CEP_INITIALIZED | CEP rules are been deployed |
| HEART_BEAT_MONITORING_INITIALIZED | Heartbeat monitoring for devices is been started |
| PAYPAL_REFUND | Failed PayPal operations are refunded (when tenant is using PayPal) |
| BULK_OPERATION_INITIALIZED | Support for bulk operations is initialized |
| FULLY_INITIALIZED | Tenant is in working state (should not be displayed) |
Run the following command to check the REST API availability:
$ curl -u 'edge/<username>:<password>' -v -X GET http://<base_url>/platform

* About to connect() to <base_url> port 80 (#0)
*   Trying 52.29.189.245... connected
* Connected to <base_url> (52.29.189.245) port 80 (#0)
* Server auth using Basic with user 'management/<username>'
> GET /platform HTTP/1.1
> Authorization: Basic bWFuYWdlbWVudC90c3NjaHVlbDohITQ3TmV1bjI3MQ==
> User-Agent: curl/7.19.7 (x86_64-redhat-linux-gnu) libcurl/7.19.7 NSS/3.21 Basic ECC zlib/1.2.3 libidn/1.18 libssh2/1.4.2
> Host: <base_url>
> Accept: */*
>
< HTTP/1.1 200 OK
< Server: nginx
< Date: Tue, 23 Aug 2016 15:39:29 GMT
< Content-Type: application/vnd.com.nsn.cumulocity.platformApi+json; charset=UTF-8; ver=0.9
< Transfer-Encoding: chunked
< Connection: keep-alive
<
{"alarm":{"alarms":{"alarms":null,"self":"http://management.<base_url>/alarm/alarms"},"alarmsForSource":"http://management.<base_url>/alarm/alarms?source={source}","alarmsForSourceAndStatus":"http://management.<base_url>/alarm/alarms?source={source}&status={status}","alarmsForSourceAndStatusAndTime":"http://management.<base_url>/alarm/alarms?source={source}&status={status}&dateFrom={dateFrom}&dateTo={dateTo}","alarmsForSourceAndTime":"http://management.<base_url>/alarm/alarms?source={source}&dateFrom={dateFrom}&dateTo={dateTo}","alarmsForStatus":"http://management.<base_url>/alarm/alarms?status={status}","alarmsForStatusAndTime":"http://management.<base_url>/alarm/alarms?status={status}&dateFrom={dateFrom}&dateTo={dateTo}","alarmsForTime":"http://management.<base_url>/alarm/alarms?dateFrom={dateFrom}&dateTo={dateTo}","self":"http://management.<base_url>/alarm"},…}
This example shows the correct response of the platform. The username and password need to have full read access to the management tenant. The <base_url> needs to be given to connect to the correct platform and the management tenant must not be blocked from outside.
Monit is a small open-source utility for managing and monitoring Unix systems. It conducts automatic maintenance and repair and can execute meaningful causal actions in error situations.
In Edge, Monit is used to monitor processes and take a restart action if any of them is down/inactive. The usual Monit interval (cycle) is 30 seconds.
Monit can provide a quick status report of all configured services and processes by running the following command as admin user:
$ sudo monit summary
There might be cases where Monit has stopped monitoring some resources because of timeout on constant failures or dependency issues.

A specific component, for example, apama-ctrl_proc, can be restarted using the following command:
$ sudo monit restart apama-ctrl_proc
The Monit status can be checked by running:
$ sudo systemctl status monit
Monit can be restarted by running:
$ sudo systemctl restart monit
The log file for monit is located in /var/log/monit.log.
The solution stores log files at the following locations for the different nodes.
| Directory | Files | Usage |
|---|---|---|
| /var/log/cumulocity | access.log error.log karaf.log mqtt.log |
logfile for client access logfile for errors and general informations logfile for the Karaf Container logfile for mqtt protocol communication |
| /var/log/nginx | access.log error.log |
logfile for client access logfile for nginx errors |
| /var/log | messages | general log file, contains also the messages from HAProxy |
To access the apama-ctrl log files, run the command:
$ sudo docker logs apama-ctrl-edge
| Directory | Files | Description |
|---|---|---|
| /var/log/mongodb | mongod.log mongod.log.X.gz mongomongod7.log mongomongod7.log.X.gz |
Log file generated by mongod service Archive of previous log files generated by mongod service Log file generated by mongodmongod7 service Archive of previous log files generated by mongodmongod7 service |
| /var/log | messages | general log file |
| Component | Files | Location |
|---|---|---|
| opcua-agent-server | opcua-agent-server-gc.log opcua-agent-server.log opcua-agent-server-2018-04-30.0.log |
/var/log/opcua/ |
| Smartrule-agent-server-apama | smartrule-agent-server-apama-gc.log smartrule-agent-server-apama.log smartrule.log |
/var/log/smartrule/ |
| cumulocity-agent | cumulocity-agent.log | /var/log/cumulocity-agent/ |
This section describes how to change the log level for Cumulocity-specific applications on the backend side. It does not explain how to change log settings for standard components like databases or other operating system related services.
The log level for Karaf is defined in the following file.
/usr/share/cumulocity-core-karaf/etc/org.ops4j.pax.logging.cfg
The file has the following structure:
# Root logger
log4j.rootLogger=INFO,out,osgi:*
log4j.throwableRenderer=org.apache.log4j.OsgiThrowableRenderer

# Error appender
log4j.appender.out=org.apache.log4j.rolling.RollingFileAppender
log4j.appender.out.rollingPolicy=org.apache.log4j.rolling.FixedWindowRollingPolicy
log4j.appender.out.rollingPolicy.maxIndex=10
log4j.appender.out.triggeringPolicy=org.apache.log4j.rolling.SizeBasedTriggeringPolicy
log4j.appender.out.triggeringPolicy.MaxFileSize=104857600
log4j.appender.out.rollingPolicy.FileNamePattern=${karaf.data}/log/error-%i.log.gz
log4j.appender.out.rollingPolicy.ActiveFileName=${karaf.data}/log/error.log
log4j.appender.out.layout=org.apache.log4j.PatternLayout
log4j.appender.out.layout.ConversionPattern=%d{yyyy-MM-dd} %d{HH:mm:ss}  | %-5.5p | %-16.16t | %-32.32c{1} | %X{bundle.id} - %X{bundle.name} - %X{bundle.version} | %m%n
log4j.appender.out.append=true

# CXF request and response info:
# * ERROR - none
# * INFO - just headers (default)
# * DEBUG - whole, with payloads
log4j.additivity.com.cumulocity.rest.interceptors=false
log4j.logger.com.cumulocity.rest.interceptors=INFO,access

# Access appender
log4j.appender.access=org.apache.log4j.rolling.RollingFileAppender
log4j.appender.access.rollingPolicy=org.apache.log4j.rolling.FixedWindowRollingPolicy
log4j.appender.access.rollingPolicy.maxIndex=10
log4j.appender.access.triggeringPolicy=org.apache.log4j.rolling.SizeBasedTriggeringPolicy
log4j.appender.access.triggeringPolicy.MaxFileSize=262144000
log4j.appender.access.rollingPolicy.FileNamePattern=${karaf.data}/log/access-%i.log.gz
log4j.appender.access.rollingPolicy.ActiveFileName=${karaf.data}/log/access.log
log4j.appender.access.layout=org.apache.log4j.PatternLayout
log4j.appender.access.layout.ConversionPattern=%d{yyyy-MM-dd} %d{HH:mm:ss}  | %-5.5p | %-16.16t | %-32.32c{1} | %X{bundle.id} - %X{bundle.name} - %X{bundle.version} | %m%n
log4j.appender.access.append=true

# Error response info:
# * INFO - just error message (default)
# * DEGUB - full stack trace
log4j.logger.com.cumulocity.rest.mediatypes=INFO
Change the following entries to adjust the log levels:
log4j.rootLogger=INFO,out,osgi:*

log4j.logger.com.cumulocity.rest.interceptors=INFO,access

og4j.logger.com.cumulocity.rest.mediatypes=INFO
Adjust the log levels by changing the level attribute according to the following values. The levels are inclusive - meaning a given level will also include all “lower” log levels, e.g. when you set the level to WARN you will also get ERROR events.
| Level | Description |
|---|---|
| ERROR | Log errors only |
| WARN | Give information up to warnings |
| INFO | Give information about normal operations |
| DEBUG | Log all internal debug information |
Save the file. It is re-read by the application every few minutes so you do not have to restart the Java process.
The diagnostic utility is enabled by default and runs periodically. However, this can also be triggered manually on demand. To execute it manually, follow the steps below.
cd opt/c8y/utilities/diagnostic-utility
sudo ./run_data_collector.py
The basic hardware information of the target system is captured. These reports are placed under the ‘hardware’ directory.
The following hardware information is available:
Information |
Description |
|---|---|
| CPU | Reads and gathers CPU information from “/proc/cpuinfo” |
| Memory | Reads and gathers memory information from “/proc/meminfo” |
| Detailed system summary | Data is captured using the ‘lswh’ command. Data includes multiple components like network, display adapter, bridge, IDE etc. This command is executed as sudo to capture all available details. |
| Short system summary | Data is captured using the ‘lswh’ command, here the data is in precise format. This command is executed as sudo to capture all available details. |
| PCI | Data related to installed PCI devices is captured using the ‘lspci’ command |
| Storage | Data is an aggregation of the output of the commands ‘df’ and ‘lsblk’ |
The basic software information of the target system is captured. These reports are placed under the ‘software’ directory.
The following software information is available:
Information |
Description |
|---|---|
| IP | Reads basic IP information from the target system using the ‘ip’ command |
| OS | Collects various OS information like name, version, release etc. using the commands ‘lsb_release’ and ‘uname’ |
| Installed package | A list of installed packages is prepared using the ‘rpm’ command |
| Running processes | A list of running processes is prepared using the ‘ps’ command |
| Top result | Captures the output of top command. This report is very informative as it holds information of running processes at argument level and their respective resource consumption. |
This section contains information on the running Cumulocity processes, health endpoint check result, Cumulocity logs etc.
The following Cumulocity information is collected:
Information |
Description |
|---|---|
| Health endpoint result | Cumulocity and its microservices provide health endpoints, from which the user can get the system status. |
| Mongo command execution result | MongoDB supports commands execution, which can give the status of the MongoDB server. Currently ‘ping’, ‘dbstats’ and ‘serverStatus’ commands are executed on each of the MongoDB nodes (currently it is management and edge). The MongoDB commands give vital information about the MongoDB server like the db version, process-id, uptime information etc. |
| Mongo top output | The output of mongo top command is captured here |
| Thread dumps | Thread dumps of all the running java processes and mongo processes are captured. For java processes the ‘jstack’ command is executed to get the thread dumps. For non-java processes like MongoDB, the ‘pstack’ command is used. Furthermore the ‘pstack’ command is applied on java processes as well. |
| Log files | Archive of log files from Cumulocity, its microservices and Apama is created. In case of Cumulocity, only the ‘live’ logs are considered and roll-over log files are discarded. |
| Configuration files | Archive of Cumulocity configuration files from Cumulocity and its microservices is created. |
| Jstat dumps | Jstat command provides performance statistics for a given JVM. |
Jstat dumps can provide information on the following options:
As per the current implementation, the 5 statistics counts are collected at an interval of 50ms. To improve performance, this task is executed via threads.
Following are the supported startup parameters for the monitor and the data collector.
The data collector can be started by running the “run_data_collector.py” script located under “/opt/c8y/utilities/diagnostic-utility/src/”.
Following are the supported command line arguments which can be used while invoking the script. More than one of the supported arguments can be used simultaneously.
The monitor can be started by running the “run_monitor.py” script located under “/opt/c8y/utilities/diagnostic-utility/src/”.
The monitor script supports only one optional startup parameter:
The diagnostic utility can be customized using a properties file located under “/etc/diagnostic-utility/diagnostic_utility.properties”.
Following are the available keys used in the configuration file:
Information |
Description |
|---|---|
| notify.support.by.email | Allows users to select whether they want to receive the diagnostic report via email |
| support.email | Email ID to be used by the utility while sending support email |
| smtp.server.host | SMTP host for sending support email |
| smtp.server.port | SMTP port to be used by the utility while sending support email |
| smtp.username | SMTP username to be used by the utility while sending support email |
| smtp.password | SMTP password to be used by the utility while sending support email |
| log.backup | Components for which log backup has to be done |
| configuration.backup | Components for which configuration backup has to be done |
| report.directory | Report directory where the diagnostic reports have to be placed |
| {component-name}.log.path | Absolute log path of components who do not use /var/log as their logging directory |
Info: If you use opcua-agent-server and you are upgrading from an earlier version of Edge to the latest version, you must execute the below mentioned commands in your EDGE VM to backup opcua-agent-server data. This has to be performed before following any of the steps described below.
Additionally, please request the Cumulocity support for root user credentials if you don’t have it.
mkdir -p /usr/edge/properties/opcua/db
cp -a /etc/opcua/db/. /usr/edge/properties/opcua/db/
To upgrade the Edge VM on VMware ESXi:
Power off the Edge VM from ESXi console.
Select the Edge VM and click Actions > Export.
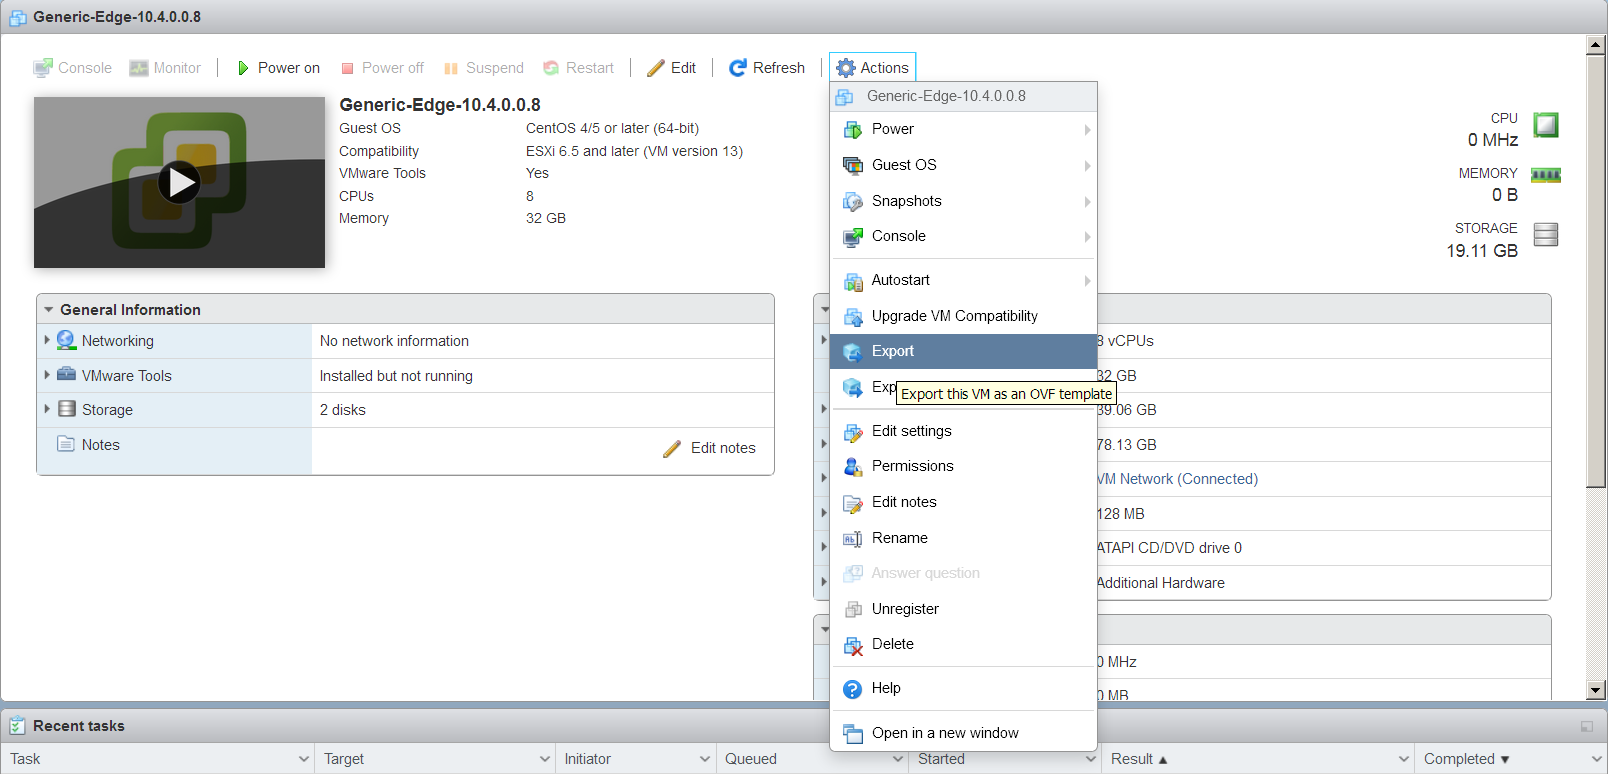
Click OK to download the files.
This action downloads the following files:
Download the latest version to a separate folder.
For example, if you are upgrading to Cumulocity IoT Edge version 10.5, save the following files to a separate folder:
Copy the DATA/secondary disk of the exported VM to the latest version.
For example, copy the secondary disk disk-1.vmdk to the folder to which you have downloaded the latest version.
Remove the secondary disk of the latest version and rename the secondary disk of the exported version to the latest version.
For example:
If the size of the secondary disk has expanded, you must update the OVF file of the latest version accordingly. In the OVF file, search for the fields ovf:capacity and ovf:capacityAllocationUnits and update the values as per the values in the exported OVF file.
Import the Edge VM image as described in Setting up ESXi.
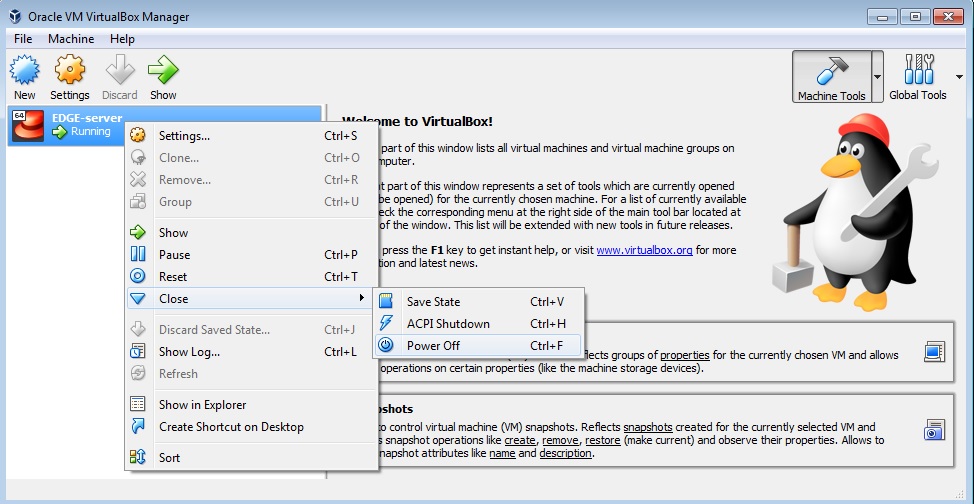
To upgrade the Edge VM on VirtualBox:
sudo shutdown
Navigate to the VM directory. For VirtualBox it is [USER-DIRECTORY]\VirtualBox VMs. Move the entire VM folder (e.g. EDGE-server) to a safe location.
In the VirtualBox Manager, right-click on the VM and then click Remove. In the upcoming window, select Remove Only so that the VM will not be deleted.

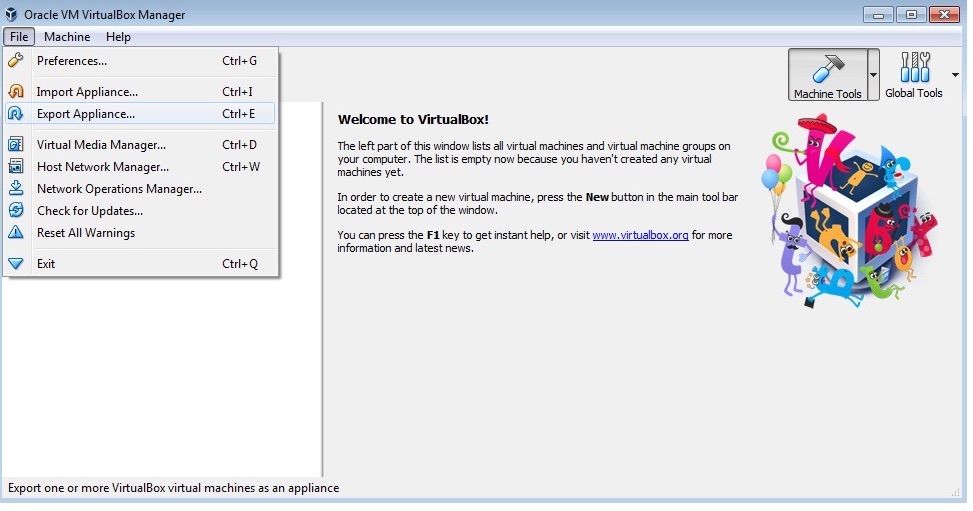
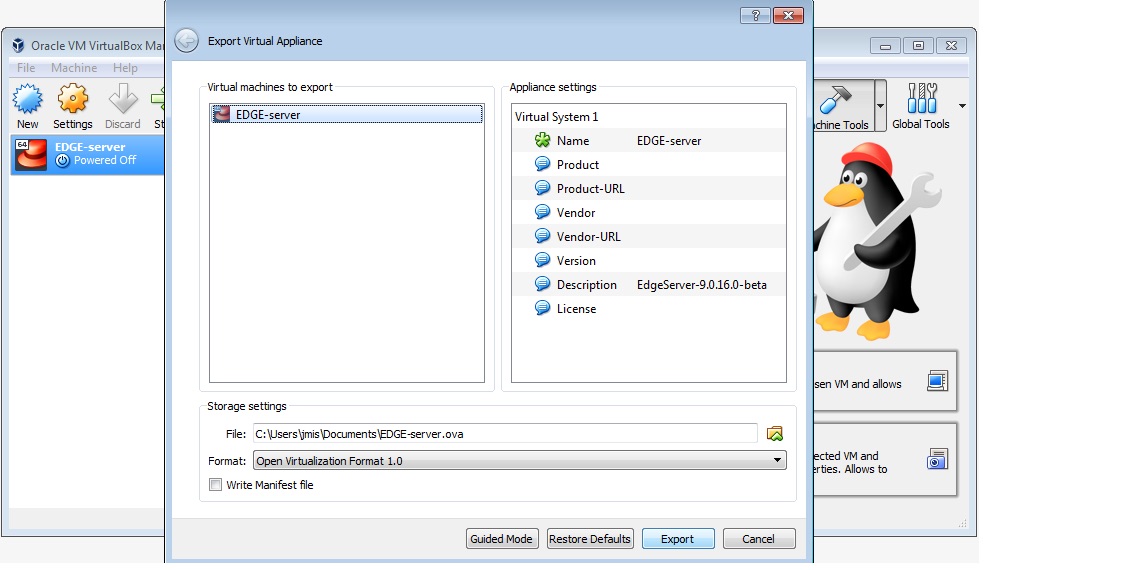
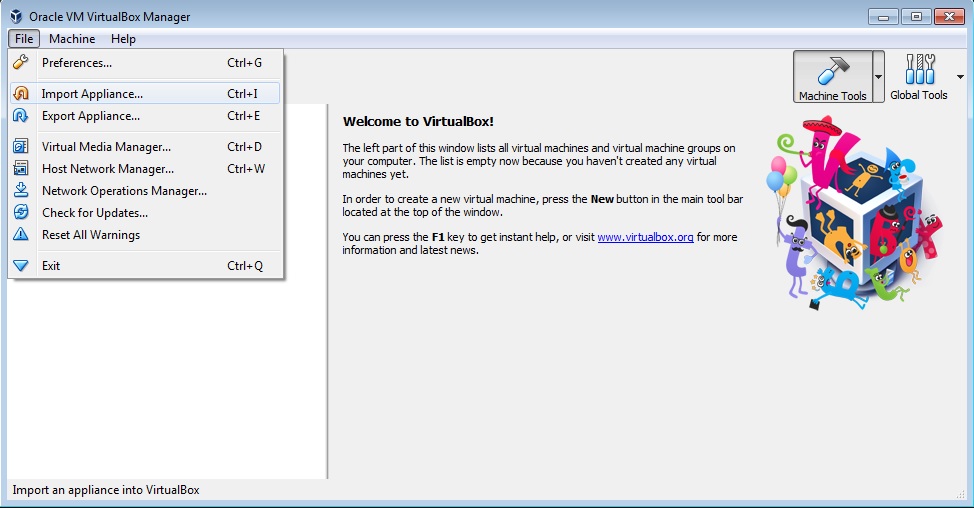
Import the new version of EDGE server. To do so, click File and then Import Appliance in the VirtualBox Manager. Select the new OVA file (upgraded one supplied by Cumulocity) and click Open to import it.
The new Edge version should now be visible in the VirtualBox Manager in powered-off state.
Right-click on the VM and select Settings. In the upcoming window, select Storage. Two disks should be visible called “disk001.vmdk” and “disk002.vmdk”.
Right-click on the second disk i.e. disk002.vmdk, and select Remove attachment.
Right-click on the second controller i.e. SATA controller and select Add Hard Disk. In the upcoming window, select Choose existing disk.

In the explorer, navigate to the previously backed-up EDGE folder as per step 2. Select the secondary disk, i.e. disk002.vmdk, and click OK.
Power on the VM by clicking the Start button.
Invoke the post-installer by running the script post-installation.sh located in the directory /opt/c8y/utilities.
sudo ./post_installation.sh
Choose the post-upgrade task (option 4). Provide inputs if prompted and complete the post-upgrade task. For details see Configuration.
Verify, whether DB and property files are intact and unchanged.
To create a backup, follow the steps below.
Info: You may append the current date to the image name (e.g. EDGE-server-12-06-2018.ova) so as to have a track of the backups.
To create a restore, follow the steps below.
The tenant admin user could be locked if incorrect credentials are passed during login into UI, REST API or MQTT.

To unlock the tenant admin user, perform the following steps:
To configure the “reset password” template and email server settings, perform the following steps:
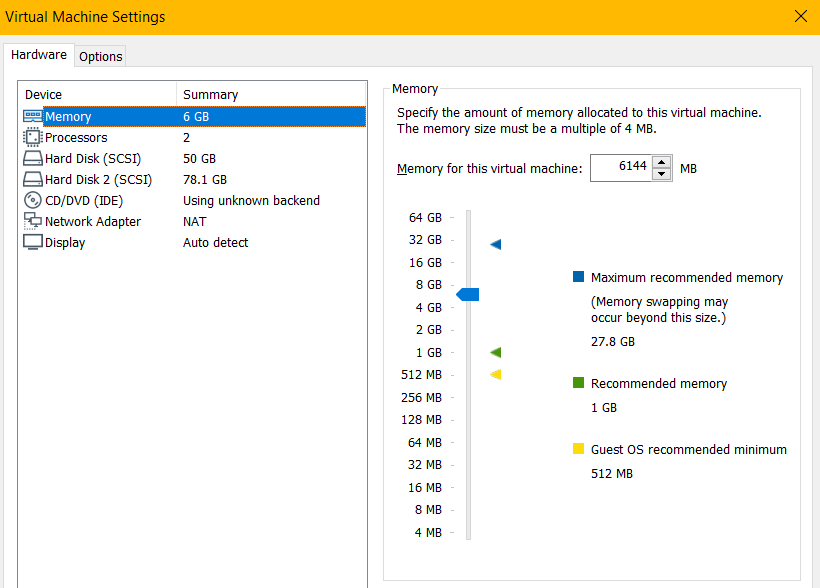
If the system performance is slow, the memory should be increased. First, increase the memory of the VM. This is done by stopping the VM and increasing its memory.
Increasing the VM memory should be followed by a JVM memory increase.
This is done by starting the VM (follow the steps described in the Installation section). Log into VM, open the file /usr/share/cumulocity-core-karaf/bin/setenv and edit it as described below. The parameter is the following, default size is 1024.
export JAVA_MAX_MEM=1024M # Maximum memory for the JVM
After increasing the size, restart Karaf by executing:
[admin@server ~]$ sudo service cumulocity-core-karaf stop
and
[admin@server ~]$ service cumulocity-core-karaf start
The components for which log rotation is configured are as follows:
| Component | Log file location | Log file rotation | Max file size | Max backup index |
|---|---|---|---|---|
| Karaf | ${karaf.data}/log/error.log | Daily | 50 MB | 14 |
| MQTT | ${karaf.data}/log/mqtt.log | Daily | 50 MB | 14 |
| Access | ${karaf.data}/log/access.log | Daily | 50 MB | 14 |
| DataBroker | ${karaf.data}/log/databroker.log | Daily | 50 MB | 14 |
The components for which log rotation is configured are as follows:
| Component | Log file location | Log file rotation | Max file size | Max backup index |
|---|---|---|---|---|
| MongoDB | /var/log/mongodb/*.log | Daily | 50 MB | 14 |
| NginX | /var/log/nginx/*.log | Daily | 50 MB | 14 |
| Apama | /var/log/apama/*.log | Daily | 50 MB | 14 |
For microservices, there currently is no specific log rotation configured.
For many use cases, and especially when using APAMA, time synchronization must be available, i.e. the time inside the VM must be synchronized with the time of the host OS and with devices sending data.
Out of the box, for VMWare-based installations, vmtools is responsible for time synchronization with the host OS. For VirtualBox-based installations, VirtualBox guest additions is responsible.
Additionally, chrony or ntp services can be configured by end users based on their time synchronization needs. Refer to the respective documentation for the configuration of these services. These services are by default stopped and disabled in Edge and can be enabled by standard commands.
On the Edge server, run the following commands as admin user.
| Process | Command |
|---|---|
| Start | [admin@server ~]$ sudo service cumulocity-core-karaf start |
| Stop | [admin@server ~]$ sudo service cumulocity-core-karaf stop |
On the Edge server, run the following commands as admin user.
| Process | Command |
|---|---|
| Start | [admin@server ~]$ sudo systemctl start opcua-agent-server |
| Stop | [admin@server ~]$ sudo systemctl stop opcua-agent-server |
| Restart | [admin@server ~]$ sudo systemctl restart opcua-agent-server |
On the Edge server, run the following commands as admin user.
| Process | Command |
|---|---|
| Start | [admin@server ~]$ sudo systemctl start smartrule |
| Stop | [admin@server ~]$ sudo systemctl stop smartrule |
| Restart | [admin@server ~]$ sudo systemctl restart smartrule |
On the Edge server, run the following commands as admin user.
| Process | Command |
|---|---|
| Start | [admin@server ~]$ sudo service apama start |
| Stop | [admin@server ~]$ sudo service apama stop |
| Restart | [admin@server ~]$ sudo service apama restart |