Diagnostics and support
This section describes the main operating procedures for standard tasks that have to be carried out when managing Cumulocity IoT Edge.
This section describes the main operating procedures for standard tasks that have to be carried out when managing Cumulocity IoT Edge.
The diagnostic utility is enabled by default and runs periodically. However, this can also be triggered manually on demand. To execute it manually, follow the steps below.
cd /opt/c8y/utilities/diagnostic-utility
sudo ./run_data_collector.py
The basic hardware information of the target system is captured. These reports are placed under the ‘hardware’ directory.
The following hardware information is available:
Information |
Description |
|---|---|
| CPU | Reads and gathers CPU information from “/proc/cpuinfo” |
| Memory | Reads and gathers memory information from “/proc/meminfo” |
| Detailed system summary | Data is captured using the ‘lswh’ command. Data includes multiple components like network, display adapter, bridge, IDE etc. This command is executed as sudo to capture all available details. |
| Short system summary | Data is captured using the ‘lswh’ command, here the data is in precise format. This command is executed as sudo to capture all available details. |
| PCI | Data related to installed PCI devices is captured using the ‘lspci’ command |
| Storage | Data is an aggregation of the output of the commands ‘df’ and ‘lsblk’ |
The basic software information of the target system is captured. These reports are placed under the ‘software’ directory.
The following software information is available:
Information |
Description |
|---|---|
| IP | Reads basic IP information from the target system using the ‘ip’ command |
| OS | Collects various OS information like name, version, release etc. using the commands ‘lsb_release’ and ‘uname’ |
| Installed package | A list of installed packages is prepared using the ‘rpm’ command |
| Running processes | A list of running processes is prepared using the ‘ps’ command |
| Top result | Captures the output of top command. This report is very informative as it holds information of running processes at argument level and their respective resource consumption. |
This section contains information on the running Cumulocity IoT processes, health endpoint check result, Cumulocity IoT logs etc.
The following Cumulocity IoT information is collected:
Information |
Description |
|---|---|
| Health endpoint result | Cumulocity IoT and its microservices provide health endpoints, from which the user can get the system status. |
| Mongo command execution result | MongoDB supports commands execution, which can give the status of the MongoDB server. Currently ‘ping’, ‘dbstats’ and ‘serverStatus’ commands are executed on each of the MongoDB nodes (currently it is management and edge). The MongoDB commands give vital information about the MongoDB server like the db version, process-id, uptime information etc. |
| Mongo top output | The output of mongo top command is captured here |
| Thread dumps | Thread dumps of all the running java processes and mongo processes are captured. For java processes the ‘jstack’ command is executed to get the thread dumps. For non-java processes like MongoDB, the ‘pstack’ command is used. Furthermore the ‘pstack’ command is applied on java processes as well. |
| Log files | Archive of the log files from Cumulocity IoT, its microservices and Apama is created. |
| Configuration files | Archive of Cumulocity IoT configuration files from Cumulocity IoT and its microservices is created. |
| Jstat dumps | Jstat command provides performance statistics for a given JVM. |
Jstat dumps can provide information on the following options:
As per the current implementation, the 5 statistics counts are collected at an interval of 50ms. To improve performance, this task is executed via threads.
Following are the supported startup parameters for the monitor and the data collector.
The data collector can be started by running the “run_data_collector.py” script located under “/opt/c8y/utilities/diagnostic-utility/”.
Following are the supported command line arguments which can be used while invoking the script. More than one of the supported arguments can be used simultaneously.
The monitor can be started by running the “run_monitor.py” script located under “/opt/c8y/utilities/diagnostic-utility/src/”.
The monitor script supports only one optional startup parameter:
The logs of the Kubernetes components are captured at: /tmp/diagnostic-utility/diagnostic_report_XXXXX/cumulocity/log_archive/kubernetes_logs.zip.
The kubernetes_logs.zip file contains the logs of all Kubernetes platform components at “kube-system” path in the archive. The components captured are:
Info: The XX represents randomly generated alphanumeric sequences in these pod names and would vary in your environment.
The hosted microservices are captured at cumulocity-single-node path in the archive. The pre-installed component kube-registry-persistent-secure-xx-xx is already available in the archive. The logs of any additional microservices that are uploaded will also be available at this path.
The diagnostic utility can be customized using a properties file located under “/etc/diagnostic-utility/diagnostic_utility.properties”.
Important: The SMTP properties in the table below are only for collecting diagnostics information. For configuring the email server, see Administration > Changing settings> Configuration settings in the User guide.
Following are the available keys used in the configuration file:
Information |
Description |
|---|---|
| email.notification | Allows users to select whether they want to receive the diagnostic report via email |
| recipient.email | Recipient email ID that receives the support email |
| smtp.server.host | SMTP host for sending support email |
| smtp.server.port | SMTP port to be used by the utility while sending support email |
| smtp.username | SMTP username to be used by the utility while sending support email |
| smtp.password | SMTP password to be used by the utility while sending support email |
| components.for.log.backup | Components for which the log backup has to be performed |
| components.for.configuration.backup | Components for which the configuration backup has to be performed |
| report.directory | Report directory where the diagnostic reports have to be placed |
| {component-name}.log.path | Absolute log path of the components under “component.for.log.backup” which do not use /var/log as the logging directory |
| containers.to.monitor | Containers for which log backup is required. The container names are separated by a comma. These log files are retrieved using docker logs. |
| services.to.monitor | Services for which log backup is required. The service names are separated by a comma. These log files are retrieved using journalctl. |
The following instructions show how to check the network connectivity of the platform.
The following commands will show the interface and network settings of the machine:
[admin@iot-edge-server ~]$ ip a
This will list all interfaces and its current configuration.
Example:
[admin@iot-edge-server ~]$ ip a

1: lo: <LOOPBACK,UP,LOWER_UP> mtu 65536 qdisc noqueue state UNKNOWN group default qlen 1000
link/loopback 00:00:00:00:00:00 brd 00:00:00:00:00:00
inet 127.0.0.1/8 scope host lo
   valid_lft forever preferred_lft forever
inet6 ::1/128 scope host
   valid_lft forever preferred_lft forever

2: enp0s3: <BROADCAST,MULTICAST,UP,LOWER_UP> mtu 1500 qdisc pfifo_fast state UP group default qlen 1000
link/ether 08:00:27:88:e7:de brd ff:ff:ff:ff:ff:ff
inet 10.0.2.15/24 brd 10.0.2.255 scope global noprefixroute dynamic enp0s3
   valid_lft 85338sec preferred_lft 85338sec
inet6 fe80::a00:27ff:fe88:e7de/64 scope link noprefixroute
   valid_lft forever preferred_lft forever

3: enp0s8: <BROADCAST,MULTICAST,UP,LOWER_UP> mtu 1500 qdisc pfifo_fast state UP group default qlen 1000
link/ether 08:00:27:81:fe:9d brd ff:ff:ff:ff:ff:ff
inet 192.168.56.120/24 brd 192.168.56.255 scope global noprefixroute enp0s8
   valid_lft forever preferred_lft forever
inet6 fe80::5b3a:bc65:40b5:f9ea/64 scope link noprefixroute
   valid_lft forever preferred_lft forever
You need to make sure that the node has an external interface (ethX) and the loopback interface configured (lo). The loopback interface needs to have the fixed IP 127.0.0.1 with subnet mask 255.0.0.0, and the IP address of the external interface must reside in the correct subnet with the correct subnet mask (in this example 255.255.252.0).
The following command lists the local routing information.
[admin@iot-edge-server ~]$ netstat -rn
Example:
[admin@iot-edge-server ~]$ netstat -rn
Kernel IP routing table
Destination     Gateway         Genmask         Flags   MSS Window  irtt Iface
0.0.0.0         10.0.2.2        0.0.0.0         UG        0 0          0 enp0s3
10.0.2.0        0.0.0.0         255.255.255.0   U         0 0          0 enp0s3
192.168.56.0    0.0.0.0         255.255.255.0   U         0 0          0 enp0s8
Make sure you have the destination 0.0.0.0 in the list which then also has the gateway flag (G) set.
Try to reach a well-known address in the internet with the following command:
[admin@iot-edge-server ~]$ ping -s 1500 8.8.8.8
PING 8.8.8.8 (8.8.8.8) 1500(1528) bytes of data.
64 bytes from 8.8.8.8: icmp_seq=1 ttl=56 time=2.61 ms
64 bytes from 8.8.8.8: icmp_seq=2 ttl=56 time=2.80 ms
64 bytes from 8.8.8.8: icmp_seq=3 ttl=56 time=2.82 ms
64 bytes from 8.8.8.8: icmp_seq=4 ttl=56 time=2.75 ms
64 bytes from 8.8.8.8: icmp_seq=5 ttl=56 time=2.79 ms
As when checking the internal reach ability, you need to make sure that you can see the replies from the address you tried to reach. Use Ctrl-C to end the ping command.
This section lists the required services and processes on the Edge appliance.
You can check the status of the platform by running the following command:
curl -v http://localhost:8181/tenant/health

* About to connect() to localhost port 8181 (#0)
*   Trying ::1...
* Connected to localhost (::1) port 8181 (#0)
> GET /tenant/health HTTP/1.1
> User-Agent: curl/7.29.0
> Host: localhost:8181
> Accept: */*
>
< HTTP/1.1 200 OK
< Content-Type: application/json
< Date: Sat, 05 May 2018 18:13:28 GMT
< Transfer-Encoding: chunked
< Server: Jetty(8.1.19.v20160209)
<
* Connection #0 to host localhost left intact
{
	"status": "UP",
	"services": {
		"details": {},
		"status": "UP"
	},
	"mongodb": {
		"details": {},
		"status": "UP"
	},
	"tenant": {
		"details": {},
		"status": "UP"
	}
}
The ‘status:“UP”’ shows that all services are running.
If something fails, the endpoint should respond a different error code. The response should contain something like:
{
   "status":"DOWN",
   "services":{
      "details":{

      },
      "status":"UP"
   },
   "mongodb":{
      "details":{

      },
      "status":"UP"
   },
   "tenant":{
      "details":{
         "notFullyInitializedTenants":{
            "savenindia":"PAYPAL_REFUND",
            "nowa":"PAYPAL_REFUND",
            "ttc":"PAYPAL_REFUND",
            "controllogichh":"PAYPAL_REFUND",
            "jonathan":"PAYPAL_REFUND",
            "barcotrail":"PAYPAL_REFUND",
            "ngservices":"PAYPAL_REFUND",
            "sixsenses":"PAYPAL_REFUND",
            "trav2":"PAYPAL_REFUND",
            "lucaslocatrix":"PAYPAL_REFUND"
         }
      },
      "status":"DOWN"
   }
}
The response contains checks for the most important components:
The list describes the tenants which on the core node have not been fully initialized and the initialization status they are in.
| Status | Description |
|---|---|
| UNINITIALIZED | Tenant has not been initialized |
| DB_INITIALIZED | Database initialisation is performed |
| LOCAL_APPLICATION_INITIALIZED | Local applications are deployed |
| CEP_INITIALIZED | CEP rules are been deployed |
| HEART_BEAT_MONITORING_INITIALIZED | Heartbeat monitoring for devices is been started |
| PAYPAL_REFUND | Failed PayPal operations are refunded (when tenant is using PayPal) |
| BULK_OPERATION_INITIALIZED | Support for bulk operations is initialized |
| FULLY_INITIALIZED | Tenant is in working state (should not be displayed) |
Run the following command to check the REST API availability:
[admin@iot-edge-server ~]$ curl -u 'edge/<username>:<password>' -v -X GET http://<base_url>/platform

* About to connect() to <base_url> port 80 (#0)
*   Trying 52.29.189.245... connected
* Connected to <base_url> (52.29.189.245) port 80 (#0)
* Server auth using Basic with user 'management/<username>'
> GET /platform HTTP/1.1
> Authorization: Basic bWFuYWdlbWVudC90c3NjaHVlbDohITQ3TmV1bjI3MQ==
> User-Agent: curl/7.19.7 (x86_64-redhat-linux-gnu) libcurl/7.19.7 NSS/3.21 Basic ECC zlib/1.2.3 libidn/1.18 libssh2/1.4.2
> Host: <base_url>
> Accept: */*
>
< HTTP/1.1 200 OK
< Server: nginx
< Date: Tue, 23 Aug 2016 15:39:29 GMT
< Content-Type: application/vnd.com.nsn.cumulocity.platformApi+json; charset=UTF-8; ver=0.9
< Transfer-Encoding: chunked
< Connection: keep-alive
<
{"alarm":{"alarms":{"alarms":null,"self":"http://management.<base_url>/alarm/alarms"},"alarmsForSource":"http://management.<base_url>/alarm/alarms?source={source}","alarmsForSourceAndStatus":"http://management.<base_url>/alarm/alarms?source={source}&status={status}","alarmsForSourceAndStatusAndTime":"http://management.<base_url>/alarm/alarms?source={source}&status={status}&dateFrom={dateFrom}&dateTo={dateTo}","alarmsForSourceAndTime":"http://management.<base_url>/alarm/alarms?source={source}&dateFrom={dateFrom}&dateTo={dateTo}","alarmsForStatus":"http://management.<base_url>/alarm/alarms?status={status}","alarmsForStatusAndTime":"http://management.<base_url>/alarm/alarms?status={status}&dateFrom={dateFrom}&dateTo={dateTo}","alarmsForTime":"http://management.<base_url>/alarm/alarms?dateFrom={dateFrom}&dateTo={dateTo}","self":"http://management.<base_url>/alarm"},…}
This example shows the correct response of the platform. The username and password need to have full read access to the Management tenant. The <base_url> needs to be given to connect to the correct platform and the Management tenant must not be blocked from outside.
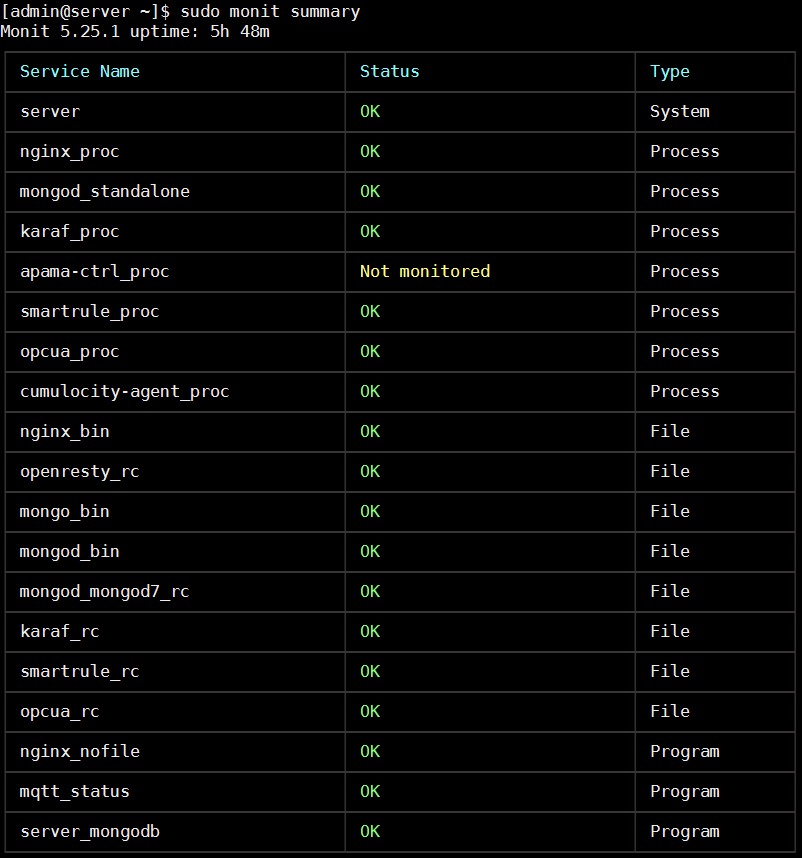
Monit is a small open-source utility for managing and monitoring the Unix systems. The Monit utility conducts automatic maintenance and repair, and can execute meaningful causal actions in error situations.
In Cumulocity IoT Edge, Monit is used to monitor the processes and perform a restart if any of the processes is down or inactive. The usual Monit interval (cycle) is 30 seconds.
Monit can provide a quick status report of all the configured services and processes by running the following command:
[admin@iot-edge-server ~]$ sudo monit summary
There might be cases where Monit has stopped monitoring some resources because of timeout on constant failures or dependency issues.
A specific component, for example, apama-ctrl_proc, can be restarted using the following command:
[admin@iot-edge-server ~]$ sudo monit restart apama-ctrl_proc
The Monit status can be checked by running:
[admin@iot-edge-server ~]$ sudo systemctl status monit
Monit can be restarted by running:
[admin@iot-edge-server ~]$ sudo systemctl restart monit
The log file for monit is located in /var/log/monit.log.
Important: If the processes are monitored by monit, the processes restart after you run the stop command.
In the Edge appliance, run the following commands as admin user.
| Process | Command |
|---|---|
| Start | [admin@iot-edge-server ~]$ sudo service cumulocity-core-karaf start |
| Stop | [admin@iot-edge-server ~]$ sudo service cumulocity-core-karaf stop |
In the Edge appliance, run the following commands as admin user.
| Process | Command |
|---|---|
| Start | [admin@iot-edge-server ~]$ sudo service opcua-mgmt-service start |
| Stop | [admin@iot-edge-server ~]$ sudo service opcua-mgmt-service stop |
| Restart | [admin@iot-edge-server ~]$ sudo service opcua-mgmt-service restart |
| Status | [admin@iot-edge-server ~]$ sudo service opcua-mgmt-service status |
In the Edge appliance, run the following commands as admin user.
| Process | Command |
|---|---|
| Start | [admin@iot-edge-server ~]$ sudo service opcua-device-gateway start |
| Stop | [admin@iot-edge-server ~]$ sudo service opcua-device-gateway stop |
| Restart | [admin@iot-edge-server ~]$ sudo service opcua-device-gateway restart |
| Status | [admin@iot-edge-server ~]$ sudo service opcua-device-gateway status |
In the Edge appliance, run the following commands as admin user.
| Process | Command |
|---|---|
| Start | [admin@iot-edge-server ~]$ sudo systemctl start smartrule |
| Stop | [admin@iot-edge-server ~]$ sudo systemctl stop smartrule |
| Restart | [admin@iot-edge-server ~]$ sudo systemctl restart smartrule |
In the Edge appliance, run the following commands as admin user.
| Process | Command |
|---|---|
| Start | [admin@iot-edge-server ~]$ sudo service apama start |
| Stop | [admin@iot-edge-server ~]$ sudo service apama stop |
| Restart | [admin@iot-edge-server ~]$ sudo service apama restart |
The solution stores log files at the following locations for the different nodes.
| Directory | Files | Usage |
|---|---|---|
| /var/log/cumulocity | access.log error.log karaf.log mqtt.log |
logfile for client access logfile for errors and general information logfile for the Karaf Container logfile for mqtt protocol communication |
| /var/log/nginx | access.log error.log |
logfile for client access logfile for nginx errors |
| /var/log | messages | general log file, contains also the messages from HAProxy |
To access the apama-ctrl log files, run the command:
[admin@iot-edge-server ~]$ sudo docker logs apama-ctrl-edge
| Directory | Files | Description |
|---|---|---|
| /var/log/mongodb | mongod.log mongod.log.X.gz mongomongod7.log mongomongod7.log.X.gz |
Log file generated by mongod service Archive of previous log files generated by mongod service Log file generated by mongodmongod7 service Archive of previous log files generated by mongodmongod7 service |
| /var/log | messages | general log file |
| Component | Files | Location |
|---|---|---|
| opcua-mgmt-service | opcua-mgmt-service.log | /var/log/opcua/ |
| opcua-device-gateway | opcua-device-gateway.log | /var/log/opcua/ |
| Smartrule-agent-server-apama | smartrule-agent-server-apama-gc.log smartrule-agent-server-apama.log smartrule.log |
/var/log/smartrule/ |
| cumulocity-agent | cumulocity-agent.log | /var/log/cumulocity-agent/ |
See Log files for details on DataHub log files.
The components for which log rotation is configured are as follows:
| Component | Log file location | Log file rotation | Max file size | Max backup index |
|---|---|---|---|---|
| Karaf | ${karaf.data}/log/error.log | Daily | 50 MB | 14 |
| MQTT | ${karaf.data}/log/mqtt.log | Daily | 50 MB | 14 |
| Access | ${karaf.data}/log/access.log | Daily | 50 MB | 14 |
| DataBroker | ${karaf.data}/log/databroker.log | Daily | 50 MB | 14 |
Under /etc/ configured via logrotate.conf and configuration files under /etc/logrotate.d
The components for which log rotation is configured are as follows:
| Component | Log file location | Log file rotation | Max file size | Max backup index |
|---|---|---|---|---|
| MongoDB | /var/log/mongodb/*.log | Daily | 50 MB | 14 |
| NginX | /var/log/nginx/*.log | Daily | 50 MB | 14 |
| Apama | /var/log/apama/*.log | Daily | 50 MB | 14 |
For microservices, there currently is no specific log rotation configured.
In case of any issues, we recommend you to follow these steps:
These steps help you analyze the issue and provide a fix. If you still need to contact Software AG support, include the output of the diagnostics dump. For more information about using the diagnostics, see Diagnostics.